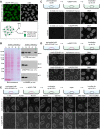
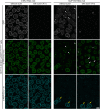
. 2022 Aug 1;33(9):ar82.
doi: 10.1091/mbc.E22-02-0037. Epub 2022 May 24.

ZC3HC1 is a structural element of the nuclear basket effecting interlinkage of TPR polypeptides

Affiliations

ZC3HC1 is a structural element of the nuclear basket effecting interlinkage of TPR polypeptides

Philip Gunkel et al. Mol Biol Cell. .

Abstract

The nuclear basket (NB), anchored to the nuclear pore complex (NPC), is commonly looked upon as a structure built solely of protein TPR polypeptides, the latter thus regarded as the NB's only scaffold-forming components. In the current study, we report ZC3HC1 as a second structural element of the NB. Recently described as an NB-appended protein omnipresent in vertebrates, we now show that ZC3HC1, both in vivo and in vitro, enables in a stepwise manner the recruitment of TPR subpopulations to the NB and their linkage to already NPC-anchored TPR polypeptides. We further demonstrate that the degron-mediated rapid elimination of ZC3HC1 results in the prompt detachment of the ZC3HC1-appended TPR polypeptides from the NB and their release into the nucleoplasm, underscoring the role of ZC3HC1 as a natural structural element of the NB. Finally, we show that ZC3HC1 can keep TPR polypeptides positioned and linked to each other even at sites remote from the NB, in line with ZC3HC1 functioning as a protein connecting TPR polypeptides.


Figures
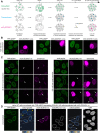
FIGURE 1:
FIGURE 1:
Ectopically expressed ZC3HC1 depletes the nuclear pool of soluble TPR in ZC3HC1 KO cells by enabling its recruitment to the NE. (A) Timeline displaying the chronological order of procedures in this experiment schematically. Note that after transfection in G2, the all-in-one vectors encoding the constitutively expressed transactivator and either a doxycycline-inducible WT or mutant version of mCherry-tagged HsZC3HC1 (see also Supplemental Figure S3) were considered incorporated into nuclei mostly during nuclear reassembly later in mitosis. Constitutive expression and gradual accumulation of the Tet-On transactivator were then directly from the G1 phase on, which allowed for inducing the actual reporter gene expression (here, the WT version depicted) by adding doxycycline at about 11 h postmitosis. (B) Live-cell fluorescence microscopy of TPR-sfGFP–expressing HeLa ZC3HC1 KO cells transfected with an all-in-one vector encoding the mutant version C429S of ZC3HC1, inspected 120–150 min postinduction with doxycycline. The exemplifying micrographs show a selection of transfected cells in which the amounts of the ectopically expressed mutant protein differ. Note that even upon conspicuous expression of this TPR-binding–incompetent mutant, the nucleoplasmic pool of TPR-sfGFP remained unaffected, being indistinguishable in appearance from that of neighboring untransfected cells. Bar, 10 µm. (C) ZC3HC1 KO cells like those in B but transfected with an expression vector encoding the mCherry-tagged intact WT version of ZC3HC1 capable of binding to the NE. These cells were inspected either 30–60 min or 120–150 min postinduction. Microscope settings were identical at the different time points, as was the degree of mCherry signal enhancement that was done only after image acquisition. The exemplifying micrographs show a selection of transfected cells with different amounts of the ectopically expressed protein. Note that these images cannot claim to represent a proper time course experiment that allows for correlating timespan with gradual protein accumulation within transfected cells at different time points, simply because plasmid copy numbers per cell likely vary significantly between cells. Nonetheless, already after short time lengths, the nuclear pool of GFP-tagged TPR was notably diminished or no longer detectable (two exemplifying nuclei marked by arrowheads). The latter was even so in those transfected cells (several demarked by arrows) in which the amounts of ZC3HC1 synthesized until then were barely detectable via their mCherry tags at standard microscope settings, likely due to the relatively slow and here not yet completed mCherry maturation, which in turn also prompted the presentation of electronically brightness-enhanced images. Bar, 10 µm. (D) IFM of cell-cycle–synchronized cells transfected with the all-in-one mCherry-ZC3HC1 expression vector and treated with doxycycline as outlined in A, yet having started with a mixed population of TPR-sfGFP–expressing ZC3HC1 KO cells and HeLa WT cells expressing ZC3HC1 and nontagged TPR. Such mixed populations allowed for comparing the amount of endogenous ZC3HC1 at the WT cell’s NE relative to that eventually occurring at the ZC3HC1 KO cell’s NE, here focusing on those KO cells in which the mCherry signal intensity at the NE seemed to have reached a maximum. Cells shown here were harvested 120 min postinduction and then detergent-permeabilized before fixation. The latter allowed for removing 1) the soluble pool of TPR still existing in the nontransfected KO and 2) the surplus of soluble mCherry-ZC3HC1 for which no further binding sites existed at the NEs of the transfected cells, which, in turn, allowed for a better assessment of signal intensities at only the NEs. The cells were then fixed with FA before being labeled with a HsZC3HC1 antibody and a sdAb specific for mCherry. Micrographs showing sfGFP-tagged TPR and antibody-labeled ZC3HC1 are also shown colorgraded to display differences in pixel intensities via a color LUT, with areas harboring WT cells, two transfected KO cells (KO+), and some nontransfected KO cells (KO−) marked accordingly. Note that the intensities of ZC3HC1 immunolabeling at the WT cells’ NEs (marked by arrowheads in the color-graded micrograph on the right side) and at the NEs of those ZC3HC1 KO cells that had been ectopically expressing mCherry-ZC3HC1 (white arrows) were very similar. As an aside, also note again that TPR signal intensities at the NEs of those KO cells ectopically expressing ZC3HC1 (see KO+ cells in the color-graded micrograph on the left) were notably higher than at the NEs of those neighboring cells on the same coverslip that had remained nontransfected (KO−) and lacked mCherry fluorescence (yellow arrows). Bar, 10 µm.
FIGURE 2:
FIGURE 2:
Ectopically expressed ZC3HC1 can bind to the ZC3HC1-independent pool of NPC-anchored TPR polypeptides in vitro. (A) Depiction of experimental materials and starting conditions, comprising (A1) HeLa ZC3HC1 KO cells permeabilized with TX-100 and cleared of soluble TPR polypeptides (for additional information, see Supplemental Figure S5), and (A2) supernatants of HEK293T cell extracts containing ectopically expressed variants of mCherry-ZC3HC1. The latter were obtained after cell permeabilization with elevated concentrations of digitonin, high-speed centrifugation, and immunodepletion of TPR. The micrographs in A2 show representative live-cell images of the transiently transfected cell population, also schematically depicted on the right. Bar, 100 µm. (B) IBs of a selection of the cellular fractions obtained from HEK293T cells ectopically expressing mCherry-ZC3HC1. Loaded fractions included the total cell extract (T) and the digitonin-containing soluble cell extracts, obtained after 20,000 and 200,000 × g centrifugation and containing minor amounts of soluble TPR (S 20,000 and S 200,000), which was common for HEK293T cells ectopically expressing large amounts of recombinant ZC3HC1. Loadings also included the corresponding pellets of these centrifugation steps (P 20,000 and P 200,000), the 200,000 × g cell extract supernatant mock-depleted with magnetic beads only coated with protein A (Smock 200,000) and the same supernatant TPR-depleted with protein A beads coated with HsTPR antibodies (S-TPR 200,000). Such latter supernatant cleared of TPR is here marked with an arrowhead and represented the mCherry-ZC3HC1–containing cell extract eventually used for the interaction experiments. For further comparison, additional lanes were loaded with materials released from the TPR beads during the second of two successive washing steps (W) and those eventually eluted from these beads with SDS-containing sample buffer (E). Most lanes were loaded with the respective amount from the same number of HEK293T cells (4 V), while relative amounts of the total cell extract and the 20,000 × g pellet material corresponded only to one fourth thereof (1 V), whereas the W and TPR-IP fractions represented fivefold higher relative amounts (20 V). The incubations with HsTPR and HsZC3HC1 antibodies and, for comparison, with LMNB antibodies, were on different parts of the Ponceau S–stained membrane shown here and on another one with identical amounts loaded. Note that essentially no TPR was detectable within the 200,000 × g supernatant after the TPR depletion procedure. As an aside, also note that the fraction of immunodepleted TPR contained coimmunoprecipitated mCherry-ZC3HC1, which underscored the necessity to remove the minor pool of soluble TPR from the 200,000 × g supernatant to avoid the experiment’s conclusiveness spoiled by soluble TPR-ZC3HC1 assemblies. (C, D) Fluorescence microscopy of detergent-extracted ZC3HC1 KO cells incubated with TPR-free cell extracts containing similar amounts of either (C) the mCherry-tagged C429S mutant version of ZC3HC1 incapable of TPR binding or (D) the WT ZC3HC1 protein. Interaction experiments were performed in parallel in neighboring wells, and images of the unfixed cells, also stained with the DNA dye Hoechst 33342, were acquired with identical microscope settings at 1 and 10 min after adding the cell extracts. Because of the necessity to omit anti-fade media and the fact that focusing on the equatorial plane of the extracted cells was more time-consuming than for intact or fixed cells, images taken at different time points were not from identical groups of cells but only from neighboring groups of the same sample, to avoid pronounced photobleaching. Moreover, reduced laser power, compared with that for IFM images, was chosen for the image acquisition of the in vitro assembly experiments, which later was followed by electronic brightness enhancement in the same proportional manner and identical extent for all of these images (see Material and Methods). Note that no mCherry fluorescence appeared to be enriched specifically at the NEs treated with the C429S mutant. By contrast, those NE scaffolds incubated with the WT version for a similarly long time were notably fluorescent. Bars, 10 µm.
FIGURE 3:
FIGURE 3:
Ectopically expressed ZC3HC1 loaded onto the ZC3HC1-independent pool of NPC-anchored TPR can attract additionally provided TPR polypeptides, resulting in both types of proteins steadily appended to the NE. (A) Representative live-cell image of the sfGFP-TPR–expressing HeLa ZC3HC1 KO cell line, next to a schematic depiction of the high-speed supernatant of a detergent-free extract isolated from such cells containing the soluble pool 2 polypeptides of sfGFP-TPR. Bar 25 µm. (B) IBs of a selection of the cellular fractions from the sfGFP-TPR–expressing ZC3HC1 KO cells. Loaded fractions included the total cell extract (T), the soluble extracts obtained after cell disruption by gentle sonication and subsequent centrifugation at 20,000 × g (S 20,000) and 200,000 × g (S 200,000), and the corresponding pellet fractions (P 20,000 and P 200,000). Lanes were loaded with amounts corresponding to the same number of HeLa ZC3HC1 KO cells. Immunolabelings for TPR, NPC component NUP153, and nuclear lamina component LMNB, the two latter proteins shown for comparison, were on different parts of the Ponceau S–stained membrane shown here and on an identically loaded duplicate. Note that the 200,000 × g supernatant, marked with an arrowhead and representing the cell extract with the soluble sfGFP-TPR categorized as pool 2 polypeptides and eventually used for the interaction experiments, was virtually free of LMNB and NUP153. This finding indicated that the solution did not contain tiny NE and NPC fragments, which one might have expected due to the sonication process. Furthermore, it neither contained considerable amounts of NUP153 as the only other known TPR-binding protein reported to play a role in binding TPR subpopulations to NPCs. (C) Fluorescence microscopy of the detergent-extracted ZC3HC1 KO cells in the complete absence of ZC3HC1, both before (no load) and after incubation with the ZC3HC1-free but sfGFP-TPR–containing cell extract at RT (120 min). Note that the images of the not-loaded cells labeled “mCh channel” and “GFP channel” actually reflected the degree of autofluorescence of detergent-extracted HeLa cells at different wavelengths. With the microscope settings chosen, essentially no autofluorescence was detected at the mCherry excitation wavelengths, while only some autofluorescence was notable at wavelengths that would excite GFP. These microscope settings were kept the same also for corresponding images in D and E. Further note that after incubations of up to 120 min with the sfGFP-TPR extract, there was hardly any sfGFP fluorescence detected at some of the ZC3HC1-deficient NEs, while it was only marginally enhanced at others beyond the autofluorescence background in this wavelength range. Bar, 10 µm. (D) Fluorescence microscopy, with microscope settings as in C, but here of NE scaffolds that had first been loaded with the mCherry-tagged WT version of HsZC3HC1, followed by the removal of the unbound surplus of mCherry-ZC3HC1 by brief washes with assembly buffer (preloaded specimen). Soluble sfGFP-TPR polypeptides were added immediately after the last wash, using the same sfGFP-TPR aliquot as for C, with interaction experiments shown as C and D performed almost simultaneously in parallel in neighboring wells, with the double-loaded specimens shown here also imaged after 120 min. Note that the sfGFP-tagged TPR polypeptides had specifically and conspicuously accumulated at the NE scaffolds preloaded with mCherry-ZC3HC1. As an aside, one needs to mention that sfGFP-TPR signal intensities at the NEs of the permeabilized cells would not have been able to reach the levels in a WT cell expressing all pool 1 and pool 2 TPR polypeptides as tagged with sfGFP, because all pool 1 TPR polypeptides within the ZC3HC1 KO cells, here used as binding platforms, were untagged. Bar, 10 µm. (E) Fluorescence microscopy of initially ZC3HC1-deficient NE scaffolds that had been loaded with mCherry-ZC3HC1 first, then briefly washed in assembly buffer, immediately incubated in an sfGFP-TPR–containing cell extract for 150 min, washed again, and then kept within the same assembly buffer for at least 10 h. In this experiment, distinct from the one in D, the specimens were inspected at different time points, revealing gradual accumulation of the sfGFP-TPR polypeptides at the mCherry-ZC3HC1–loaded NEs until seemingly reaching a steady-state level of TPR at such NEs. Note that this binding appeared rather persistent following the extract removal and brief washing (“after wash”), with only moderate reduction of the NE-associated sfGFP and mCherry fluorescence even after prolonged incubation in cell extract–free buffer at RT overnight. Bar, 10 µm.
FIGURE 4:
FIGURE 4:
Auxin-induced TPR degradation in a homozygous sfGFPL9mIAA7-TPR cell line results in the detachment and solubilization of NB-bound ZC3HC1. (A) IFM of cells from the HCT116 progenitor MCL expressing the naturally tag-free TPR and cells of the homozygous HCT116 progeny line, in which all TPR polypeptides occur N-terminally tagged with sfGFPL9mIAA7. Cells had been cocultured and synchronized as mixed populations together on the same coverslip, followed by an additional incubation of 1 h in the absence (A1) or presence (A2) of auxin. Specimens were then double-immunolabeled for TPR and ZC3HC1 and analyzed in parallel, using identical microscope settings. Arrowheads mark the nuclei of some MCL cells, i.e., those expressing the tag-free version of TPR, while arrows point at some of the progeny cells’ nuclei, i.e., those with the sfGFP-tagged TPR. Note, in A1, that the amounts of sfGFPL9mIAA7-tagged TPR appended to the NEs did not notably differ from the amounts in the neighboring tag-free cells. Further note, in A2, that auxin treatment resulted in the complete elimination of any visible NE-associated GFP and TPR immunostaining in those cells that had been expressing the tagged version of TPR, while the MCL cells’ untagged TPR polypeptides remained unaffected. In particular, note that eliminating the tagged TPR had caused ZC3HC1 to be no longer detectable at the NE but distributed throughout most of the nuclear interior instead. Bar, 10 µm. (B) IB of cell extracts obtained from the sfGFPL9mIAA7-TPR HCT116 cells treated with auxin, or only with DMSO, for 1 h. Similar numbers of cells of the two differently treated batches had then been extracted with TX-100 in parallel, resulting each in a fraction of soluble proteins (S) and a corresponding pellet fraction (P) also containing the NPCs and normally, that is, in the absence of auxin, the complement of NB proteins. Equal portions of each fraction’s whole amount were loaded for SDS–PAGE and IB. Incubations with HsTPR and HsZC3HC1 antibodies, and HsNUP153 antibodies for comparison, were on different parts of the Ponceau S–stained membrane shown here and on another one with identical loadings. Note that TPR was no longer detectable after auxin treatment. Moreover, ZC3HC1, mainly part of the LNN-enriched pellet fraction of cells not treated with auxin, had been released into solution upon auxin-induced TPR degradation, while the exclusive presence of NUP153 within the NPC-NB–enriched fraction had remained unaffected.
FIGURE 5:
FIGURE 5:
Auxin-induced rapid and quantitative ZC3HC1 degradation in a homozygous ZC3HC1-sfGFPL9mIAA7 cell line results in the concomitant detachment of large amounts of NB-positioned TPR. (A) IFM of cells from the HCT116 progenitor MCL expressing the naturally tag-free ZC3HC1 and cells of the homozygous HCT116 progeny line, in which all ZC3HC1 polypeptides were C-terminally tagged with sfGFPL9mIAA7. Cells had been cocultured and synchronized as mixed populations together on the same coverslip, followed by an additional incubation of 90 min in the absence (A1) or presence (A2) of auxin. Specimens were then double-immunolabeled for ZC3HC1 and TPR and analyzed in parallel, using identical microscope settings, with staining for TPR also shown color graded to display differences in pixel intensities via a color LUT. Arrowheads mark the nuclei of some MCL cells, i.e., those expressing the tag-free version of ZC3HC1, while arrows point at some of the progeny cells’ nuclei, i.e., those with the sfGFP-tagged ZC3HC1. Note, in A1, that the amounts of sfGFPL9mIAA7-tagged ZC3HC1 appended to the NEs did not notably differ from the amounts in the neighboring tag-free cells. Further note, in A2, that auxin treatment resulted in the elimination of NE-associated GFP and immunostaining for ZC3HC1 in those cells that had been expressing the tagged version of ZC3HC1, while the MCL cells’ untagged ZC3HC1 remained unaffected. In particular, note that eliminating the tagged ZC3HC1 had caused a conspicuous reduction in the intensity of TPR immunolabeling at the NE, with a significant amount of TPR then distributed throughout most of the nuclear interior. Bar, 10 µm. (B) Quantification of signal yields for immunolabeled TPR at the NEs, following the incubation with auxin of the same mixed population of HCT116 cells expressing the tag-less and the sfGFPL9mIAA7-tagged ZC3HC1. Randomly chosen NE segments for quantifications (sfGFPL9mIAA7-tagged: n = 97; tag-less: n = 50) via ImageJ were essentially from all labeled cells in equatorial view within several randomly chosen images, all of which were from the same specimen that also provided the micrograph for A2. Box plots display the relative signal intensity values, with the arithmetic means marked by x, with the ones for the cells not treated with auxin set to 100%, and with the SDs provided. Note that the mean TPR signal yield for the KO cells’ ZC3HC1-free NEs was only about half the WT cells’ corresponding value. (C) IB of cell extracts obtained from ZC3HC1-sfGFPL9mIAA7 HCT116 cells treated with DMSO or with auxin for 90 min. Applying conditions maintaining NB integrity, cells had been extracted with TX-100, resulting in fractions of soluble (S) and nonsoluble proteins (P), with equal portions of each fraction’s whole amount then loaded for IB. Incubations with HsTPR and HsZC3HC1 antibodies, and HsNUP153 antibodies for comparison, were on different parts of the Ponceau S–stained membrane shown here and on another one with identical loadings. The asterisk marks a cross-reaction unrelated to ZC3HC1. Note that ZC3HC1 had been largely degraded after the 90-min treatment with auxin, accompanied by a minor increase in the TPR amount detectable within the soluble cell fraction, while the presence of NUP153 within the pellet fraction had remained unaffected.
FIGURE 6:
FIGURE 6:
Ensembles of degron-tagged ZC3HC1 and TPR, remote from the NB due to NUP153 deficiency, are rapidly disassembled upon auxin-induced ZC3HC1 degradation, which results in TPR polypeptides being unleashed again. IFM of ZC3HC1-sfGFPL9mIAA7 HCT116 cells treated with nontarget control (CTRL) or NUP153 siRNAs and, at day 3 posttransfection, with DMSO or with auxin for 4 h, with specimens then analyzed in parallel, using identical microscope settings. Upon NUP153 RNAi, only traces of NUP153 immunolabeling were present at most of the cells’ NEs; the usually bright NE staining for NUP153 was visible only in cells that had remained nontransfected (some marked by yellow arrows), here shown as a reference. In the NUP153-deficient cells, NE staining for TPR and ZC3HC1 was conspicuously reduced, with the latter two proteins then colocalizing, in the absence of auxin, in numerous, here primarily cytoplasmic foci (some marked by arrowheads). Note that ZC3HC1 and such foci were hardly detectable anymore (some small remnants encircled) after auxin treatment, with TPR then appearing distributed throughout the NUP153- and ZC3HC1-deficient cells’ nucleoplasm (some marked by white arrows). Bar, 10 µm.

References

    1. Aksenova V, Lee HN, Smith A, Chen S, Bhat P, Iben J, Echeverria C, Fontoura B, Arnaoutov A, Dasso M (2019). Distinct basket nucleoporins roles in nuclear pore function and gene expression: Tpr is an integral component of the TREX-2 mRNA export pathway. BioRxiv, https://doi .org./10.1101/685263. - DOI
    1. Aksenova V, Smith A, Lee H, Bhat P, Esnault C, Chen S, Iben J, Kaufhold R, Yau KC, Echeverria C, et al. (2020). Nucleoporin TPR is an integral component of the TREX-2 mRNA export pathway. Nat Commun 11, 4577. - PMC - PubMed
    1. Aleman JR, Kuhn TM, Pascual-Garcia P, Gospocic J, Lan Y, Bonasio R, Little SC, Capelson M (2021). Correct dosage of X chromosome transcription is controlled by a nuclear pore component. Cell Rep 35, 109236. - PMC - PubMed
    1. Ashkenazy-Titelman A, Shav-Tal Y, Kehlenbach RH (2020). Into the basket and beyond: the journey of mRNA through the nuclear pore complex. Biochem J 477, 23–44. - PubMed
    1. Bassermann F, von Klitzing C, Illert AL, Münch S, Morris SW, Pagano M, Peschel C, Duyster J, Klitzing C, Illert AL, et al. (2007). Multisite phosphorylation of nuclear interaction partner of ALK (NIPA) at G2/M involves cyclin B1/Cdk1. J Biol Chem 282, 15965–15972. - PubMed

MeSH terms