. 2023 Feb 14;25(2):263-276.
doi: 10.1093/neuonc/noac138.

Dysfunctional dendritic cells limit antigen-specific T cell response in glioma

Affiliations

Dysfunctional dendritic cells limit antigen-specific T cell response in glioma

Mirco Friedrich et al. Neuro Oncol. .

Abstract

Background: Dendritic cells (DC), the most potent professional antigen presenting cells capable of effective cross-presentation, have been demonstrated to license T helper cells to induce antitumor immunity in solid tumors. Specific DC subtypes are recruited to the injured brain by microglial chemokines, locally adapting to distinct transcriptional profiles. In isocitrate dehydrogenase (IDH) type 1 mutant gliomas, monocyte-derived macrophages have recently been shown to display an attenuated intratumoral antigen presentation capacity as consequence of the local accumulation of the oncometabolite R-2-hydroxyglutarate. The functionality and the contribution of DC to the IDH-mutant tumor microenvironment (TME) remains unclear.

Methods: Frequencies and intratumoral phenotypes of human DC in IDH-wildtype (IDHwt) and -mutant high-grade gliomas are comparatively assessed by transcriptomic and proteomic profiling. DC functionality is investigated in experimental murine glioblastomas expressing the model antigen ovalbumin. Single-cell sequencing-based pseudotime analyses and spectral flow cytometric analyses are used to profile DC states longitudinally.

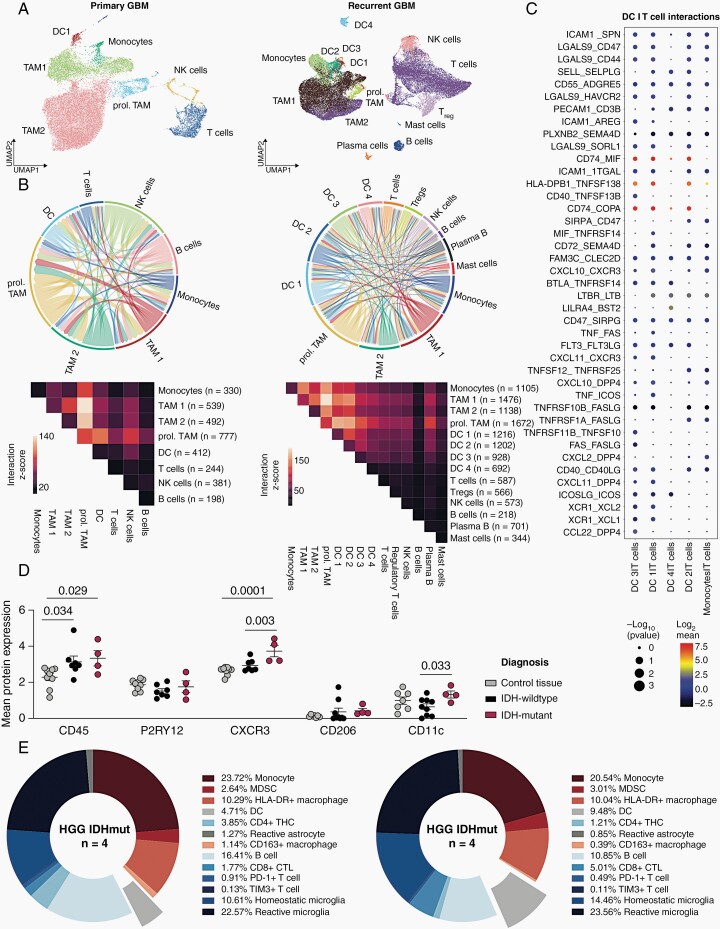
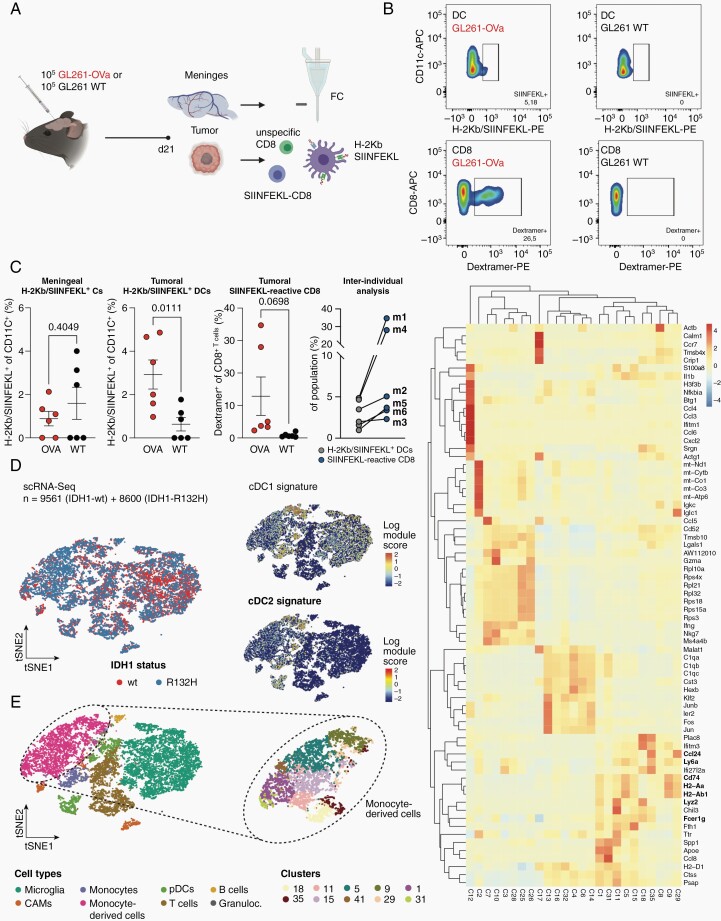
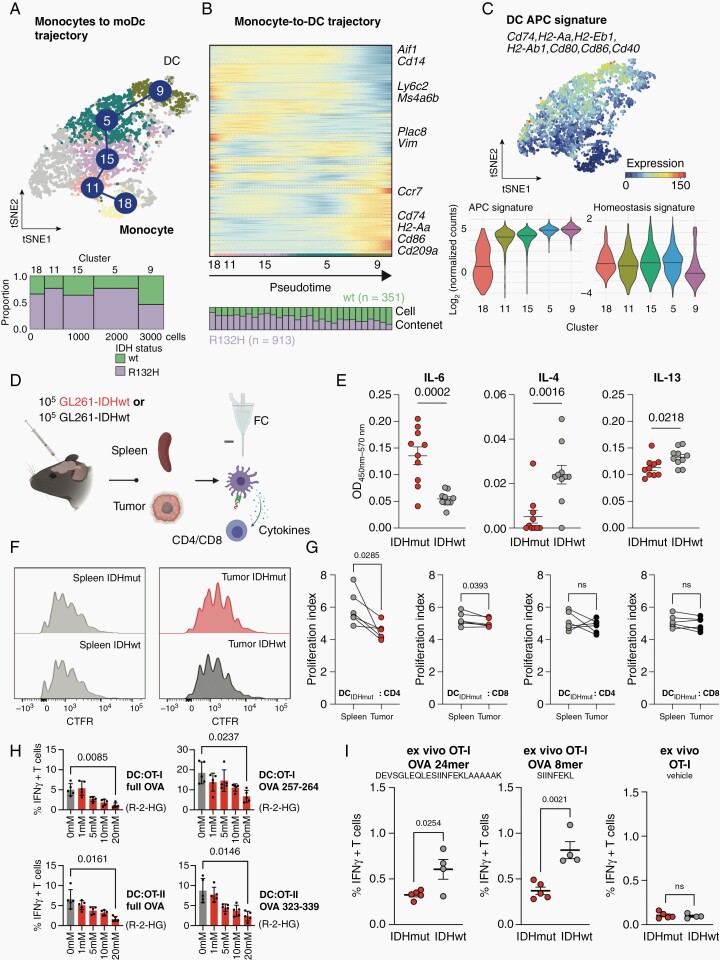
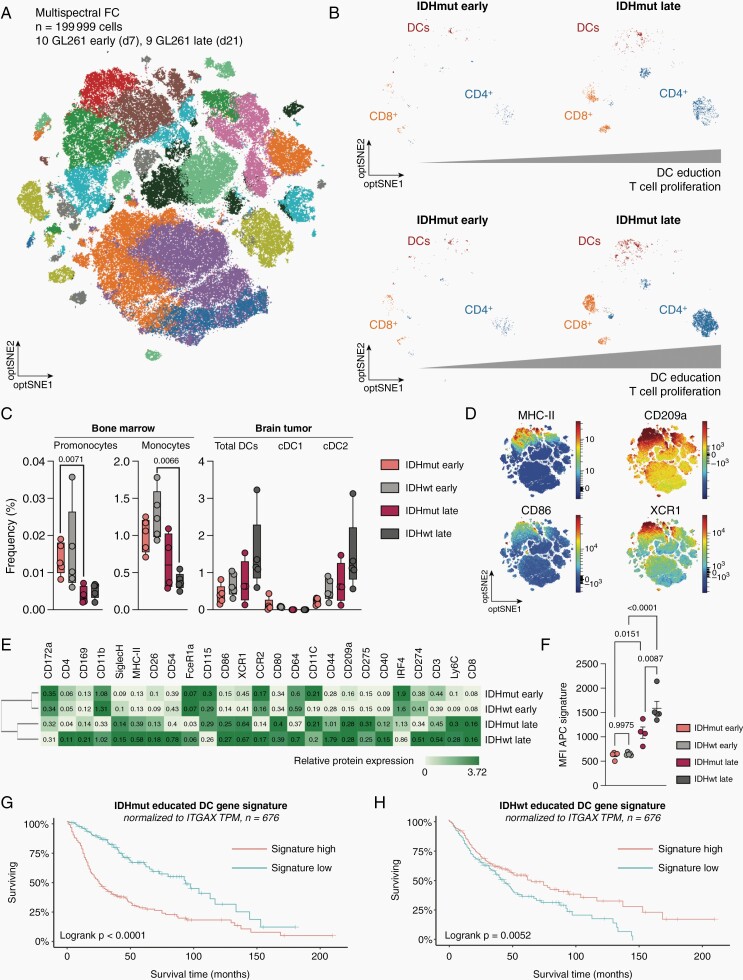
Results: DC are present in primary and recurrent high-grade gliomas and interact with other immune cell types within the TME. In murine glioblastomas, we find an IDH-status-associated major histocompatibility class I-restricted cross-presentation of tumor antigens by DC specifically in the tumor but not in meninges or secondary lymphoid organs of tumor-bearing animals. In single-cell sequencing-based pseudotime and longitudinal spectral flow cytometric analyses, we demonstrate an IDH-status-dependent differential, exclusively microenvironmental education of DC.

Conclusions: Glioma-associated DCs are relevantly abundant in human IDHwt and mutant tumors. Glioma IDH mutations result in specifically educated, dysfunctional DCs via paracrine reprogramming of infiltrating monocytes, providing the basis for combinatorial immunotherapy concepts against IDH mutant gliomas.

Keywords: IDH mutation; R-2-HG; cDC1; cDC2; dendritic cell; glioblastoma; glioma microenvironment.


Figures

Fig. 1
Fig. 1
Complexity and connectivity of the immune microenvironment in human GBM. (A) Uniform Manifold Approximation and Projection (UMAP) map of single immune cells in human high-grade gliomas at primary diagnosis (left) and recurrence (right). Cell subsets are indicated by color code and annotation. (B) Circos plots (top) and heatmaps (bottom) representing receptor-ligand interaction analyses by CellPhoneDB in newly diagnosed (n = 7 patients) and recurrent (n = 4 patients) GBM. Interaction z-score shown. Immune cell subsets defined as in Ref. . (C) Dot plot representation of top 40 receptor–ligand interactions based on molecule co-expression and reference-based cell subsets. Mean relative expression of both interaction partners (dot color) and interaction P-value (dot size) shown. P-values are derived from one-sided permutation tests and refer to the enrichment of the interacting ligand–receptor pair in each of the interacting pairs of cell types. GBM cohort from A to B. (D and E). CyTOF surface protein analysis on sorted glioma-infiltrating myeloid cells. n = 62 239 cells (n = 25 928 control brain tissue; n = 16 764 IDHmut HGG; n = 19 547 IDHwt HGG). (C) Dot plots representing individual patient specimens shown. One-way ANOVA + Fisher’s LSD test used for statistical testing. (E) Immune microenvironment composition based on reference-based prediction of immune cell subsets in IDHwt HGG (n = 9, left) and IDHmut HGG (n = 4, right) CyTOF cohort.
Fig. 2
Fig. 2
HGG-infiltrating dendritic cells exhibit limited antigen presentation via MHC class I. (A) Experimental overview. GL261-OVA or wildtype control cells were implanted in n = 12 C57BL6/J mice. 28 days post implantation, tumors and meninges were isolated and subjected to flow cytometry of SIINFEKL-reactive T cells and SIINFEKL-presenting DCs (CD11c+/MHC-II +). (B) Representative flow cytometry gating of H-2Kb-SIINFEKL-presenting DCs and SIINFEKL-dextramer-positive T cells isolated from syngeneic gliomas. Left column: GL261-Ova; Right column: GL261-WT. (C) left: Quantification of H-2Kb-SIINFEKL-presenting DCs and SIINFEKL-dextramer-positive T cells in meninges and glioma samples. n = 6 biological replicates per group. P-values are derived from paired student’s t-tests. right: inter-individual analysis of matched SIINFEKL-presenting DCs and SIINFEKL-dextramer-positive T cells from (left). Mouse IDs indicated. (D–F) Single-cell RNA-Seq of CD45+ cells from IDHmut and IDHwt GL261 mouse experimental gliomas. t-SNE maps are color-coded for (D) the genotype of the glioma and (E) the identified cell types based on marker gene expression. Median expression of cDC1 marker gene signature (Itgae, Xcr1, Sept3, Gcsam, Clec9a, Pianp, Ffar4, A503099J19Rik, Plpp1, Cxx1a, Ifi205, Cyp8b1, Tlr3, Snx2) and cDC2 signature (CD209a, Tnfsf9, Tnip3, Kcne3) shown in (D). Analysis was conducted on n = 7910 cells from IDH-mutated experimental glioma and n = 8835 cells from IDH-wildtype experimental glioma. (F) Heatmap representation of differentially regulated genes across all clusters. Clusters 5, 9, 11, 15, 18 represent cells on the monocyte-to-DC trajectory. Relative gene expression shown.
Fig. 3
Fig. 3
IDH status-dependent differential education of monocyte-derived dendritic cells. (A) Top: t-SNE representation of monocyte-derived macrophages and moDCs color-coded for RaceID cluster. Analysis was conducted on n = 913 cells from IDH-mutated (IDHmut) and n = 351 cells from IDH-wildtype (IDHwt) experimental HGG. Bottom: Marimekko plot of cluster-wise cellular abundance between IDHmut and IDHwt gliomas (B) Illustration of distinct trajectories from monocytes to monocyte-derived DCs. Heatmaps represent gene expression along the respective trajectory with the cell composition along each trajectory shown below (25 cells are binned for each stacked column). The StemID2 algorithm was utilized. (C) Top: Median expression of DC antigen presentation capacity (APC) signature. Marker genes of the signature indicated. Bottom: Violin plots showing cluster-wise cumulative gene expression of the APC and Homeostasis signature in cells extracted from HGG. Median and probability density smoothed by a kernel density estimator shown. (D–G) Functional ex vivo DC: T cell activation assay. (D) Experimental overview. DCs were isolated from intracranial experimental HGG and spleens by FACS and co-cultured with antigen-specific CD4 and CD8 T cells. (E) Cytokine ELISA of indicated cytokines measured in tumor interstitial fluid isolated from IDHmut and IDHwt experimental HGG at late stage (d21). OD450nm-570nm ± SEM shown for each cytokine. (F) Representative flow cytometry-based histograms of T cell proliferation via CellTrace Far Red (CFTR) staining of CD8+ T cells. (G) Quantification of differential T cell proliferation in ex vivo DC: T cell co-culture. Proliferation index calculated from CFTR-staining. P-values are derived from paired student’s t-tests. (H) Flow cytometry-based quantifications of intracellular Interferon-gamma (IFN-γ) of OT-I and OT-II T cells co-cultured with syngeneic DCs after exposure to varying concentrations of paracrine R-2-HG or vehicle. DCs were pulsed with full Ovalbumin (OVA) protein or indicated OVA peptides to elicit OT-I or OT-II restricted T cell responses. P-values are derived from paired student’s t-tests. (I) Flow cytometry-based quantifications of intracellular Interferon-gamma (IFN-γ) of OT-I T cells co-cultured with glioma-derived immune cells from IDHmut or IDHwt tumors. Co-culture was pulsed with indicated OVA 24mer or 8mer peptides to elicit OT-I T cell responses. P-values are derived from unpaired student’s t-tests.
Fig. 4
Fig. 4
Longitudinal characterization of hematogenic DC infiltration and education protein signature in experimental gliomas. (A) Multispectral flow cytometry of n = 19 C57BL6/J mice bearing experimental HGG at early (d7 postinjection) or late-stage (d21 postinjection). Optical SNE (optSNE) map shown. opt-SNE maps are color-coded by the identified cell types based on marker gene expression. (B) opt-SNE representation of DCs, CD4+ T cells and CD8+ T cells in GL261 IDHmut and IDHwt tumors over time. Bar represents increase in normalized T cell abundance over time. (C) Quantification of cell subtype abundance in bone marrow and brain tumor samples according to IDH mutation status. Individual values and boxplot with median and 5-95 percentile shown. P-values are derived from paired student’s t-tests. (D) optSNE density plot representations of indicated cell surface markers. Relative expression shown. (E) Heatmap representing median cell surface marker expression in indicated early-stage and late-stage conditions. Median relative expression indicated. (F) Mean fluorescence intensity of cumulative protein expression of the APC signature in DCs extracted from IDHwt and IDHmut gliomas. One-way ANOVA + Fisher’s LSD test used for statistical testing. (G–H). Kaplan-Meier survival estimates analysis of (B) averaged IDHmut glioma DC education signature and (G) averaged IDHwt glioma DC education signature. TCGA GBM cohort (n = 676 patients).

Comment in

Similar articles

Cited by

References

    1. Omuro A, DeAngelis LM. Glioblastoma and other malignant gliomas: a clinical review. J Am Med Assoc. 2013; 310(17):1842–1850. - PubMed
    1. Friebel E, Kapolou K, Unger S, et al. . Single-cell mapping of human brain cancer reveals tumor-specific instruction of tissue-invading leukocytes. Cell. 2020; 181(17):1626–1642.e20. - PubMed
    1. Locarno C V., Simonelli M, Carenza C, et al. . Role of myeloid cells in the immunosuppressive microenvironment in gliomas. Immunobiology. 2020; 225(1):151853. - PubMed
    1. Klemm F, Maas RR, Bowman RL, et al. . Interrogation of the microenvironmental landscape in brain tumors reveals disease-specific alterations of immune cells. Cell. 2020; 181(7): 1643–1660.e20. - PMC - PubMed
    1. Venteicher AS, Tirosh I, Hebert C, et al. . Decoupling genetics, lineages, and microenvironment in IDH-mutant gliomas by single-cell RNA-seq. Science (1979). 2017; 355(6332):eaai8478. - PMC - PubMed

Publication types

Substances