. 2022 May 24;13(1):2896.
doi: 10.1038/s41467-022-30512-3.

Predicting cancer prognosis and drug response from the tumor microbiome

Affiliations

Predicting cancer prognosis and drug response from the tumor microbiome

Leandro C Hermida et al. Nat Commun. .

Retraction in

Abstract

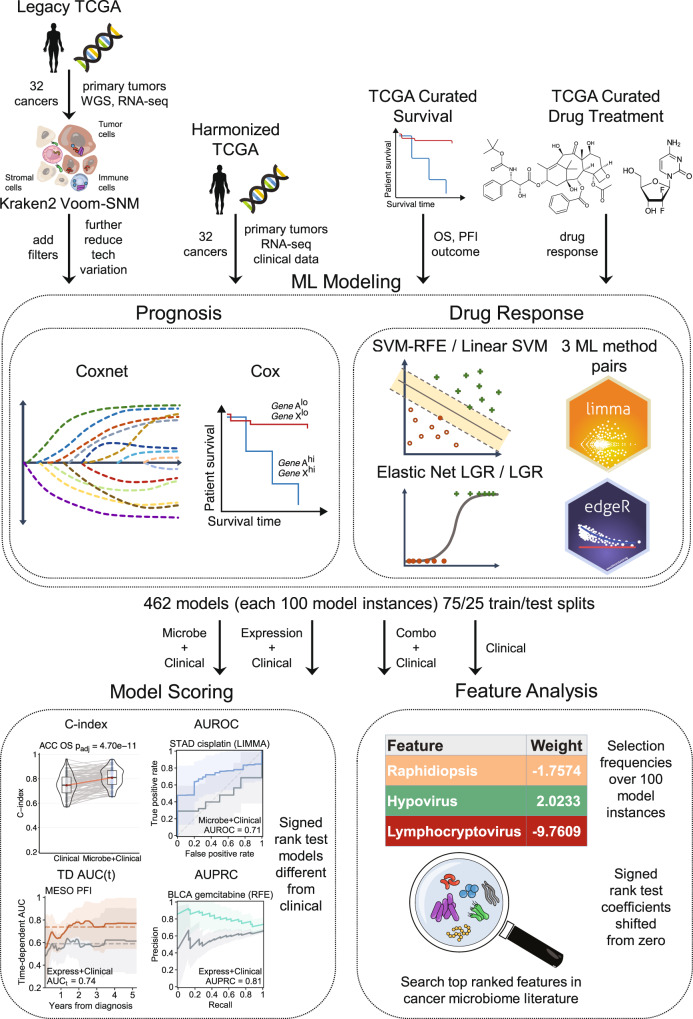
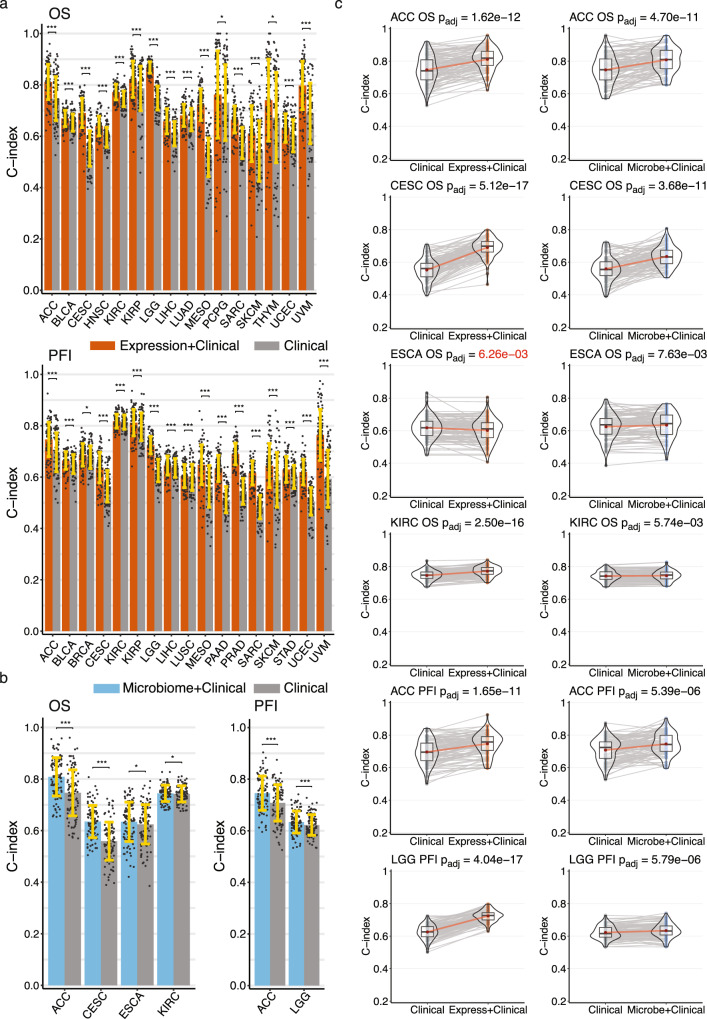
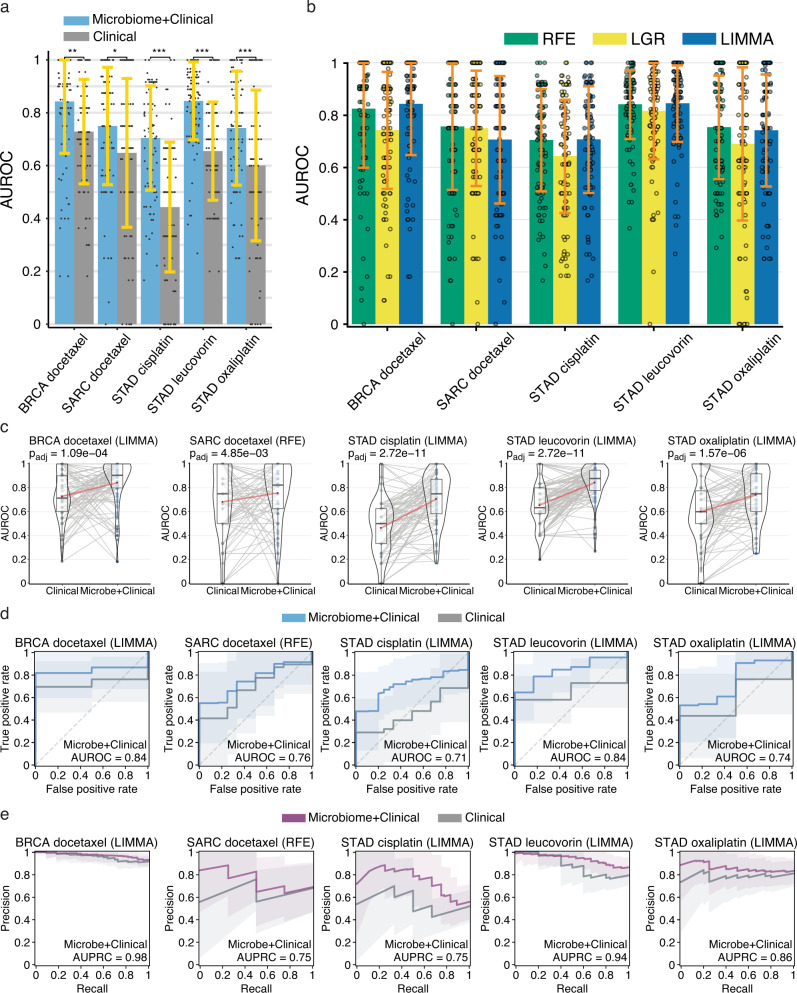
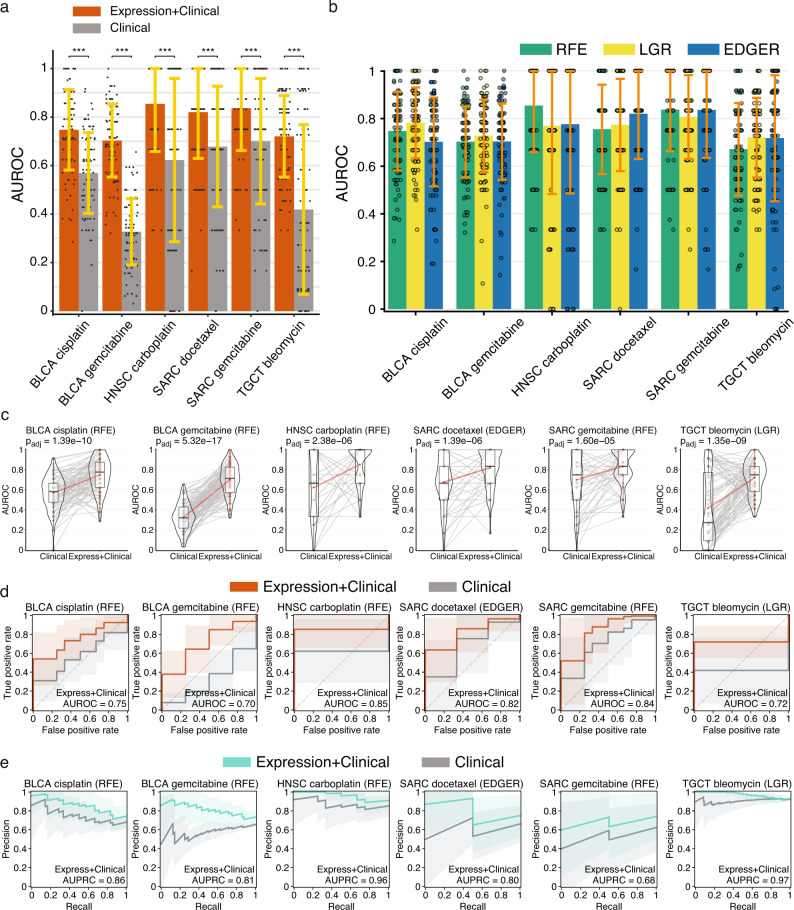
Tumor gene expression is predictive of patient prognosis in some cancers. However, RNA-seq and whole genome sequencing data contain not only reads from host tumor and normal tissue, but also reads from the tumor microbiome, which can be used to infer the microbial abundances in each tumor. Here, we show that tumor microbial abundances, alone or in combination with tumor gene expression, can predict cancer prognosis and drug response to some extent-microbial abundances are significantly less predictive of prognosis than gene expression, although similarly as predictive of drug response, but in mostly different cancer-drug combinations. Thus, it appears possible to leverage existing sequencing technology, or develop new protocols, to obtain more non-redundant information about prognosis and drug response from RNA-seq and whole genome sequencing experiments than could be obtained from tumor gene expression or genomic data alone.


Conflict of interest statement

The authors declare no competing interests.

Figures

Fig. 1
Fig. 1. Analysis pipeline overview.
Download and data preprocessing (left) of Poore et al. TCGA primary tumor Kraken2 Voom-SNM microbial abundances with additional filters to reduce technical variation, NCI Genomic Data Commons (GDC) harmonized TCGA primary tumor RNA-seq counts and clinical data, TCGA curated overall survival (OS) and progression-free interval (PFI) outcome data, and TCGA curated drug response clinical data. Prognosis machine learning (ML) modeling (middle) of microbial abundance, gene expression, and combined data types with clinical covariates for each cancer using penalized Cox with elastic net penalties (Coxnet) against matched clinical covariate-only models using standard Cox regression. Drug response classification ML modeling of the same data types with clinical covariates for each cancer-drug combination using three ML approaches, (1) SVM-RFE, elastic net logistic regression (LGR), and limma-trend (microbial and combined data types) or edgeR (gene expression) differential analysis feature scoring and selection with L2 penalized LGR. Matched clinical covariate-only modeling performed with L2 penalized linear SVM or LGR. ML modeling generates 100 model instances for each model from 75/25 train/test randomly shuffled and stratified dataset splits. ML model instance scoring (right top) using concordance index (C-index) and time-dependent cumulative/dynamic AUC (C/D AUC(t)) for prognosis models and area under receiver-operating characteristic curve (AUROC) and area under the precision-recall curve (AUPRC) for drug response models. Significance of model performance improvement over matched clinical covariate-only model determined by signed rank test of C-index or AUROC scores between each matched model instance for prognosis and drug response models, respectively. Feature analysis (right bottom) performed using model instance coefficients and selection frequencies. Overall feature importance ranking and significance determined by signed rank test of model instance feature coefficients shifting from zero and filtering of top features for selection frequency ≥ 20%.
Fig. 2
Fig. 2. Performance of gene expression and microbial abundance prognosis prediction models where features add predictive power to clinical covariates (a) gene expression with clinical covariate models (orange) and (b) microbial abundance with clinical covariate models (blue) vs clinical covariate-only models (grey).
In both a and b data are presented as mean values +/− standard deviation of the mean (SDM) for n=100 random training/test splits as described in Methods. Significance was computed by a paired two-sided Wilcoxon signed rank test, FDR adjusted for multiple comparisons: * p0.01, ** p0.001, ***p0.001. (c) C-index score violin density plots for n=100 training/test splits for the six models where microbial abundance with clinical covariate features outperform clinical covariate-only models. Box plots within the violin plots show median as center, the lower and upper hinges that correspond to the 25th and the 75th percentile, and whiskers that extend to the smallest and largest value no more than 1.5 times the interquartile range from the median. Corresponding gene expression models shown for comparison. Lines connecting points (light grey) represent score pairs from same train-test split on the data. Mean C-index scores shown as red dots with red lines connecting the means. Significance for the prediction improvement over clinical covariate-only models was calculated using a two-sided Wilcoxon signed-rank test and adjusted for multiple testing using the Benjamini-Hochberg method with adjusted p-values shown at top. These are the same p-values indicated in panel a. Adjusted p-values colored in red signify difference where clinical covariate-only model is better. Source data and exact p values are provided as a Source Data file. The number of cases involved in each experiment are shown in Supplementary Table 1.
Fig. 3
Fig. 3. Performance of microbial abundance drug response prediction models in the five cancer-drug combinations where models performed better than clinical covariates alone.
a Mean AUROC scores for microbial abundance with clinical covariate models (blue) vs clinical covariate-only models (grey) Significance computed by a paired two-sided Wilcoxon signed-rank test, FDR adjusted for multiple comparisons: * p0.01, ** p0.001, ***p0.001. b mean AUROC scores for each ML method for pairs presented in a. In both a and b data are presented as mean values +/− SDM for n=100 random training/test splits as described in Methods. c Violin density plots of AUROC scores for microbial abundance with clinical covariate models vs clinical covariate-only models for n=100 training/test splits. Box plots within the violin plots show median as center, the lower and upper hinges that correspond to the 25th and the 75th percentile, and whiskers that extend to the smallest and largest value no more than 1.5 times the interquartile range from the median. Lines connecting points (light grey) represent score pairs from same train-test split on the data. Mean AUROC scores are shown as red dots connected by red lines. d Mean ROC (blue) and e precision-recall (PR) curves (purple) for microbial abundance with clinical covariate models vs clinical covariate-only models (grey). Mean AUROC and AUPRC scores shown in legends and shaded areas denote standard deviations. Significance for the prediction improvement over clinical covariate-only models was calculated using a paired two-sided Wilcoxon signed-rank test and adjusted for multiple testing using the Benjamini-Hochberg method with adjusted p-values shown at top of violin plots in c that are the same as the p-values indicated in panels a and b. In ce results for the modeling method that had the most significant Wilcoxon signed-rank test are shown. Source data are provided as a Source Data file. The number of cases involved in each experiment are shown in Supplementary Table 1.
Fig. 4
Fig. 4. Performance of gene expression drug response prediction models in the six cancer-drug combinations where models performed better than clinical covariates alone.
a Mean AUROC scores for gene expression with clinical covariate models (orange) vs clinical covariate-only models (grey) Significance was computed by a paired two-sided Wilcoxon signed-rank test, FDR adjusted for multiple comparisons: p 0.01, ** p 0.001, *** p 0.0001. b Mean AUROC scores for each ML method. In both a and b data are presented as mean values +/− SDM for n=100 random training/test splits as described in Methods. c Violin density plots of AUROC scores for gene expression with clinical covariate models vs clinical covariate-only models for n=100 training/test splits. Lines connecting points (light grey) represent score pairs from same train-test split on the data. Box plots within the violin plots show median as center, the lower and upper hinges that correspond to the 25th and the 75th percentile, and whiskers that extend to the smallest and largest value no more than 1.5 times the interquartile range from the median. Mean AUROC scores are shown as red dots connected by red lines. d Mean ROC (orange) and e precision-recall (PR) curves (green) for gene expression with clinical covariate models vs clinical covariate-only models (grey). Mean AUROC and AUPRC scores shown in legends and shaded areas denote standard deviations. Significance for the prediction improvement over clinical covariate-only models was calculated using a paired two-sided Wilcoxon signed-rank test and adjusted for multiple testing using the Benjamini-Hochberg method with adjusted p-values shown at top of violin plots in c that are the same as the p-values indicated in panel a. In ce results for the modeling method that had the most significant Wilcoxon signed-rank test are shown. Source data are provided as a Source Data file. The number of cases involved in each experiment are shown in Supplementary Table 1.
Fig. 5
Fig. 5. Comparison of drug response model top-ranked selected features by each ML method. For each drug response model, we selected the two best ML methods by significance for the prediction improvement over their respective clinical covariate-only model.
Venn diagrams for microbial abundance (a) or gene expression (c) models comparing the number of features individually selected by each ML method, and the intersection of the two ML methods. Spearman rank correlation plots for microbial abundance (b) or gene expression (d) models showing that the median rank of features (among the 100 model instances in which the feature was selected) often correlated between the two most significant ML methods; p-values are two-sided. The best method is shown on the x-axis, the second best on the y-axis. Source data are provided as a Source Data file. The number of cases involved in each experiment are shown in Supplementary Table 1.
Fig. 6
Fig. 6. Evaluation of drug response model robustness. Model significance and robustness was further evaluated using a class label permutation test and examination of the effect feature selection had on model performance. Results for the modeling method which had the most significant Wilcoxon signed-rank test are shown.
Permutation test result histograms and significance for microbial abundance (a) or gene expression (c) models showing the distribution of permutation mean AUROC scores. True mean AUROC score shown as dotted vertical grey line and kernel density estimate shown as a curve over the histogram. Curves showing the effect that model hyperparameters which control the number of selected features had on mean AUROC and average precision (AVPRE) scores during hyperparameter grid search across all 100 model instances for microbial abundance (b) or gene expression (d) models. Shaded areas denote standard deviations. Source data are provided as a Source Data file. The number of cases involved in each experiment are shown in Supplementary Table 1.

References

    1. Grossman, R. L. et al. Toward a shared vision for cancer genomic data. N. Engl. J. Med.375, 1109–1112 (2016). - PMC - PubMed
    1. Ahluwalia, P., Kolhe, R. & Gahlay, G. K. The clinical relevance of gene expression based prognostic signatures in colorectal cancer. Biochimica et. Biophysica Acta (BBA)Rev. Cancer1875, 188513 (2021). - PubMed
    1. Brodsky, A. S. et al. Expression profiling of primary and metastatic ovarian tumors reveals differences indicative of aggressive disease. PLoS One9, e94476 (2014). - PMC - PubMed
    1. Liu, Y. et al. Pan-cancer analysis of clinical significance and associated molecular features of glycolysis. Bioengineered12, 4233–4246 (2021). - PMC - PubMed
    1. Selfors, L. M., Stover, D. G., Harris, I. S., Brugge, J. S. & Coloff, J. L. Identification of cancer genes that are independent of dominant proliferation and lineage programs. Proc. Natl. Acad. Sci. USA114, E11276–E11284 (2017). - PMC - PubMed

Publication types