. 2022 May 24;13(1):2872.
doi: 10.1038/s41467-022-30455-9.

Auditory processing remains sensitive to environmental experience during adolescence in a rodent model

Affiliations

Auditory processing remains sensitive to environmental experience during adolescence in a rodent model

Kelsey L Anbuhl et al. Nat Commun. .

Abstract

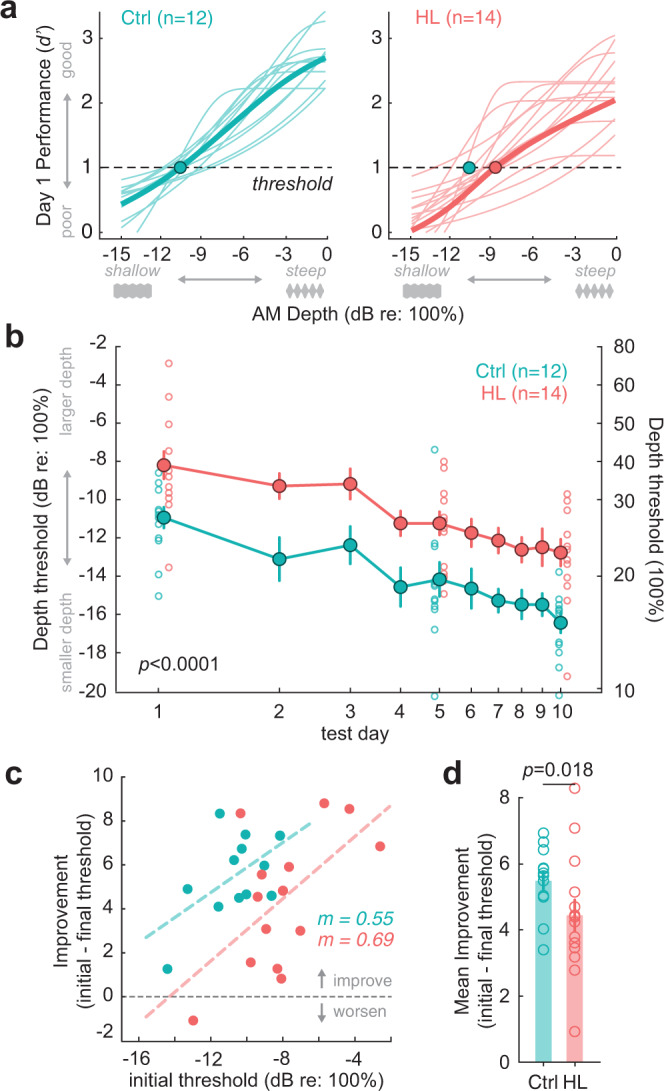
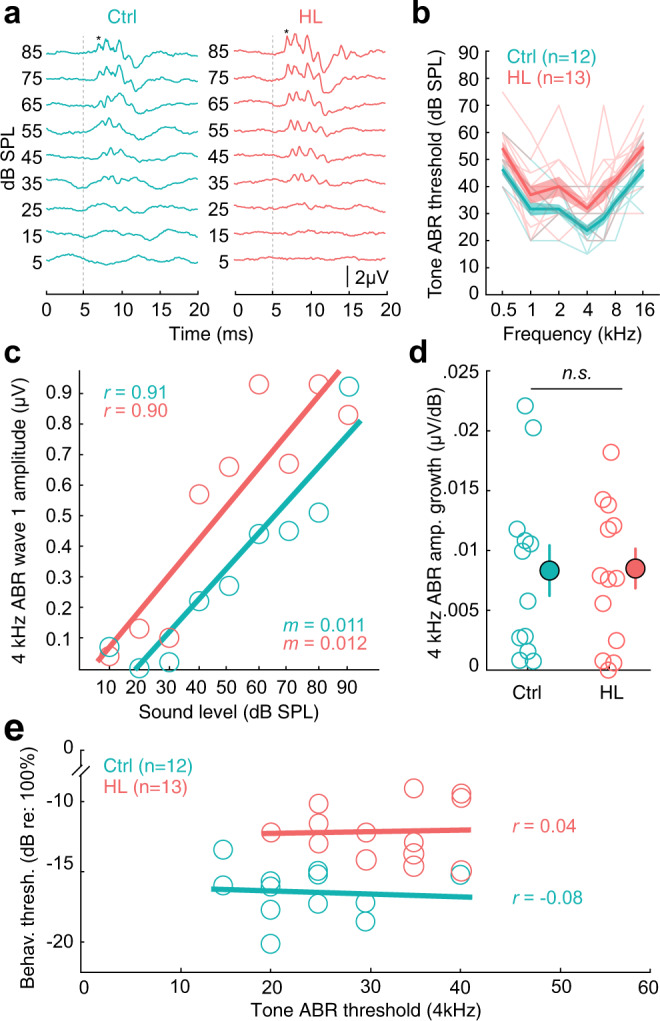
Elevated neural plasticity during development contributes to dramatic improvements in perceptual, motor, and cognitive skills. However, malleable neural circuits are vulnerable to environmental influences that may disrupt behavioral maturation. While these risks are well-established prior to sexual maturity (i.e., critical periods), the degree of neural vulnerability during adolescence remains uncertain. Here, we induce transient hearing loss (HL) spanning adolescence in gerbils, and ask whether behavioral and neural maturation are disrupted. We find that adolescent HL causes a significant perceptual deficit that can be attributed to degraded auditory cortex processing, as assessed with wireless single neuron recordings and within-session population-level analyses. Finally, auditory cortex brain slices from adolescent HL animals reveal synaptic deficits that are distinct from those typically observed after critical period deprivation. Taken together, these results show that diminished adolescent sensory experience can cause long-lasting behavioral deficits that originate, in part, from a dysfunctional cortical circuit.


Conflict of interest statement

The authors declare no competing interests.

Figures

Fig. 1
Fig. 1. Transient sensory deprivation during adolescence.
a Experimental timeline of manipulation and behavioral, physiological assessment. Gerbils either received transient hearing loss (HL; via bilateral earplugs) from postnatal (P) day 23, after the auditory cortex (AC) critical period ends, through P102, after sexual maturity (n = 14) or no earplugs (littermate controls, n = 12). Following earplug removal, animals recovered for 21 days prior to behavioral training and perceptual testing. Following behavioral assessment, auditory brainstem responses (ABRs) were collected in all animals. After ABR collection, animals were either chronically implanted in the AC and used for awake-behaving recordings (Ctrl: n = 7; HL: n = 9), or had brain slices collected for in vitro AC recordings (Ctrl: n = 5; HL: n = 5). b Serum testosterone levels (ng/mL) across developmental age for male (solid line) and female (dotted line) gerbils. For each animal, there were 3–5 hormone assessments at timepoints spanning P35-P102 (Control M: n = 6 subjects, 25 total samples; Control F: n = 6 subjects, 25 total samples; HL M: n = 6 subjects, 24 total samples; HL F: n = 8, 34 total samples). Circles and error bars indicate the mean ± SEM for each condition. The auditory deprivation-induced spanned P23-102, which encompasses the entire time course of sex hormone maturation in the gerbil.
Fig. 2
Fig. 2. Hearing loss (HL) during adolescence does not alter procedural training performance in adulthood.
a Schematic of the amplitude modulation (AM) detection task. Animals were trained to drink from a water spout in the presence of continuous broadband noise (Safe trials; classified as a “correct reject”) and to cease drinking when the noise transitioned to a modulated “Warn” signal (0 dB relative to 100% AM noise; 5 Hz rate; classified as a “Hit”). Failure to withdraw from the spout during Warn trials (classified as a”Miss”) resulted in a mild aversive shock. Withdrawing from the spout during Safe trials is classified as a “False Alarm”. Behavioral performance is quantified by utilizing the signal detection metric, d′. b Procedural training sessions (3-4 separate sessions) were combined to compute behavioral performance (d′) as a function of warn trial number using a 5-trial sliding window. Dotted line boxes correspond to data shown in c, d. Data are depicted as the mean ± SEM. Adolescent HL did not alter d′ as a function of warn trial number as compared to controls (p = 0.61, two-way mixed-model ANOVA). c The number of warn trials to reach performance criterion (d′ ≥ 1.5; see horizontal line in b) for control (Ctrl) and HL-reared animals are comparable (p = 0.59, one-way ANOVA). d Adolescent HL had no effect on the average d′ for the last 20 trials of procedural training (p = 0.82, one-way ANOVA).
Fig. 3
Fig. 3. Transient hearing loss during adolescence impairs amplitude modulation (AM) depth detection in adulthood.
a Psychometric functions on the first day of perceptual testing for control (Ctrl, n = 12) and hearing loss (HL, n = 14) animals. Threshold was defined as the depth at which d′ = 1 (dotted line). AM depths are presented on a dB scale (re: 100% depth), where 0 dB corresponds to 100% modulation, and decreasing values indicate smaller depths (e.g., see gray depth stimuli visualized below x-axes). Circle indicates the average group detection threshold. b HL animals display significantly poorer AM detection thresholds than controls on the first day of testing (Ctrl: −11 ± 0.5, HL: −8 ± 0.7 dB re: 100%; p = 0.007). The AM detection deficit for HL animals persisted across 10 consecutive testing days. An analysis of covariance (ANCOVA, two-way) revealed the effect of HL alone to be significant (p = 7.6 × 10−12). Filled circles and lines indicate the group mean ± SEM. Open circles indicate individual data points for the first, middle, and last psychometric testing session to highlight between-subject variability between control and adolescent HL animals. c Perceptual improvement (initial subtracted from final threshold) as a function of initial threshold. Values above the dotted line indicate an improvement in thresholds, whereas values below indicate a worsening of thresholds. Dotted lines indicate fitted linear regressions (R2 = 0.3–34). The slopes (m) of the regression fits were not significantly different from one another (p = 0.8, ANCOVA), whereas the y-axis intercepts were significantly different indicating the average amount of improvement was lower in adolescent-HL animals (p < 0.0001). d The mean improvement from the initial to the final session for each group. Bars and associated error indicate group mean ± SEM. Control animals (n = 12) improved significantly more than transient HL animals (n = 14; ANCOVA, two-way; p = 0.018).
Fig. 4
Fig. 4. Adult-onset hearing loss (>P102) of the same duration (80 days) does not impair procedural training or amplitude modulation (AM) depth detection following earplug removal and recovery.
a Procedural training sessions (3–4 separate sessions) were combined and behavioral performance (d′) was computed as a function of warn trial number using a 5-trial sliding window. Data for Adult controls (blue; n = 8) and Adult-onset HL (red; n = 8) are depicted as the mean ± SEM. b Number of warn trials to reach performance criterion (d′ ≥ 1.5). c Average d′ for the last 20 trials of procedural training prior to psychometric testing. d Psychometric functions were collected for 10 consecutive testing days for Adult controls and Adult-onset HL animals. Detection thresholds, defined as the depth at which d′ = 1, were computed for each testing session. AM depths are presented on a dB scale (re: 100% depth), where 0 dB corresponds to 100% modulation, and decreasing values indicate smaller depths. Circles indicate the average group detection threshold (±SEM) and lines show individual animal performance. Both groups exhibit comparable thresholds on the first day of testing (Adult Ctrl: −8.33 ± 1; Adult HL: −8.17 ± 0.7 dB re: 100%) and last day of testing (Adult control: −14.83 ± 0.8; Adult-onset HL: −14.9 ± 1.1 dB re: 100% AM). An analysis of covariance (ANCOVA, two-way) revealed a significant effect of testing day (p = 2.7 × 10−16), but no significant effect of Adult-onset HL alone (p = 0.87).
Fig. 5
Fig. 5. Single-unit analysis reveals poorer neural detection thresholds in the auditory cortex.
a Chronic 64 channel electrode arrays were implanted into the auditory cortex (AC) of a subset of control (n = 7) and HL (n = 9) animals, and wireless neural recordings were collected as they performed the AM depth detection task. b Representative Nissl-stained coronal section from one implanted animal. Inset shows electrode track through primary AC (see arrows). c Raster plots with poststimulus time histograms are shown for two example single units from a control (left panel; Subject ID F276484) and HL (right panel; Subject ID M277481) animal. Plots are arranged in order from larger AM depths (top) to smaller depths (towards bottom; see depth stimulus in gray for reference). d, e The firing rate of single units that met the criteria for AM sensitivity were transformed into d′ values (see Methods section). Neural d′ values were fit with a logistic function and plotted as a function of AM depth for a population of control (n = 77) and HL (n = 62) single units. Thin lines indicate individual fits, and the thick line indicates the population mean of the fits. Neural thresholds were defined as the AM depth at which the fit crossed d′ = 1. Circle indicates the mean neural depth threshold for each population. f Neural thresholds are plotted for control and HL animals. Individual thresholds are shown (circles), along with a half-violin plot indicating the probability density function. Horizontal lines indicate the mean ± SEM. Single units from HL animals exhibit poorer neural depth thresholds than control single units (p = 0.0007, one-way ANOVA).
Fig. 6
Fig. 6. AC population decoder analysis can explain hearing-loss-related behavioral deficits.
a Schematic of AC population AM depth encoding with a linear population readout procedure. Hypothetical population responses for individual trials of a Safe (gray; unmodulated) and Warn (black; modulated) stimulus. Spikes were counted across the entire stimulus duration (1 sec) such that spike firing responses from N neurons to T trials of S stimuli (“Warn” and “Safe”) formed a population “response vector”. A proportion of trials (“leave-one-out” procedure) from each neuron were randomly sampled (without replacement) and fitted to a linear hyperplane that was determined by a support vector machine (SVM) procedure (”train” set). Symbols represent “support vectors”, which are points used to create the linear boundary. Cross-validated classification performance was assessed on the remaining trials (“test” set). Performance metrics included the proportion of correctly classified Warn trials (“Hits”) and misclassified Safe trials (“False Alarms”). Similar to the psychometric and individual unit neurometric analyses, we converted population decoder performance metrics into d′ values. This procedure was conducted across 500 iterations with a new randomly drawn train and test set for each iteration. b Population decoder performance (d′) for two example individual recording sessions as a function of AM depth from Ctrl and HL neuron populations. Neural d′ values were fit with a logistic function (solid line), and threshold is defined as the AM depth where the fit crosses d′ = 1. Sample size indicates the number of single and/or multi-units included within that session. Shaded vertical bars indicate the behavioral threshold for that session. c Within-session correlations of behavioral threshold plotted as a function of multi-and single-unit population thresholds for that session. Dotted lines indicate the fitted linear regression for Ctrl and HL thresholds, and the solid line indicates the linear regression for both groups combined (gray). Pearson’s r (two-tailed) and statistical significance of each fit are noted in the bottom right corner of each plot. Behavioral sessions were included if they had at least 10 single and/or multi-units for the decoder analysis. d Average population decoder performance as a function of AM depth from Ctrl and HL single unit populations pooled across recording sessions (159 total sessions; 88 Ctrl sessions, 71 HL sessions). Sessions were included if there were ≥8 trials per depth.
Fig. 7
Fig. 7. Hearing loss spanning adolescence induces long-lasting changes to auditory cortical properties.
a Schematic of perihorizontal brain slices collected from control (n = 5) and HL-reared animals (n = 5; inset). Slices contain the auditory cortex (AC), where recordings from layer 2/3 pyramidal cells were made following electrical stimulation (Stim) of fast-spiking inhibitory interneurons to examine synaptic inhibition (IPSPs). Evoked IPSPs were collected in the presence of DNQX and AP-5 to isolate inhibitory potentials. b Example IPSP traces from control (Ctrl) and HL-reared (HL) cortical cells. Labels a, b indicate putative GABAA and GABAB components, respectively. ce Boxplots for GABAA receptor-mediated IPSP amplitudes, GABAB receptor-mediated IPSP amplitudes, and IPSP duration for control (Ctrl, n = 16 cells) and HL animals (HL, n = 16 cells). For all boxplots, the maxima and minima are maximum and minimum values, respectively. The center is the median and the box indicates the interquartile range (25th and 75th percentiles). Adolescent HL does not alter GABAA (p = 0.61, two-sample Wilcoxon signed rank test) or GABAB receptor-mediated IPSP amplitudes (p = 0.19, Wilcoxon signed rank test) or overall IPSP duration (p = 0.19, Wilcoxon signed rank test). f Recordings from layer 2/3 pyramidal cells were made following electrical stimulation of local L4 excitatory interneurons to examine synaptic excitation (EPSPs). g Example evoked potentials in response to increasing afferent stimulus levels (0.1–1 mA). EPSP traces are in bold and action potentials (APs) elicited are transparent. Stimulus artifact was removed for clarity. h Max amplitudes were determined from EPSP waveforms for each stimulation level plotted as input-output functions. Transparent lines indicate individual data (Ctrl, n = 16 cells; HL, n = 16 cells), and bold lines with circles indicate mean ± SEM if n cells ≥3. Adolescent HL has a significant effect on EPSP maximum amplitude (p = 0.02, two-way mixed-model ANOVA). i Proportion of cells that fire APs as a function of afferent stimulation level (mA) for each group. Adolescent HL led to a higher proportion of cells firing APs at lower afferent stimulation levels compared to control cells. j The firing rate of AC cells were collected via current injection into the cell. k Example traces of current-evoked responses to a depolarizing current injection (600pA). l Input-output function for maximum firing rate in response to current injection steps (100–600 pA) for Control (n = 32) and HL (n = 31) cells. Circles and associated error bars indicate mean ± SEM. Adolescent HL did not alter current-evoked maximum firing rate (p = 0.43, two-way mixed-model ANOVA). m First spike latency with increasing current injection (pA) for Control (n = 32) and HL (n = 31) cells. Circles and associated error bars indicate mean ± SEM. HL during adolescence did not alter first spike latency (p = 0.29, two-way mixed-model ANOVA).
Fig. 8
Fig. 8. Control experiment: HL-related AM detection deficits are not due to status of auditory periphery.
a Auditory brainstem response (ABR) waveforms in response to 4kHz tone pips for example control (Ctrl, Subject ID: M274129) and HL-reared animal (HL, Subject ID: M274131). Vertical dotted line indicates stimulus onset. Asterisk (*) indicates ABR wave 1. b Tone ABR Thresholds (mean ± SEM) as a function of frequency (kHz). c 4kHz ABR wave 1 amplitude (µV) as a function of sound level (dB SPL) for two example Ctrl and HL animals. Solid line indicates linear fit; m indicates the slope of the fit. Pearson’s r value for each regression are noted on the top left corner. d There are no significant differences in the 4kHz ABR wave 1 amplitude growth (µV/dB) between Ctrl and HL-reared animals (p = 0.87, one-way ANOVA). Amplitude growth values are calculated from the slope of the linear regression to wave 1 amplitude with sound level (i.e., in c). Open circles indicate individual values from Control (n = 12) and HL (n = 13) animals, and closed circles with associated error bars indicate group mean ± SEM. e Individual behavioral threshold as a function of ABR threshold at 4 kHz. Behavioral thresholds were from the final day of psychometric testing, closest to when the ABR was collected. Solid line indicates fitted linear regression. Horizontal linear fits indicate no correlation (Pearson’s r ≤ 0.04 for both groups) between tone ABR thresholds and behavioral thresholds.
Fig. 9
Fig. 9. Control experiment: AM depth detection thresholds remain stable across relevant sound levels.
a Adult animals (n = 4) were trained on the AM depth detection task at 45 dB SPL. b Depth detection thresholds across 10 psychometric testing days. Thin lines indicate individual data, and circles with associated error bars indicate mean ± SEM. Once detection thresholds stabilize (i.e., consistent for three consecutive sessions: dotted rectangle), then the sound level was varied from 10-60 dB SPL (c). d Behavioral AM depth detection thresholds across sound level (dB SPL). Open circles indicate individual performance (3 sessions per animal, 4 animals total) and solid circles indicate the group mean (±SEM). A 3-parameter exponential was fit to the data (dotted line). Thresholds asymptote at −15.8 dB (re: 100% AM), which corresponds to 27 dB SPL. Therefore, depth detection thresholds remain consistent for sound levels greater than 27 dB SPL.

References

    1. Giedd JN, et al. Brain development during childhood and adolescence: a longitudinal MRI study. Nat. Neurosci. 1999;2:861–863. doi: 10.1038/13158. - DOI - PubMed
    1. Lebel C, Beaulieu C. Longitudinal development of human brain wiring continues from childhood into adulthood. J. Neurosci. 2011;31:10937–10947. doi: 10.1523/JNEUROSCI.5302-10.2011. - DOI - PMC - PubMed
    1. Sharma A, Kraus N, J. McGee T, Nicol TG. Developmental changes in P1 and N1 central auditory responses elicited by consonant-vowel syllables. Electroencephalogr. Clin. Neurophysiol. 1997;104:540–545. doi: 10.1016/S0168-5597(97)00050-6. - DOI - PubMed
    1. Moore JK, Guan YL. Cytoarchitectural and axonal maturation in human auditory cortex. J. Assoc. Res. Otolaryngol. 2001;2:297–311. doi: 10.1007/s101620010052. - DOI - PMC - PubMed
    1. Petanjek Z, et al. Extraordinary neoteny of synaptic spines in the human prefrontal cortex. Proc. Natl Acad. Sci. USA. 2011;108:13281–1386. doi: 10.1073/pnas.1105108108. - DOI - PMC - PubMed

Publication types