. 2022 May 24;13(1):2899.
doi: 10.1038/s41467-022-30625-9.

Anoctamin 1 controls bone resorption by coupling Cl- channel activation with RANKL-RANK signaling transduction

Affiliations

Anoctamin 1 controls bone resorption by coupling Cl- channel activation with RANKL-RANK signaling transduction

Weijia Sun et al. Nat Commun. .

Abstract

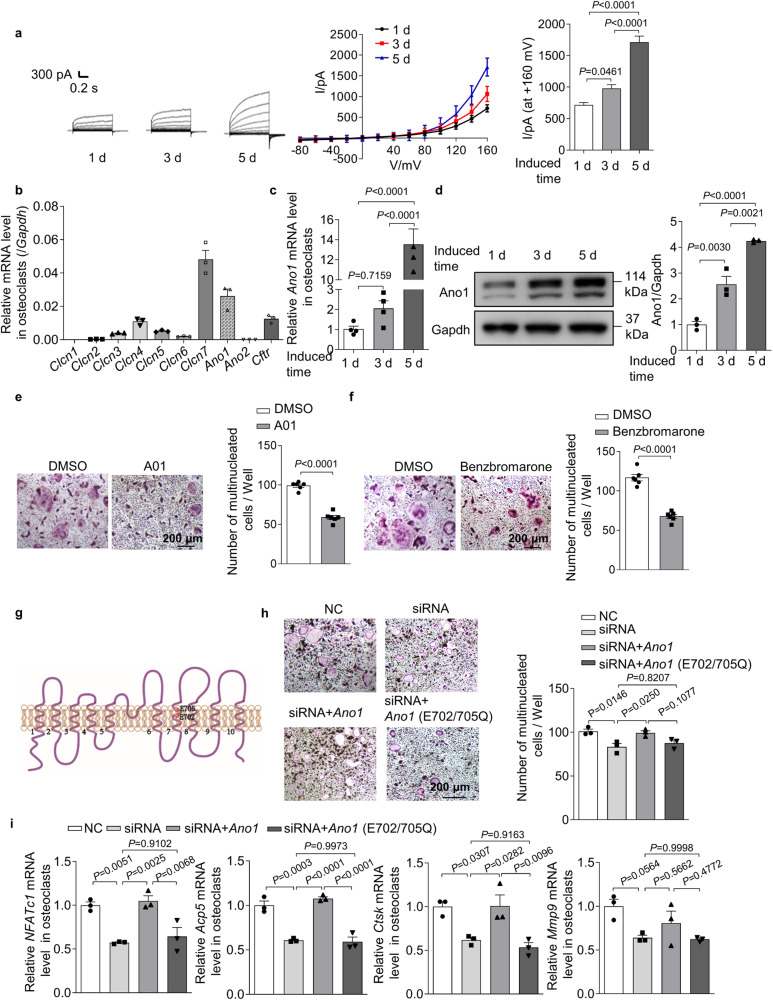
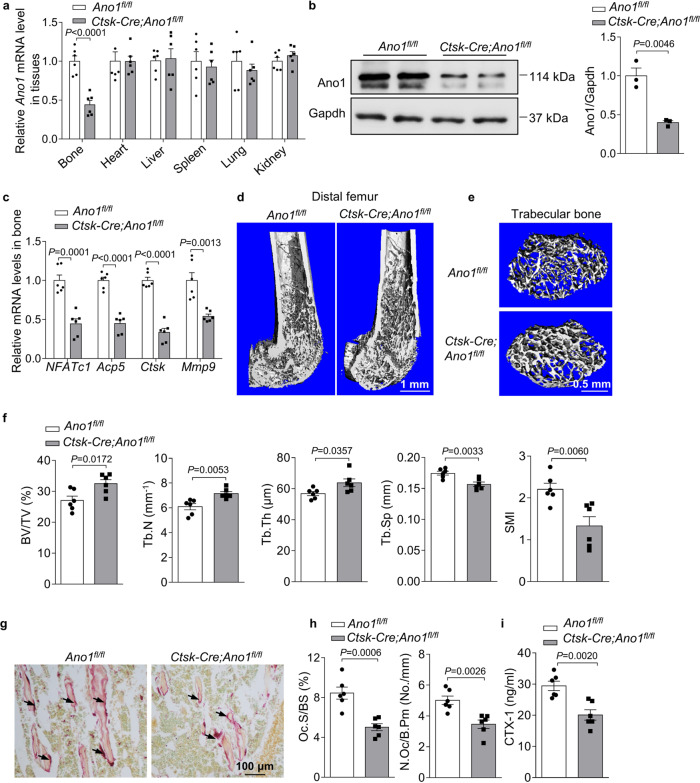
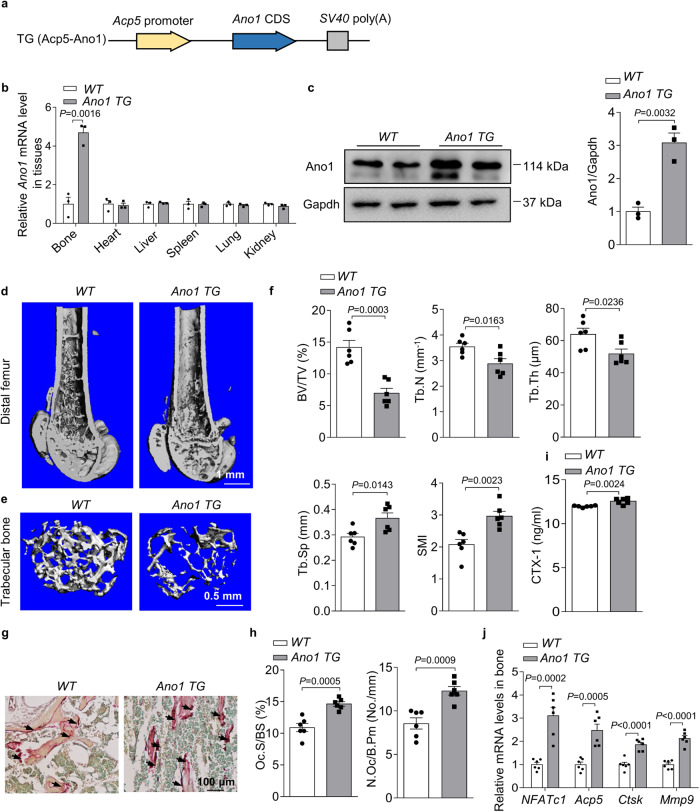
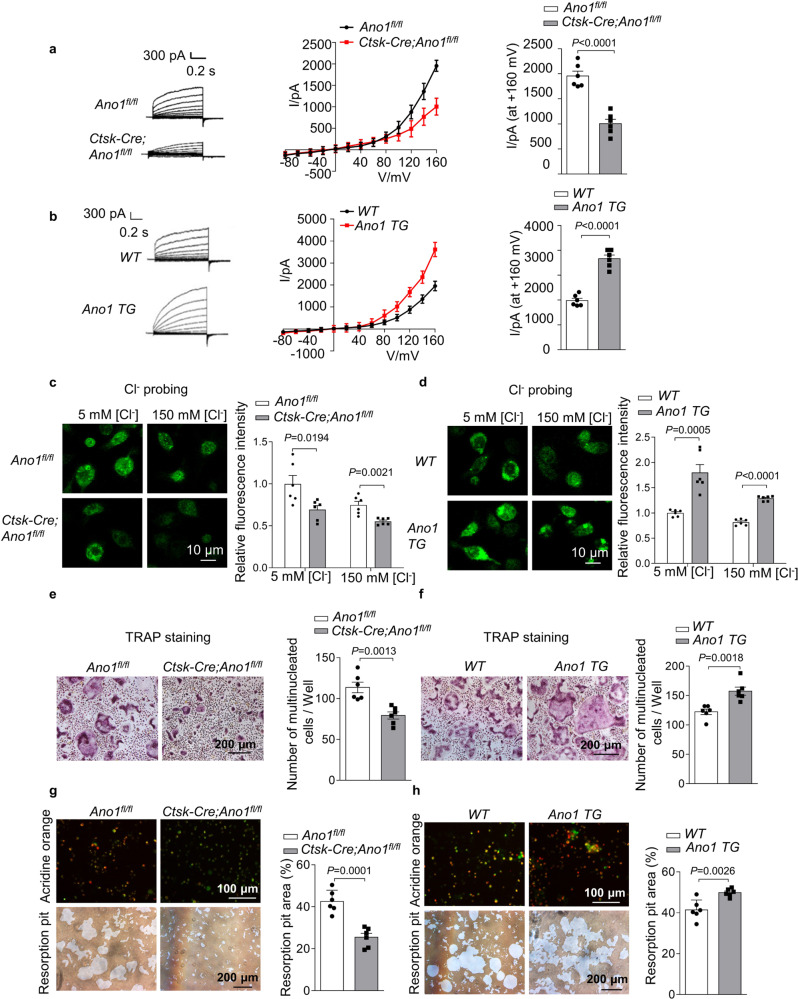
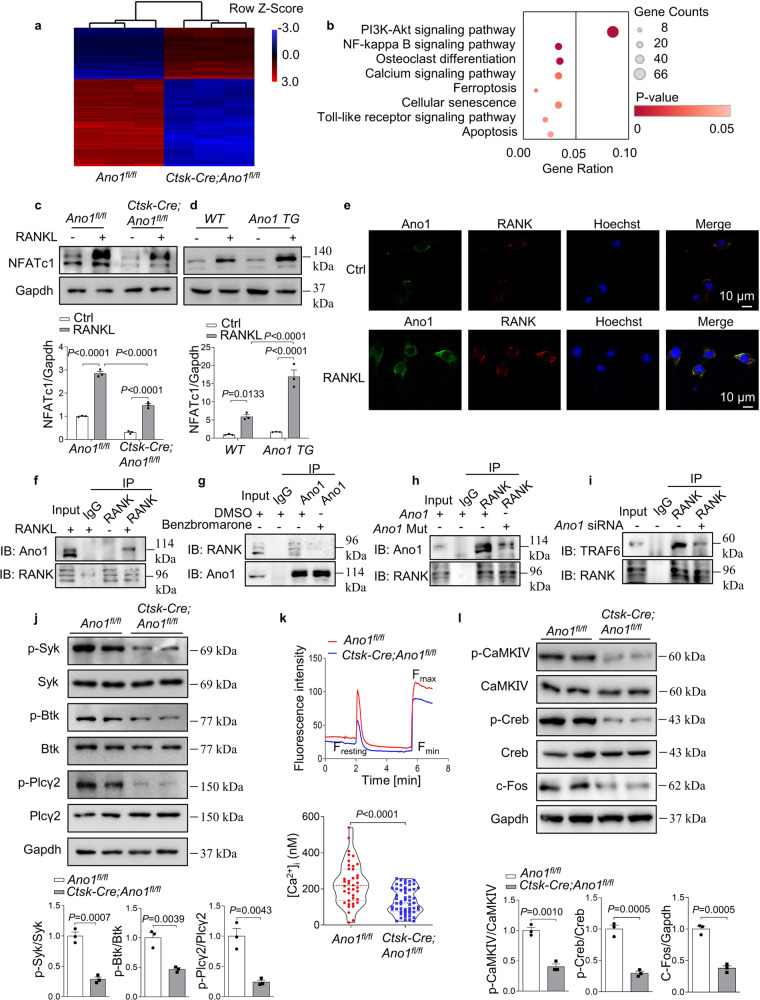
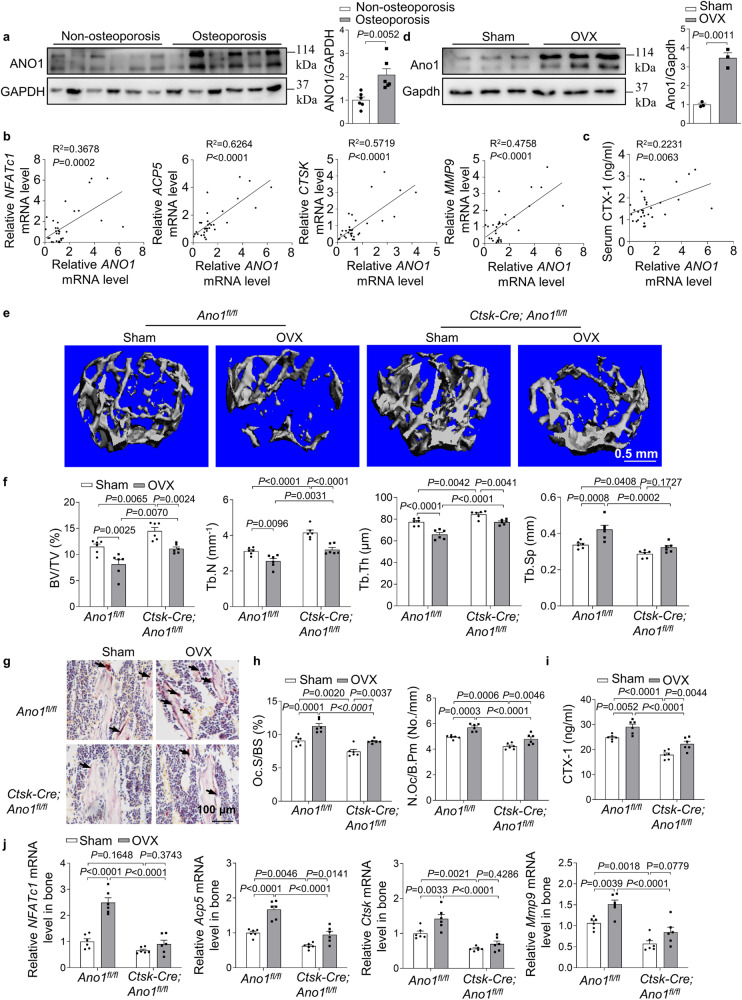
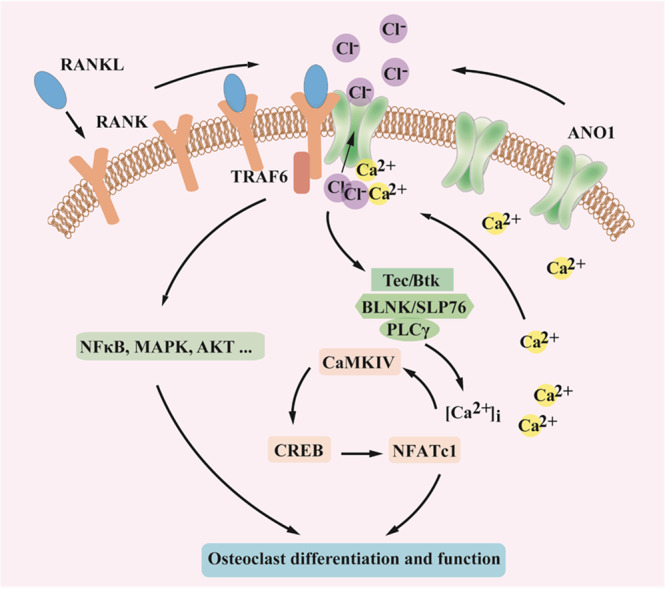
Osteoclast over-activation leads to bone loss and chloride homeostasis is fundamental importance for osteoclast function. The calcium-activated chloride channel Anoctamin 1 (also known as TMEM16A) is an important chloride channel involved in many physiological processes. However, its role in osteoclast remains unresolved. Here, we identified the existence of Anoctamin 1 in osteoclast and show that its expression positively correlates with osteoclast activity. Osteoclast-specific Anoctamin 1 knockout mice exhibit increased bone mass and decreased bone resorption. Mechanistically, Anoctamin 1 deletion increases intracellular Cl- concentration, decreases H+ secretion and reduces bone resorption. Notably, Anoctamin 1 physically interacts with RANK and this interaction is dependent upon Anoctamin 1 channel activity, jointly promoting RANKL-induced downstream signaling pathways. Anoctamin 1 protein levels are substantially increased in osteoporosis patients and this closely correlates with osteoclast activity. Finally, Anoctamin 1 deletion significantly alleviates ovariectomy induced osteoporosis. These results collectively establish Anoctamin 1 as an essential regulator in osteoclast function and suggest a potential therapeutic target for osteoporosis.


Conflict of interest statement

The authors declare no competing interests.

Figures

Fig. 1
Fig. 1. The expression and function of Ano1 in osteoclast.
a Representative chloride currents recorded from voltage ramps from −80 to +160 mV in whole-cell patch-clamp during osteoclast differentiation. b QRT-PCR analysis of Clcn1, Clcn2, Clcn3, Clcn4, Clcn5, Clcn6, Clcn7, Ano1, Ano2, and Cftr mRNA levels after bone marrow monocytes (BMMs) were induced by RANKL for 5 days. c, d QRT-PCR analysis of Ano1 mRNA level (c) and western blot analysis of Ano1 protein level (d) during osteoclast differentiation. e Representative images of TRAP staining in osteoclasts after treatment with 20 μM CaCCinh-A01 (A01) or its control (DMSO) for 5 days (left). Scale bar, 200 μm. Quantification of the number of multinucleated cells per well (right) (n = 6). f Representative images of TRAP staining in osteoclasts after treatment with 10 μM Benzbromarone or its control (DMSO) for 5 days (left). Scale bar, 200 μm. Quantification of the number of multinucleated cells per well (right) (n = 6). g Schematic representation of the topology of Ano1 mutant (E702/705Q). h Representative images of TRAP staining in osteoclasts knockdown with Ano1 siRNA, rescued with Ano1 or its mutant Ano1 (E702/705Q) (left). Scale bar, 200 μm. Quantification of the number of multinucleated cells per well (right). i QRT-PCR analysis of NFATc1, Acp5, Ctsk, and Mmp9 mRNA levels in osteoclasts knockdown with Ano1 siRNA, rescued with Ano1 or its mutant Ano1 (E702/705Q). All data are the mean ± s.e.m. from three independent experiments. Two-tailed unpaired Student’s t-test was used for statistical evaluations of two group comparisons. Statistical analysis with more than two groups was performed with one-way analysis of variance (ANOVA) with Tukey’s multiple comparisons test to determine group differences. Source data are provided as a Source Data file.
Fig. 2
Fig. 2. Osteoclast-specific Ano1 knockout increases bone mass.
a QRT-PCR analysis of Ano1 mRNA level in bone and other tissues from 2 month-old Ano1fl/fl and osteoclast-specific Ano1 knockout (Ctsk-Cre;Ano1fl/fl) mice (n = 6). Ano1 mRNA level in all tissues was normalized to Ano1fl/fl mice. b Western blot analysis of Ano1 protein level in bone tissues from Ano1fl/fl and Ctsk-Cre;Ano1fl/fl mice (left). The quantification of Ano1 protein level in bone from two groups (right) (n = 3). c QRT-PCR analysis of NFATc1, Acp5, Ctsk and Mmp9 mRNA levels in bone tissues from Ano1fl/fl and Ctsk-Cre;Ano1fl/fl mice (n = 6). d Representative images showing three-dimensional distal femurs trabecular architecture by micro-CT reconstruction from Ano1fl/fl and Ctsk-Cre;Ano1fl/fl mice at 8 weeks old (n = 6). Scale bar, 1 mm. e Representative images showing three-dimensional trabecular architecture by micro-CT reconstruction at the distal femurs from Ano1fl/fl and Ctsk-Cre;Ano1fl/fl male mice at 2 months old. Representative images of six independent tissue in each group. Scale bar, 0.5 mm. f Micro-CT measurements for BV/TV, Tb.N, Tb.Th, Tb.Sp, and SMI at the distal femurs of mice (n = 6). BV/TV, ratio of bone volume to tissue volume; Tb.N, trabecular number; Tb.Th, trabecular thickness; Tb.Sp, trabecular separation; SMI, structure model index. g Representative images of TRAP staining of the proximal tibia of mice (n = 6 tissues). Scale bar, 100 μm. h Histomorphometric analysis of the images for number of osteoclasts per bone perimeter (N.Oc/B.Pm) and osteoclast surface per bone surface (Oc.S/BS) (n = 6). i ELISA analysis of CTX-1 protein level in the serum from Ano1fl/fl and Ctsk-Cre;Ano1fl/fl mice (n = 6). All data are the mean ± s.e.m. Statistical analysis for comparison of two groups was performed using two-tailed unpaired Student’s t-test. Source data are provided as a Source Data file.
Fig. 3
Fig. 3. Ano1 overexpression decreases bone mass.
a Schematic representation of the transgenic construct used to generate Ano1 transgenic mouse lines. b QRT-PCR analysis of Ano1 mRNA level in bone and other tissues from 6-month-old WT and osteoclast-specific Ano1 over expression (Ano1 TG) mice (n = 3). Ano1 mRNA level in all tissues was normalized to WT mice. c Western blot analysis of Ano1 protein level in bone tissues from WT and Ano1 TG mice mice (left). The quantification of Ano1 protein level in bone from two groups (right) (n = 3). d Representative images showing three-dimensional distal femurs by micro-CT reconstruction from WT and Ano1 TG female mice at 6 months old. Scale bar, 1 mm. e Representative images showing three-dimensional trabecular architecture by micro-CT reconstruction at the distal femurs from WT and Ano1 TG mice at 6 months old. Representative images of six independent tissue in each group. Scale bar, 0.5 mm. f Micro-CT measurements for BV/TV, Tb.N, Tb.Th, Tb.Sp, and SMI at the distal femurs from WT and Ano1 TG mice (n = 6). g Representative images of TRAP staining of the proximal tibia from WT and Ano1 TG mice. Scale bar, 100 μm. h Histomorphometric analysis of the images for number of osteoclasts per bone perimeter (N.Oc/B.Pm) and osteoclast surface per bone surface (Oc.S/BS) (n = 6). i ELISA analysis of CTX-1 protein levels in the serum from WT and Ano1 TG mice (n = 6). j QRT-PCR analysis of NFATc1, Acp5, Ctsk, and Mmp9 mRNA levels in bone tissues from WT and Ano1 TG mice (n = 6). All data are the mean ± s.e.m. Statistical analysis for comparison of two groups was performed using two-tailed unpaired Student’s t-test. Source data are provided as a Source Data file.
Fig. 4
Fig. 4. Ano1 regulates osteoclast differentiation and function via modulating intracellular chloride concentration.
a Representative chloride currents recorded from voltage ramps from −80 to +160 mV in whole-cell patch-clamp of RANKL-induced osteoclasts from Ano1fl/fl and Ctsk-Cre;Ano1fl/fl mice for 5 days. b Representative chloride currents recorded from voltage ramps from −80 to +160 mV in whole-cell patch-clamp of RANKL-induced osteoclasts from WT and Ano1 TG mice for 5 days. c, d Measurement of intracellular chloride concentration in RANKL-inducted osteoclasts. c Representative fluorescent images of RANKL-induced osteoclasts from Ano1fl/fl and Ctsk-Cre;Ano1fl/fl mice for 5 days (left). The relative fluorescence intensity of RANKL-induced osteoclasts (right) (n = 6 well). All the cells were stained with 5 mM MQAE. Scale bar, 10 μm. d Representative fluorescent images of RANKL-induced osteoclasts from WT and Ano1 TG mice for 5 days (left). The relative fluorescence intensity of RANKL-induced BMMs cells (right) (n = 6 well). All the cells were stained with 5 mM MQAE. Scale bar, 10 μm. e Representative images of TRAP staining in RANKL-induced osteoclasts from Ano1fl/fl and Ctsk-Cre;Ano1fl/fl mice for 5 days (left). Quantification of the number of multinucleated cells per well (right). f Representative images of TRAP staining in RANKL-induced osteoclasts from WT and Ano1 TG mice for 5 days (left). Quantification of the number of multinucleated cells per well (right). g Representative images of acridine orange staining and resorption pits in RANKL-induced osteoclasts from Ano1fl/fl and Ctsk-Cre;Ano1fl/fl mice for 5 days (left). Quantification of the resorption pit area (right). h Representative images of acridine orange staining and resorption pits in RANKL-induced osteoclasts from WT and Ano1 TG mice for 5 days (left). Quantification of the resorption pit area (right). All data are the mean ± s.e.m. from three independent experiments. Two-tailed unpaired Student’s t-test was used for statistical evaluations of two group comparisons. Source data are provided as a Source Data file.
Fig. 5
Fig. 5. Calcium-activated chloride channel Ano1 promotes RANKL signaling via its activity-dependent interaction with RANK.
a Microarray assays were performed in osteoclasts originated from Ano1fl/fl (n = 3) and Ctsk-Cre;Ano1fl/fl (n = 3) mice. The relative mRNA expression is depicted according to the color, red indicates upregulation and blue indicates downregulation. Shown are the mRNAs that changed more than 2 folds. b Pathway enrichment analysis (Gene Analytics) for genes expressed differentially between Ano1fl/fl and Ctsk-Cre;Ano1fl/fl osteoclasts. c Western blot analysis of NFATc1 protein level in Ano1fl/fl and Ctsk-Cre;Ano1fl/fl osteoclasts after treatment with or without RANKL mice (top). The quantification of NFATc1 protein level in osteoclasts (below). d Western blot analysis of NFATc1 protein level in WT and Ano1 TG osteoclasts after treatment with or without RANKL (top). The quantification of NFATc1 protein level in osteoclasts (below). e Immunofluorescence of Ano1 (green) and RANK (red) in osteoclasts treated with or without RANKL by confocal microscopy. Representative images are shown. Scale bar, 10 μm. f Coimmunoprecipitation of Ano1 and RANK in osteoclasts after treatment with or without RANKL. g Coimmunoprecipitation of Ano1 and RANK in RANKL-induced osteoclasts after treatment with Ano1 inhibitor Benzbromarone (10 μM). h Coimmunoprecipitation of Ano1 and RANK in RANKL-induced osteoclasts after overexpression of Ano1 or Ano1 with E702Q and E705Q mutants. i Coimmunoprecipitation of RANK and TRAF6 in RANKL-induced osteoclasts transfected with Ano1 siRNA or its negative control. j Western blot analysis of the phosphorylation levels of Syk, Btk, and Plcγ2 in osteoclasts (top). The quantification of the phosphorylation level of Syk, Btk, and Plcγ2 in osteoclasts (below). k Resting [Ca2+]i in osteoclasts from Ano1fl/fl mice and Ctsk-Cre;Ano1fl/fl mice, n = 40 (Ano1fl/fl) and n = 55 (Ctsk-Cre;Ano1fl/fl) cells pooled from three independent experiments. l Western blot analysis of p-CaMKIV, p-Creb, and c-Fos protein levels in osteoclasts (top). The quantification of p-CaMKIV, p-Creb, and c-Fos protein levels in osteoclasts (below). All data are the mean ± s.e.m. from three independent experiments. Two-tailed unpaired Student’s t-test was used for statistical evaluations of two group comparisons. Statistical analysis with more than two groups was performed with two-way analysis of variance (ANOVA) with Šídák post-hoc test to determine group differences. Source data are provided as a Source Data file.
Fig. 6
Fig. 6. Ano1 knockout in osteoclast inhibits OVX-induced bone loss.
a Western blot analysis of ANO1 protein level in human bone specimens from two groups (left). The quantification of ANO1 protein level in human bone specimens from two groups (right). Non-osteoporosis group (T-score > −2.5), n = 6, and Osteoporosis group (T-score ≤ −2.5), n = 6. b Correlation analysis between ANO1 mRNA level and NFATc1, ACP5, CTSK and MMP9 mRNA levels in human bone specimens (n = 32). c Correlation analysis between ANO1 mRNA level in bone tissues and β-CTX level in human serum (n = 32). d Western blot analysis of Ano1 protein level in bone tissues with Sham or ovariectomized (OVX) treatment (left). The quantification of Ano1 protein level in bone tissues with Sham or OVX treatment (right) (n = 3). e Representative images showing three-dimensional trabecular architecture as determined by micro-CT reconstruction of the distal femurs from the groups of mice indicated. Representative images of six independent tissue in each group. Scale bar, 0.5 mm. f Micro-CT measurements for BV/TV, Tb.N, Tb.Th and Tb.Sp in the distal femurs. n = 6 for each group. g Representative images of TRAP staining of the proximal tibia. Scale bar, 100 μm. n = 6 for each group. h Histomorphometry analysis of the images for number of osteoclasts per bone perimeter (N.Oc/B.Pm) and osteoclast surface per bone surface (Oc.S/BS). n = 6 for each group. i ELISA analysis of CTX-1 protein level in serum. n = 6 for each group. j QRT-PCR analysis of NFATc1, Acp5, Ctsk, and Mmp9 mRNA levels in bone tissues. n = 6 for each group. All data are the mean ± s.e.m. Two-tailed unpaired Student’s t-test was used for statistical evaluations of two group comparisons. Statistical analysis with more than two groups was performed with two-way analysis of variance (ANOVA) with Šídák post-hoc test to determine group differences. Source data are provided as a Source Data file.
Fig. 7
Fig. 7. Schematic model depicting the role of ANO1-mediated osteoclast differentiation and function.
Under RANKL stimulation, the interaction between Ano1 and RANK was enhanced, and RANK downstream signaling pathways was activated, which promoted the Ano1 channel activity and enhanced its interaction with RANK.

References

    1. Feng X, McDonald JM. Disorders of bone remodeling. Annu. Rev. Pathol. 2011;6:121–145. doi: 10.1146/annurev-pathol-011110-130203. - DOI - PMC - PubMed
    1. Stauber T, Weinert S, Jentsch TJ. Cell biology and physiology of CLC chloride channels and transporters. Compr. Physiol. 2012;2:1701–1744. doi: 10.1002/cphy.c110038. - DOI - PubMed
    1. Caputo A, et al. TMEM16A, a membrane protein associated with calcium-dependent chloride channel activity. Science. 2008;322:590–594. doi: 10.1126/science.1163518. - DOI - PubMed
    1. Schroeder BC, Cheng T, Jan YN, Jan LY. Expression cloning of TMEM16A as a calcium-activated chloride channel subunit. Cell. 2008;134:1019–1029. doi: 10.1016/j.cell.2008.09.003. - DOI - PMC - PubMed
    1. Yang YD, et al. TMEM16A confers receptor-activated calcium-dependent chloride conductance. Nature. 2008;455:1210–1215. doi: 10.1038/nature07313. - DOI - PubMed

Publication types