

Learning models for forecasting hospital resource utilization for COVID-19 patients in Canada
- PMID: 35610273
- PMCID: PMC9128327
- DOI: 10.1038/s41598-022-12491-z
Learning models for forecasting hospital resource utilization for COVID-19 patients in Canada
Abstract
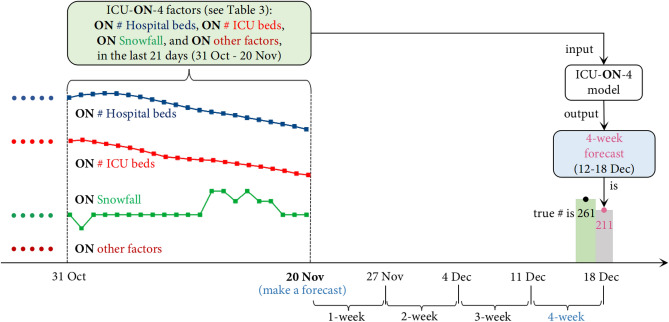
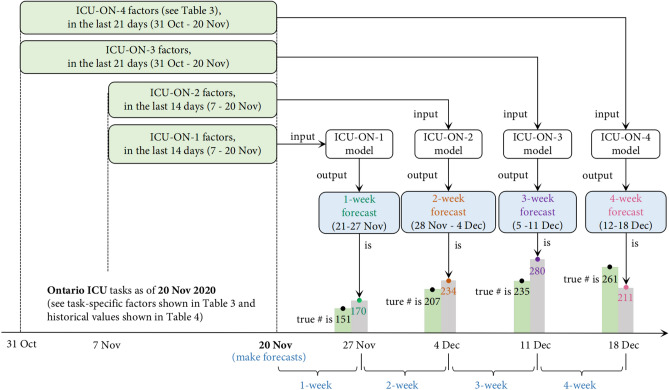
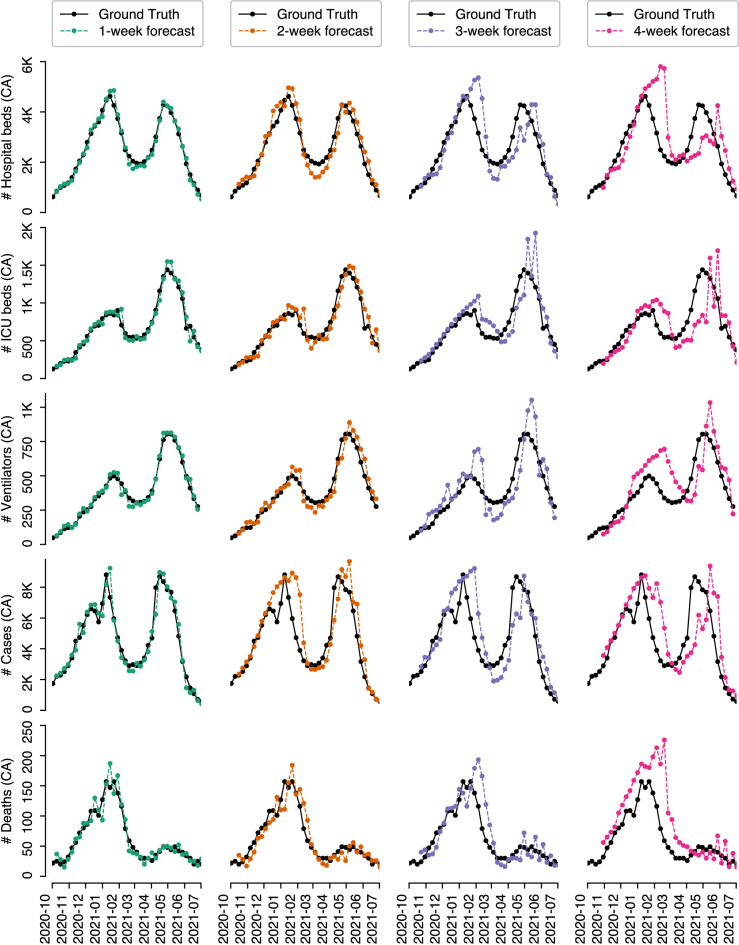
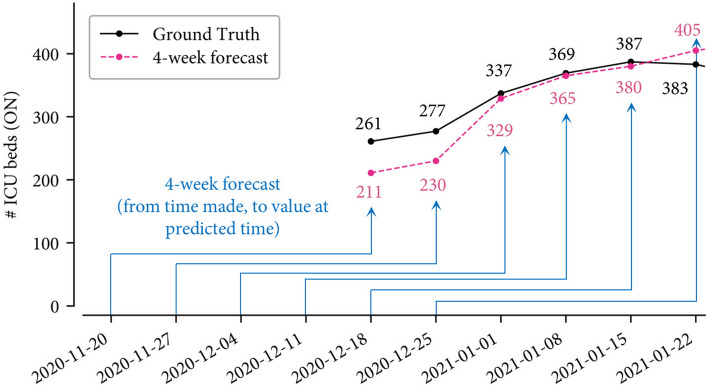
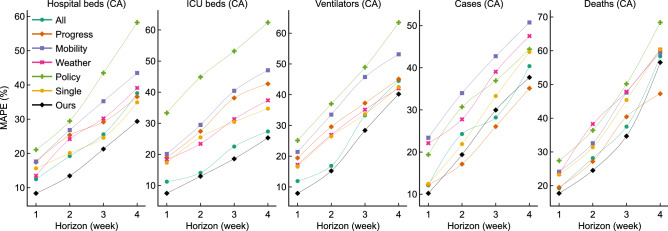
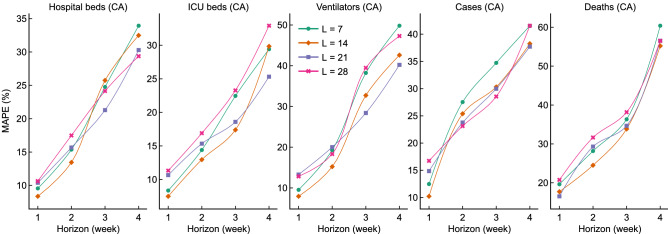
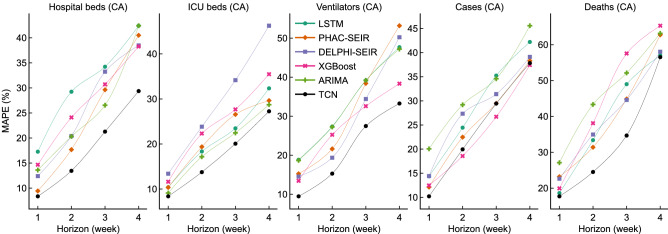
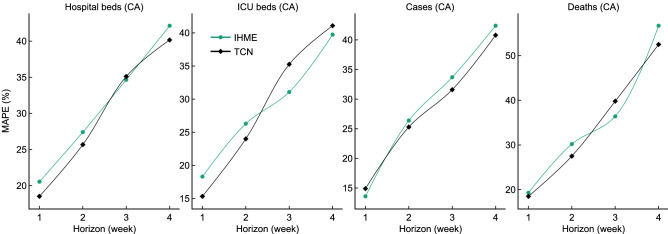
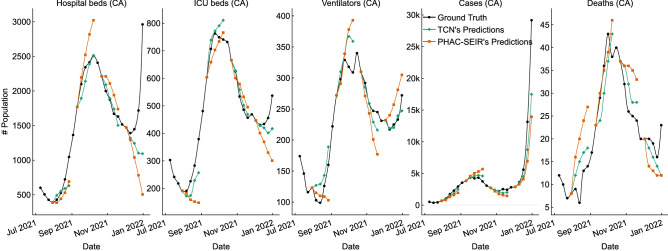
Hospitals in Canada are facing a crisis-level shortage of critical supplies and equipment during the COVID-19 pandemic. This motivates us to create predictive models that can use Canada COVID-19 data and pandemic-related factors to accurately forecast 5 quantities-three related to hospital resource utilization (i.e., the number of hospital beds, ICU beds, and ventilators that will be needed by COVID-19 patients) and two to the pandemic progress (i.e., the number of COVID-19 cases and COVID-19 deaths)-several weeks in advance. We developed a machine learning method that can use information (i.e., resource utilization, pandemic progress, population mobility, weather condition, and public policy) currently known about a region since March 2020, to learn multiple temporal convolutional network (TCN) models every week; each used for forecasting the weekly average of one of these 5 quantities in Canada (respectively, in six specific provinces) for each, in the next 1 (resp., 2,3,4) weeks. To validate the effectiveness of our method, we compared our method, versus other standard models, on the COVID-19 data and hospital resource data, on the tasks of predicting the 116 values (for Canada and its six most populated provinces), every week from Oct 2020 to July 2021, and the 20 values (only for Canada) for four specific times within 9 July to 31 Dec 2021. Experimental results show that our 4640 TCN models (each forecasting a regional target for a specific future time, on a specific date) can produce accurate 1,2,3,4-week forecasts of the utilization of every hospital resource and pandemic progress for each week from 2 Oct 2020 to 2 July 2021, as well as 80 TCN models for each of the four specified times within 9 July and 31 Dec 2021. Compared to other baseline and state-of-the-art predictive models, our TCN models yielded the best forecasts, with the lowest mean absolute percentage error (MAPE). Additional experiments, on the IHME COVID-19 data, demonstrate the effectiveness of our TCN models, in comparison with IHME forecasts. Each of our TCN models used a pre-defined set of features; we experimentally validate the effectiveness of these features by showing that these models perform better than other models that instead used other features. Overall, these experimental results demonstrate that our method can accurately forecast hospital resource utilization and pandemic progress for Canada and for each of the six provinces.
© 2022. The Author(s).
Conflict of interest statement
The authors declare no competing interests.
Figures
Similar articles
-
How New Mexico Leveraged a COVID-19 Case Forecasting Model to Preemptively Address the Health Care Needs of the State: Quantitative Analysis.JMIR Public Health Surveill. 2021 Jun 9;7(6):e27888. doi: 10.2196/27888. JMIR Public Health Surveill. 2021. PMID: 34003763 Free PMC article.
-
A COVID-19 Pandemic Artificial Intelligence-Based System With Deep Learning Forecasting and Automatic Statistical Data Acquisition: Development and Implementation Study.J Med Internet Res. 2021 May 20;23(5):e27806. doi: 10.2196/27806. J Med Internet Res. 2021. PMID: 33900932 Free PMC article.
-
Forecasting admissions in psychiatric hospitals before and during Covid-19: a retrospective study with routine data.Sci Rep. 2022 Sep 23;12(1):15912. doi: 10.1038/s41598-022-20190-y. Sci Rep. 2022. PMID: 36151267 Free PMC article.
-
Towards reliable forecasting of healthcare capacity needs: A scoping review and evidence mapping.Int J Med Inform. 2024 Sep;189:105527. doi: 10.1016/j.ijmedinf.2024.105527. Epub 2024 Jun 14. Int J Med Inform. 2024. PMID: 38901268
-
[Provisioning of personal protective equipment in hospitals in preparation for a pandemic].Anaesthesist. 2020 Dec;69(12):909-918. doi: 10.1007/s00101-020-00843-1. Anaesthesist. 2020. PMID: 32936348 Free PMC article. Review. German.
Cited by
-
A simulation model for predicting hospital occupancy for Covid-19 using archetype analysis.Healthc Anal (N Y). 2023 Nov;3:100197. doi: 10.1016/j.health.2023.100197. Epub 2023 May 26. Healthc Anal (N Y). 2023. PMID: 37275436 Free PMC article.
-
Improving environmental sustainability of intensive care units: A mini-review.World J Crit Care Med. 2023 Sep 9;12(4):217-225. doi: 10.5492/wjccm.v12.i4.217. eCollection 2023 Sep 9. World J Crit Care Med. 2023. PMID: 37745260 Free PMC article. Review.
-
A Bayesian model calibration framework for stochastic compartmental models with both time-varying and time-invariant parameters.Infect Dis Model. 2024 May 3;9(4):1224-1249. doi: 10.1016/j.idm.2024.04.002. eCollection 2024 Dec. Infect Dis Model. 2024. PMID: 39109181 Free PMC article.
References
-
- COVID-19 daily epidemiology update (2022). https://health-infobase.canada.ca/covid-19/epidemiological-summary-covid....
-
- Snider, B. et al. Artificial intelligence to predict the risk of mortality from COVID-19: Insights from a Canadian application. medRxiv (2020).
Publication types
MeSH terms
Grants and funding
LinkOut - more resources
Full Text Sources
Medical
Research Materials
