Observational Study
. 2022 Aug;65(8):1262-1277.
doi: 10.1007/s00125-022-05716-3. Epub 2022 May 25.

Age- and sex-specific effects of a long-term lifestyle intervention on body weight and cardiometabolic health markers in adults with prediabetes: results from the diabetes prevention study PREVIEW

Affiliations
Observational Study

Age- and sex-specific effects of a long-term lifestyle intervention on body weight and cardiometabolic health markers in adults with prediabetes: results from the diabetes prevention study PREVIEW

Ruixin Zhu et al. Diabetologia. 2022 Aug.

Abstract

Aims/hypothesis: Lifestyle interventions are the first-line treatment option for body weight and cardiometabolic health management. However, whether age groups or women and men respond differently to lifestyle interventions is under debate. We aimed to examine age- and sex-specific effects of a low-energy diet (LED) followed by a long-term lifestyle intervention on body weight, body composition and cardiometabolic health markers in adults with prediabetes (i.e. impaired fasting glucose and/or impaired glucose tolerance).

Methods: This observational study used longitudinal data from 2223 overweight participants with prediabetes in the multicentre diabetes prevention study PREVIEW. The participants underwent a LED-induced rapid weight loss (WL) period followed by a 3 year lifestyle-based weight maintenance (WM) intervention. Changes in outcomes of interest in prespecified age (younger: 25-45 years; middle-aged: 46-54 years; older: 55-70 years) or sex (women and men) groups were compared.

Results: In total, 783 younger, 319 middle-aged and 1121 older adults and 1503 women and 720 men were included in the analysis. In the available case and complete case analyses, multivariable-adjusted linear mixed models showed that younger and older adults had similar weight loss after the LED, whereas older adults had greater sustained weight loss after the WM intervention (adjusted difference for older vs younger adults -1.25% [95% CI -1.92, -0.58], p<0.001). After the WM intervention, older adults lost more fat-free mass and bone mass and had smaller improvements in 2 h plasma glucose (adjusted difference for older vs younger adults 0.65 mmol/l [95% CI 0.50, 0.80], p<0.001) and systolic blood pressure (adjusted difference for older vs younger adults 2.57 mmHg [95% CI 1.37, 3.77], p<0.001) than younger adults. Older adults had smaller decreases in fasting and 2 h glucose, HbA1c and systolic blood pressure after the WM intervention than middle-aged adults. In the complete case analysis, the above-mentioned differences between middle-aged and older adults disappeared, but the direction of the effect size did not change. After the WL period, compared with men, women had less weight loss (adjusted difference for women vs men 1.78% [95% CI 1.12, 2.43], p<0.001) with greater fat-free mass and bone mass loss and smaller improvements in HbA1c, LDL-cholesterol and diastolic blood pressure. After the WM intervention, women had greater fat-free mass and bone mass loss and smaller improvements in HbA1c and LDL-cholesterol, while they had greater improvements in fasting glucose, triacylglycerol (adjusted difference for women vs men -0.08 mmol/l [-0.11, -0.04], p<0.001) and HDL-cholesterol.

Conclusions/interpretation: Older adults benefited less from a lifestyle intervention in relation to body composition and cardiometabolic health markers than younger adults, despite greater sustained weight loss. Women benefited less from a LED followed by a lifestyle intervention in relation to body weight and body composition than men. Future interventions targeting older adults or women should take prevention of fat-free mass and bone mass loss into consideration.

Clinical trial registration number: ClinicalTrials.gov NCT01777893.

Keywords: Cardiovascular disease; Men; Middle-aged people; Obesity; Older people; Weight loss; Weight loss maintenance; Women; Young people.


Figures

Fig. 1
Fig. 1
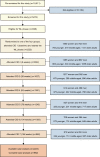
Study flow diagram. A total of 2224 participants started the weight loss phase, but one withdrew consent and requested data deletion. Younger adults: 25–45 years; middle-aged adults: 46–54 years; older adults: 55–70 years. To enable the data collection to be as complete as possible, we allowed the following visit windows for data collection: at 8 weeks: −3 to 5 days; at 26 weeks: ±1 week; at 52 weeks: ±2 weeks; remaining time points: ±4 weeks
Fig. 2
Fig. 2
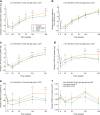
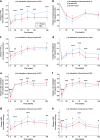
Changes in anthropometry and body composition from baseline by age group (n=2223). Values are estimated marginal mean (95% CI) changes from baseline in body weight (a), waist circumference (b), fat mass (c), FFM (d), BMC (e) and BMD (f). Younger adults: 25–45 years; middle-aged adults: 46–54 years; older adults: 55–70 years. Analyses were performed using a linear mixed model including sex, age, ethnicity, baseline BMI, baseline smoking status, baseline alcohol consumption, baseline values of the outcome being considered, baseline energy intake and PA, time-varying changes in energy intake and PA from baseline, intervention arm, time and interaction of time and age group or sex as fixed covariates and participant identifier and intervention centre as random effects. Post hoc multiple comparisons with Bonferroni adjustment were performed to compare age groups at each time point, where appropriate. Older vs younger adults *p<0.05, **p<0.01 and ***p<0.001; middle-aged vs younger adults p<0.05, ††p<0.01 and †††p<0.001; older vs middle-aged adults p<0.05 and ‡‡p<0.01. BMC data were based on 614 younger, 227 middle-aged and 639 older participants from Denmark, Spain, Bulgaria, Australia and New Zealand. BMD data were based on 419 younger, 221 middle-aged and 476 older participants from Denmark, Spain, Australia and New Zealand
Fig. 3
Fig. 3
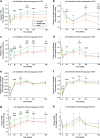
Weight loss-adjusted changes in cardiometabolic health markers from baseline by age group (n=2223). Values are estimated marginal mean (95% CI) changes from baseline in FPG (a), 2 h plasma glucose (b), HbA1c (c), triacylglycerol (d), HDL-cholesterol (e), LDL-cholesterol (f), SBP (g) and DBP (h). Younger adults: 25–45 years; middle-aged adults: 46–54 years; older adults: 55–70 years. Analyses were performed using a linear mixed model including sex, age, ethnicity, baseline BMI, baseline smoking status, baseline alcohol consumption, baseline values of the outcome being considered, time-varying percentage weight loss from baseline, baseline energy intake and PA, time-varying changes in energy intake and PA from baseline, intervention arm, time and interaction of time and age group as covariates and participant identifier and intervention centre as random effects. Post hoc multiple comparisons with Bonferroni adjustment were performed to compare age groups at each time point. Older vs younger adults *p<0.05, **p<0.01 and ***p<0.001; middle-aged vs younger adults p<0.05, ††p<0.01 and †††p<0.001; older vs middle-aged adults p<0.05, ‡‡p<0.01 and ‡‡‡p<0.001
Fig. 4
Fig. 4
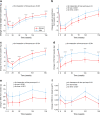
Changes in anthropometry and body composition from baseline in women and men (n=2223). Values are estimated marginal mean (95% CI) changes from baseline in body weight (a), waist circumference (b), fat mass (c), FFM (d), BMC (e) and BMD (f). Analyses were performed using a linear mixed model including sex, age, ethnicity, baseline BMI, baseline smoking status, baseline alcohol consumption, baseline values of the outcome being considered, baseline energy intake and PA, time-varying changes in energy intake and PA from baseline, intervention arm, time and interaction of time and age group or sex as fixed covariates and participant identifier and intervention centre as random effects. Post hoc pairwise comparisons (independent samples t tests) were performed to compare women and men at each time point, where appropriate. Women vs men **p<0.01 and ***p<0.001. BMC data were based on 1037 women and 443 men from Denmark, Spain, Bulgaria, Australia and New Zealand. BMD data were based on 759 women and 357 men from Denmark, Spain, Australia and New Zealand
Fig. 5
Fig. 5
Weight-adjusted changes in cardiometabolic health markers from baseline in women and men (n=2223). Values are estimated marginal mean (95% CI) changes from baseline in FPG (a), 2 h plasma glucose (b), HbA1c (c), triacylglycerol (d), HDL-cholesterol (e), LDL-cholesterol (f), SBP (g) and DBP (h). Analyses were performed using a linear mixed model including sex, age, ethnicity, baseline BMI, baseline smoking status, baseline alcohol consumption, baseline values of the outcome being considered, time-varying percentage weight loss from baseline, baseline energy intake and PA, time-varying changes in energy intake and PA from baseline, intervention arm, time and interaction of time and sex as fixed covariates and participant identifier and intervention centre as random effects. Post hoc pairwise comparisons (independent samples t tests) were performed to compare women and men at each time point, where appropriate. Women vs men *p<0.05, **p<0.01 and ***p<0.001
Fig. 6
Fig. 6
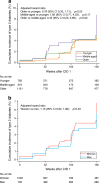
Cumulative incidence of type 2 diabetes by age and sex (n=2223). Values are cumulative incidence of diabetes by age (a) and sex (b) at each time point. Diabetes was diagnosed by an OGTT with 75 g glucose or by a medical doctor. Cumulative incidence was calculated using the Kaplan–Meier method, without adjustment. The incidence of diabetes was compared among age groups or between women and men using a time-dependent Cox hazards regression model adjusted for loge(time) × age or sex, ethnicity, baseline smoking status, baseline alcohol consumption, baseline BMI, baseline FPG, baseline 2 h plasma glucose, baseline PA and baseline energy intake, changes in PA and energy intake from baseline, intervention arm and intervention site as covariates

Similar articles

Cited by

References

    1. Global Burden of Disease Obesity Collaborators Health effects of overweight and obesity in 195 countries over 25 years. N Engl J Med. 2017;377(1):13–27. doi: 10.1056/NEJMoa1614362. - DOI - PMC - PubMed
    1. Heymsfield SB, Wadden TA. Mechanisms, pathophysiology, and Management of Obesity. N Engl J Med. 2017;376(15):1492. doi: 10.1056/NEJMc1701944. - DOI - PubMed
    1. Eckel RH, Jakicic JM, Ard JD, et al. 2013 AHA/ACC guideline on lifestyle management to reduce cardiovascular risk: a report of the American College of Cardiology/American Heart Association task force on practice guidelines. Circulation. 2014;129(25 Suppl 2):S76–S99. doi: 10.1161/01.cir.0000437740.48606.d1. - DOI - PubMed
    1. American College of Cardiology/American Heart Association Task Force on Practice Guidelines, Obesity Expert Panel, 2013 (2014) Executive summary: guidelines (2013) for the management of overweight and obesity in adults: a report of the American College of Cardiology/American Heart Association task force on practice guidelines and the obesity society published by the obesity society and American college of cardiology/American heart association task force on practice guidelines. Based on a systematic review from the the obesity expert panel, 2013. Obesity (Silver Spring) 22(Suppl 2):S5–S39. 10.1002/oby.20821 - PubMed
    1. Jensen MD, Ryan DH, Apovian CM, et al. 2013 AHA/ACC/TOS guideline for the management of overweight and obesity in adults: a report of the American College of Cardiology/American Heart Association task force on practice guidelines and the obesity society. J Am Coll Cardiol. 2014;63(25 Pt B):2985–3023. doi: 10.1016/j.jacc.2013.11.004. - DOI - PubMed

Publication types

Associated data