. 2022 May 25;23(1):398.
doi: 10.1186/s12864-022-08616-3.

Characterising genome architectures using genome decomposition analysis

Affiliations

Characterising genome architectures using genome decomposition analysis

Eerik Aunin et al. BMC Genomics. .

Abstract

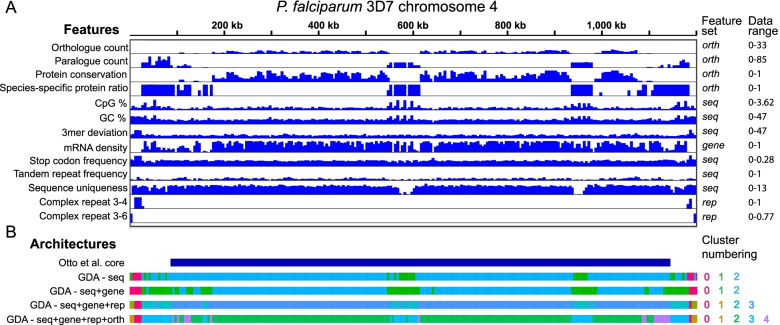
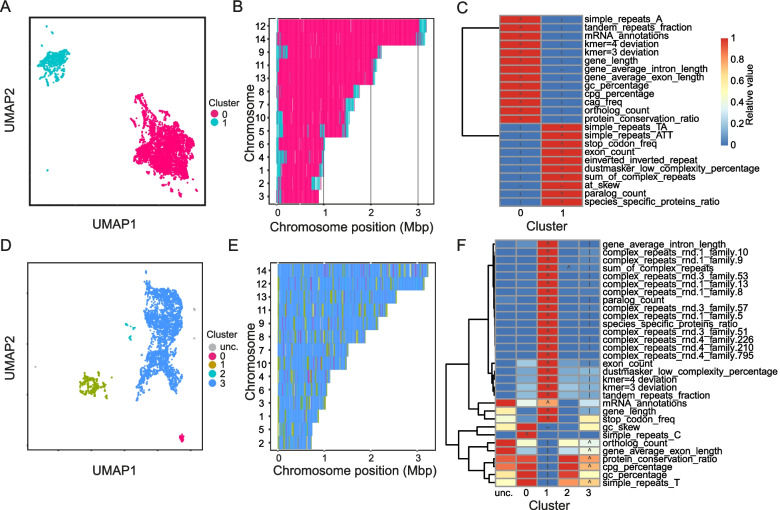
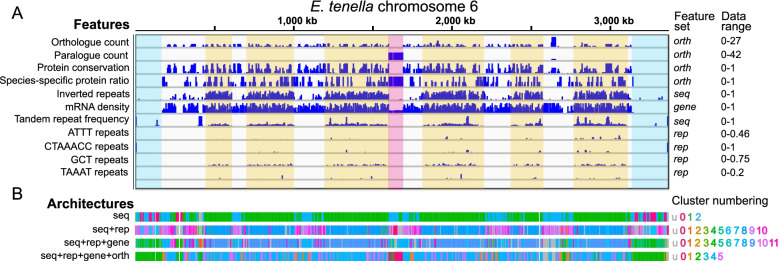
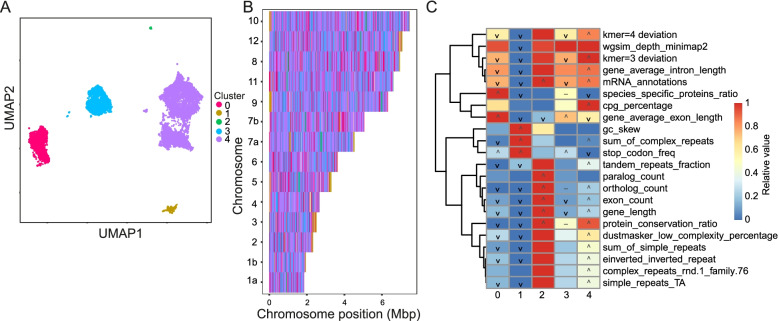
Genome architecture describes how genes and other features are arranged in genomes. These arrangements reflect the evolutionary pressures on genomes and underlie biological processes such as chromosomal segregation and the regulation of gene expression. We present a new tool called Genome Decomposition Analysis (GDA) that characterises genome architectures and acts as an accessible approach for discovering hidden features of a genome assembly. With the imminent deluge of high-quality genome assemblies from projects such as the Darwin Tree of Life and the Earth BioGenome Project, GDA has been designed to facilitate their exploration and the discovery of novel genome biology. We highlight the effectiveness of our approach in characterising the genome architectures of single-celled eukaryotic parasites from the phylum Apicomplexa and show that it scales well to large genomes.

Keywords: Apicomplexa; Chromosome structure; Genome architecture; Genome assembly; Parasites; Plasmodium.


Conflict of interest statement

The authors declare that they have no competing interests.

Figures

Fig. 1
Fig. 1
Overview of the GDA pipeline. A Feature sets are derived from the genome reference sequence (seq), repeat finding (rep), gene annotations (gene) and evolutionary relationships between genes (orth). The genome is divided into user-defined, non-overlapping windows (e.g. 5kbp in length) from which the value of each feature is determined. B The resulting matrix of feature values per window is embedded in two dimensions and clustered to identify groups of windows with similar properties. C The data can be explored in a number of ways using a web-browser based app. The clustering labels are mapped back to the chromosomes to highlight architectural features and a heatmap displays the features which define the clusters
Fig. 2
Fig. 2
GDA analysis of the Plasmodium falciparum genome. A UMAP embedding (n = 5) and HDBSCAN2 clustering (c = 50) of 5kbp windows using simple features derived from the genome sequence (seq feature set). B Projection of clusters onto the chromosomes highlights the localisation of cluster 0 windows at the very ends of chromosomes, with cluster 1 windows adjacent to these and within the cores of some chromosomes. C Heatmap showing features enriched in each cluster with seq feature set. Colours indicate the relative value of the feature in each cluster (red = highest, blue lowest), icons indicate significance (‘∧’ = KS test greater p-value <  = 1e-20, ‘∨’ = KS test lesser p-value <  = 1e-20, ‘-’ = great and lesser p-values <  = 1e-20) (D) UMAP embedding (n = 20) and HDBSCAN2 clustering (c = 50) of 5kbp windows with seq + gene + rep + orth feature set. E Projection of clusters onto chromosomes shows that the additional features break the subtelomeric regions into four distinct regions and that two types of islands (clusters 3 and 4) interrupt the core (cluster 2) on some chromosomes. F Heatmap showing features enriched in each cluster with all features
Fig. 3
Fig. 3
Detailed view of Plasmodium falciparum chromosome 4. A A selection of the features used as input to GDA displayed across the 1.2Mbp chromosome 4. These features were identified as significant in one or more clusters of one or more GDA runs. Data range indicates minimum and maximum values for the y axis of each feature. B Chromosome architectures generated using different feature sets with comparison to the definition of Otto et al. which captures only the core [21]. GDA was run with basic sequence features, with the addition of gene annotation, with gene annotations and complex repeat finding, with gene annotations, complex repeat finding and orthology analysis
Fig. 4
Fig. 4
GDA analysis of the Plasmodium vivax P01 and P. knowlesi H genomes. A The P. vivax genome neatly separates into two clusters with seq + rep + gene + orth feature sets. B These represent core (magenta) and subtelomeric (cyan) regions. C The clusters are typified, amongst other things, by having one-to-one orthologous genes versus highly paralogous species-specific genes, respectively. In the heatmap colours indicate the relative value of the feature in each cluster (red = highest, blue lowest), icons indicate significance (‘∧’ = KS test greater p-value <  = 1e-20, ‘∨’ = KS test lesser p-value <  = 1e-20, ‘-’ = great and lesser p-values <  = 1e-20). D P. knowlesi separated into four clusters. E None of the clusters were localised to the subtelomeres. F The cluster with large species-specific gene families equivalent to the subtelomeric cluster of P. vivax (cluster 1; green) is dispersed throughout each chromosome
Fig. 5
Fig. 5
Repeat-rich bands and gene-poor subtelomeres of Eimeria tenella are captured more or less well by different feature sets. A A number of features are shown in 5kbp windows across chromosome 6 of E. tenella. The repeat-rich bands, defined here by GCT (CAG) repeats are highlighted in yellow. The gene-poor subtelomeres are highlighted in blue and a sag multigene family array in pink. Data range indicates minimum and maximum values for the y axis of each feature. B Four different architectures, based on different feature sets are shown below. The seq, seq + rep and seq + rep + genes feature sets capture the repeat-rich regions very well, with the last of these also capturing the gene-poor subtelomeres. The seq + rep + gene + orth feature set does not capture the repeat-rich regions in a single cluster but instead focuses more on whether a window contains more well-conserved genes or not. It retains the cluster identifying the gene-poor subtelomeres and highlights arrays of sag genes
Fig. 6
Fig. 6
GDA analysis of Eimeria tenella with the seq + rep feature set. A Analysis of E. tenella with the seq + rep feature set identified 11 clusters. The majority of the genome was separated into three or four clusters found in bands across each chromosome (B). C These include the repeat rich region (cluster 8; dark blue), a cluster which is similar but lacks repeats (9; purple) and an intermediate cluster (10; magenta) which is enriched for sum of complex repeats and inverted repeats, but not the GCT/CAG and telomere-like (CTAAACC) repeats found in cluster 8. In the heatmap colours indicate the relative value of the feature in each cluster (red = highest, blue lowest), icons indicate significance (‘∧’ = KS test greater p-value <  = 1e-20, ‘∨’ = KS test lesser p-value <  = 1e-20, ‘-’ = great and lesser p-values <  = 1e-20)
Fig. 7
Fig. 7
GDA analysis of Toxoplasma gondii highlights gene-poor subtelomeres and gene family-rich islands. A Using the seq + rep + gene + orth feature set, the T. gondii genome separated into 5 distinct clusters. B Cluster 1 (gold) was often found at the ends of chromosomes and was typified by low numbers of mRNA annotations, high GC skew, complex repeats and stop codon frequency (C). This is similar to what we see in E. tenella subtelomeres. In the heatmap colours indicate the relative value of the feature in each cluster (red = highest, blue lowest), icons indicate significance (‘∧’ = KS test greater p-value <  = 1e-20, ‘∨’ = KS test lesser p-value <  = 1e-20, ‘-’ = great and lesser p-values <  = 1e-20)

References

    1. Koonin EV. Evolution of genome architecture. Int J Biochem Cell Biol. 2009;41:298–306. doi: 10.1016/j.biocel.2008.09.015. - DOI - PMC - PubMed
    1. Rowley MJ, Corces VG. Organizational principles of 3D genome architecture. Nat Rev Genet. 2018;19:789–800. doi: 10.1038/s41576-018-0060-8. - DOI - PMC - PubMed
    1. Lynch M, Conery JS. The origins of genome complexity. Science. 2003;302:1401–1404. doi: 10.1126/science.1089370. - DOI - PubMed
    1. Lynch M, Bobay L-M, Catania F, Gout J-F, Rho M. The repatterning of eukaryotic genomes by random genetic drift. Annu Rev Genomics Hum Genet. 2011;12:347–366. doi: 10.1146/annurev-genom-082410-101412. - DOI - PMC - PubMed
    1. Lopez-Rubio J-J, Mancio-Silva L, Scherf A. Genome-wide analysis of heterochromatin associates clonally variant gene regulation with perinuclear repressive centers in malaria parasites. Cell Host Microbe. 2009;5:179–190. doi: 10.1016/j.chom.2008.12.012. - DOI - PubMed

LinkOut - more resources