. 2022 May 24;22(1):577.
doi: 10.1186/s12885-022-09673-3.

Mast cell marker gene signature in head and neck squamous cell carcinoma

Affiliations

Mast cell marker gene signature in head and neck squamous cell carcinoma

Zhimou Cai et al. BMC Cancer. .

Abstract

Background: Mast cells can reshape the tumour immune microenvironment and greatly affect tumour occurrence and development. However, mast cell gene prognostic and predictive value in head and neck squamous cell carcinoma (HNSCC) remains unclear. This study was conducted to identify and establish a prognostic mast cell gene signature (MCS) for assessing the prognosis and immunotherapy response of patients with HNSCC.

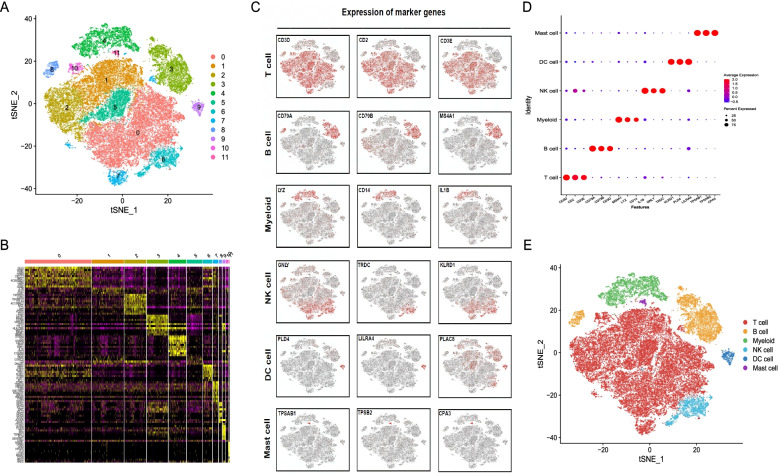
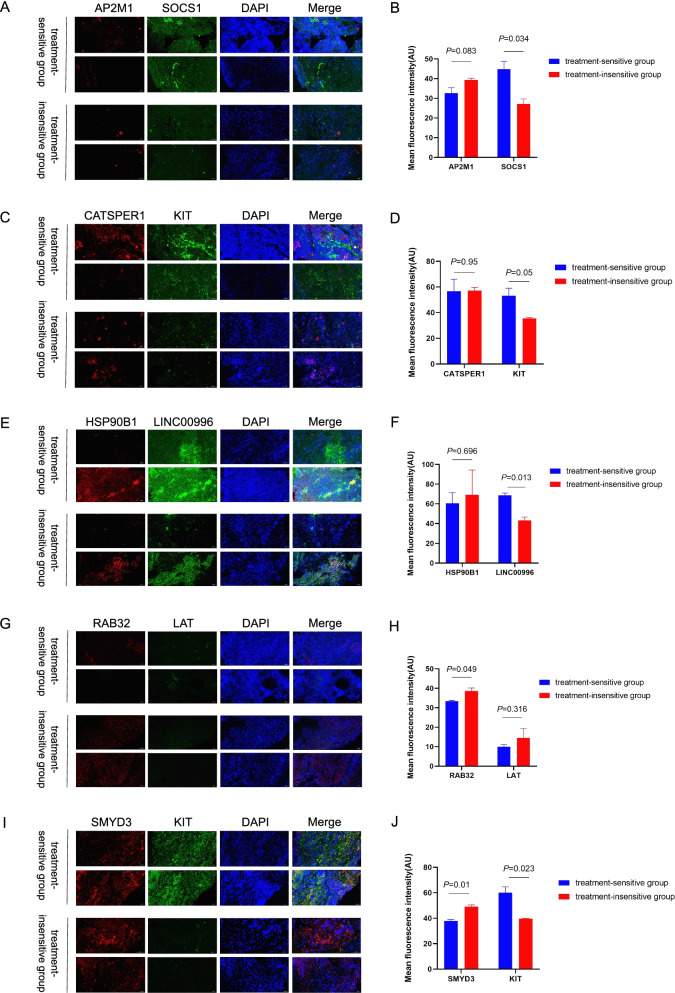
Methods: Mast cell marker genes in HNSCC were identified using single-cell RNA sequencing analysis. A dataset from The Cancer Genome Atlas was divided into a training cohort to construct the MCS model and a testing cohort to validate the model. Fluorescence in-situ hybridisation was used to evaluate the MCS model gene expression in tissue sections from patients with HNSCC who had been treated with programmed cell death-1 inhibitors and further validate the MCS.

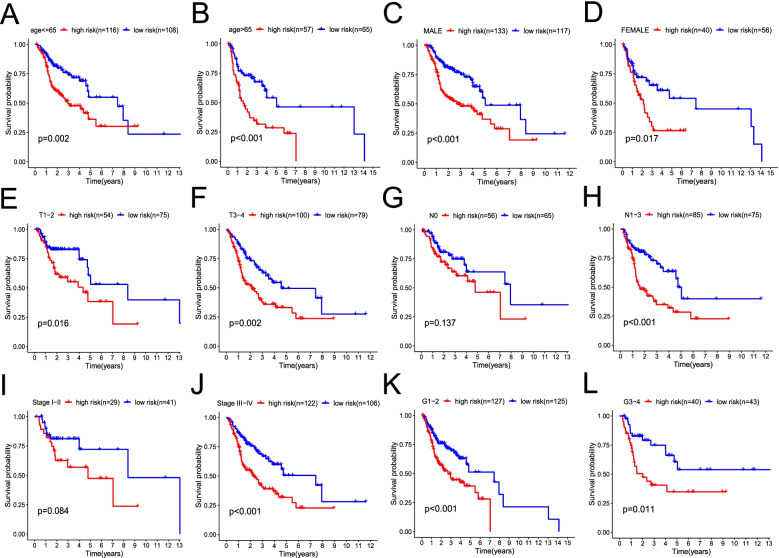
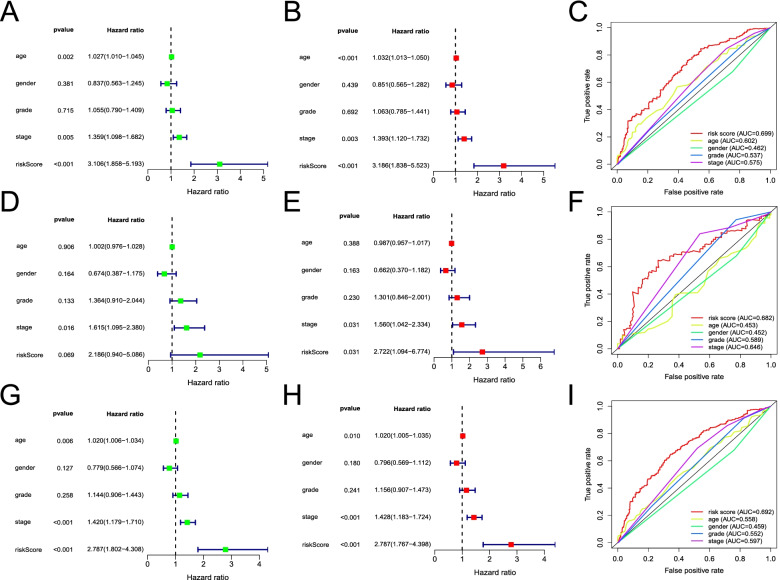
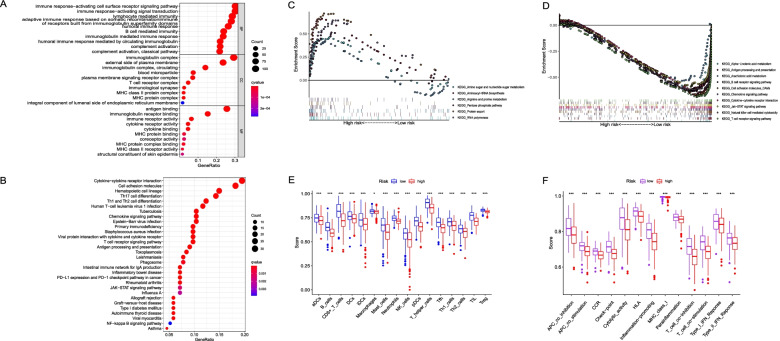
Results: A prognostic MCS comprising nine genes (KIT, RAB32, CATSPER1, SMYD3, LINC00996, SOCS1, AP2M1, LAT, and HSP90B1) was generated by comprehensively analysing clinical features and 47 mast cell-related genes. The MCS effectively distinguished survival outcomes across the training, testing, and entire cohorts as an independent prognostic factor. Furthermore, we identified patients with favourable immune cell infiltration status and immunotherapy responses. Fluorescence in-situ hybridisation supported the MCS immunotherapy response of patients with HNSCC prediction, showing increased high-risk gene expression and reduced low-risk gene expression in immunotherapy-insensitive patients.

Conclusions: Our MCS provides insight into the roles of mast cells in HNSCC prognosis and may have applications as an immunotherapy response predictive indicator in patients with HNSCC and a reference for immunotherapy decision-making.

Keywords: Head and neck squamous cell carcinoma; Immune infiltration; Immunotherapy; Risk score; Single-cell RNA sequencing; Tumour microenvironment.


Conflict of interest statement

The authors declare that they have no conflicts of interest.

Figures

Fig. 1
Fig. 1
Single-cell RNA sequencing analysis to identify marker genes in mast cells. A t-Stochastic neighbour embedding (t-SNE) plots for immune cells. B Heat map showing the expression levels of specific marker genes in each cluster. C t-SNE plots displaying representative marker gene expression levels for six cell types. D Bubble plots showing the expression of marker genes in six cell types. E t-SNE plots showing cell types among 51,127 immune cells
Fig. 2
Fig. 2
Prognostic analysis of the mast cell gene signature (MCS) risk score. PCA plot (A, E, I); risk score analysis (B, F, J); Kaplan–Meier curve survival analysis (C, G, K); time-receiver operating characteristic curve analysis (D, H, L) in the training, testing, and entire “The Cancer Genome Atlas” cohorts, respectively
Fig. 3
Fig. 3
Prognostic value of the mast cell gene signature (MCS) risk score in the training cohort classified based on clinicopathological variables. Survival curve between high- and low-risk groups stratified by ages (A, B); sex (C, D); T stage (E, F); N stage (G, H); stage (I, J); and grade (K, L)
Fig. 4
Fig. 4
Predictive effects of the mast cell gene signature (MCS) risk score and clinicopathological variables on the prognosis of overall survival of patients with head and neck squamous cell carcinoma. Univariate and multivariate Cox regression analyses between clinicopathological variables (including the MCS risk score) and overall survival of patients in the training (A, B), testing (D, E), and the entire “The Cancer Genome Atlas” (G, H) cohorts; green and red squares represent univariate and multivariate analysis, respectively. Comparison of area under the receiver operating characteristic curve between clinicopathological variables and MCS risk score in the training, testing, and the entire “The Cancer Genome Atlas” cohorts (C, F, I, respectively)
Fig. 5
Fig. 5
Functional and molecular characteristics analysis of the high- and low-risk groups in the entire “The Cancer Genome Atlas” cohort. A Bubble graph for Gene Ontology enrichment (a larger bubble indicates more enriched genes, and an increasing depth of red indicates greater differences; q-value: adjusted P value; GeneRatio: number of DEGs annotated to the GO or KEGG pathway/total number of DEGs). B Bubble graph for the Kyoto Encyclopedia of Genes and Genomes pathways. C Multiple gene set enrichment analysis showing the enriched pathways of the high-risk and (D) low-risk subgroups. E Boxplots show the comparison of single-set gene set enrichment analysis scores for 16 immune cell types and F 13 immune-related functions. CCR, cytokine-cytokine receptor. Adjusted P values are shown as: *P < 0.05; ***P < 0.001
Fig. 6
Fig. 6
Estimation of the roles of the mast cell gene signature (MCS) in predicting immune checkpoint gene expression and immunotherapeutic response. Expression of immune checkpoint genes in different risk groups of the training cohort, violin plot of CD274 (PD-L1) (A), LAG3 (B), CTLA4 (C), TIGIT (D), and IDO1 (E) expression in the low- and high-risk groups. ***P < 0.001. Correlation between the risk scores and immune checkpoint gene expression, scatter plot of CD274 (PD-L1) (F), LAG3 (G), CTLA4 (H), TIGIT (I), and IDO1 (J) expression with risk scores. Association between the immunophenoscore and MCS in patients with head and neck squamous cell carcinoma (HNSCC) based on The Cancer Immunome Database CTLA-4PD-1 (K), CTLA-4PD-1+ (L), CTLA-4+PD-1 (M), CTLA-4+PD-1+ (L)
Fig. 7
Fig. 7
(A, C, E, G, I) Fluorescence in-situ hybridisation (FISH) assay was conducted to determine the expression of model genes in the low-risk and high-risk groups. Nuclei are stained blue (DAPI), and AP2M1, CATSPER1, HSP90B1, RAB32, SMYD3 are stained red. SOCS1, KIT, LINC00996, and LAT are stained green. Scale bar, 50 μm. (B, D, F, H, J) ImageJ was used to measure the mean fluorescence intensity of each gene staining in the images, and the t-test was used to analyse the intergroup significance

Similar articles

Cited by

References

    1. Hui L, Chen Y. Tumour microenvironment: Sanctuary of the devil. Cancer Lett. 2015;368(1):7–13. doi: 10.1016/j.canlet.2015.07.039. - DOI - PubMed
    1. Hinshaw DC, Shevde LA. The Tumour Microenvironment Innately Modulates Cancer Progression. Cancer Res. 2019;79(18):4557–4566. doi: 10.1158/0008-5472.CAN-18-3962. - DOI - PMC - PubMed
    1. Turley SJ, Cremasco V, Astarita JL. Immunological hallmarks of stromal cells in the tumour microenvironment. NAT REV IMMUNOL. 2015;15(11):669–682. doi: 10.1038/nri3902. - DOI - PubMed
    1. Ribatti D, Crivellato E. Mast cells, angiogenesis, and tumour growth. Biochim Biophys Acta. 2012;1822(1):2–8. doi: 10.1016/j.bbadis.2010.11.010. - DOI - PubMed
    1. Komi D, Redegeld FA. Role of Mast Cells in Shaping the Tumour Microenvironment. Clin Rev Allergy Immunol. 2020;58(3):313–325. doi: 10.1007/s12016-019-08753-w. - DOI - PMC - PubMed

MeSH terms

Substances