

Multilevel hybrid principal components analysis for region-referenced functional electroencephalography data
- PMID: 35611602
- PMCID: PMC9308678
- DOI: 10.1002/sim.9445
Multilevel hybrid principal components analysis for region-referenced functional electroencephalography data
Abstract
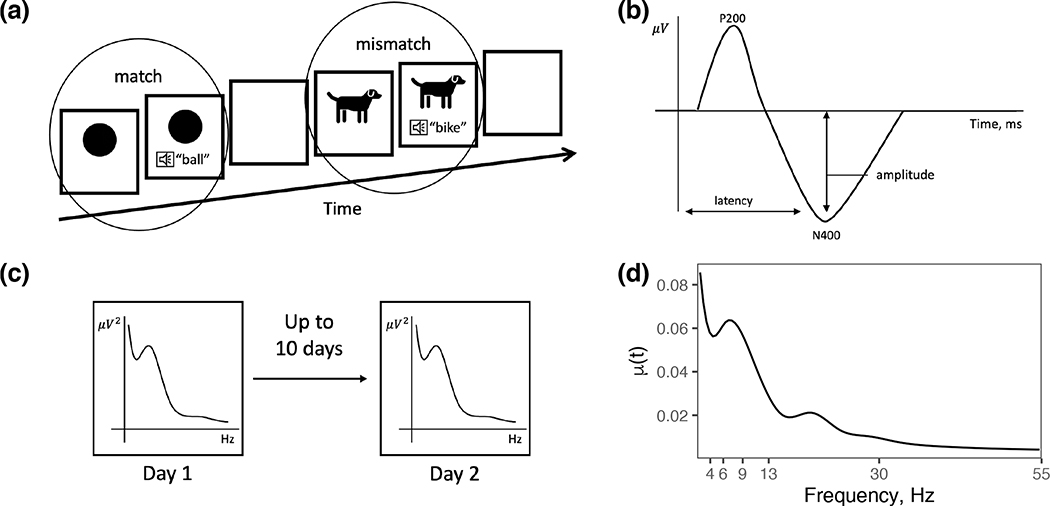
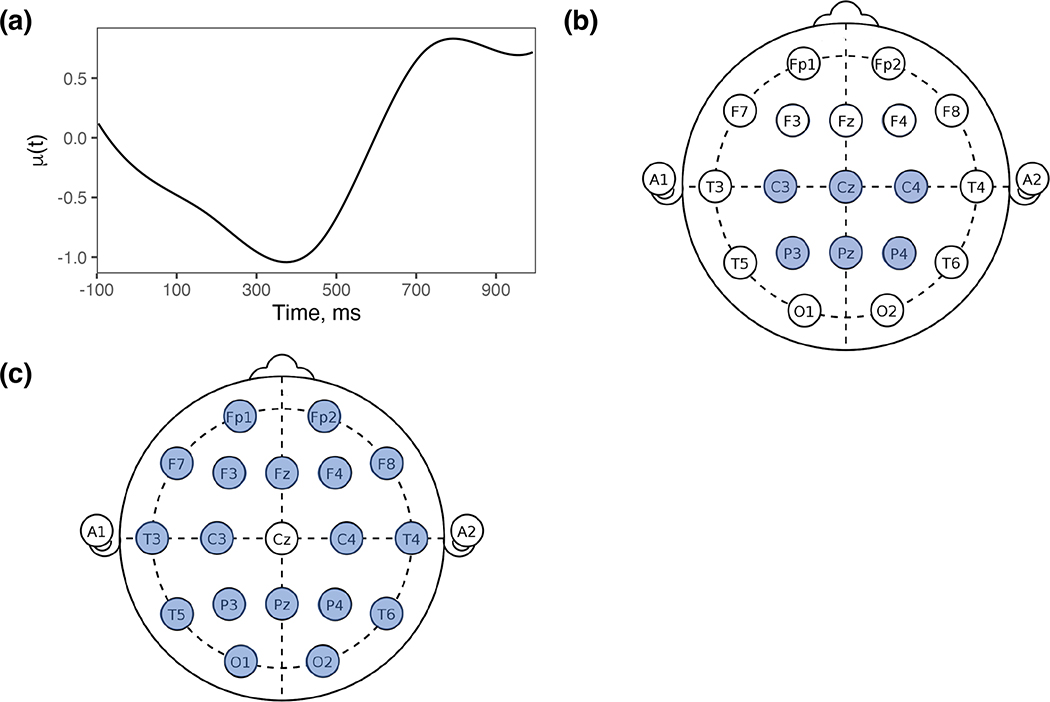
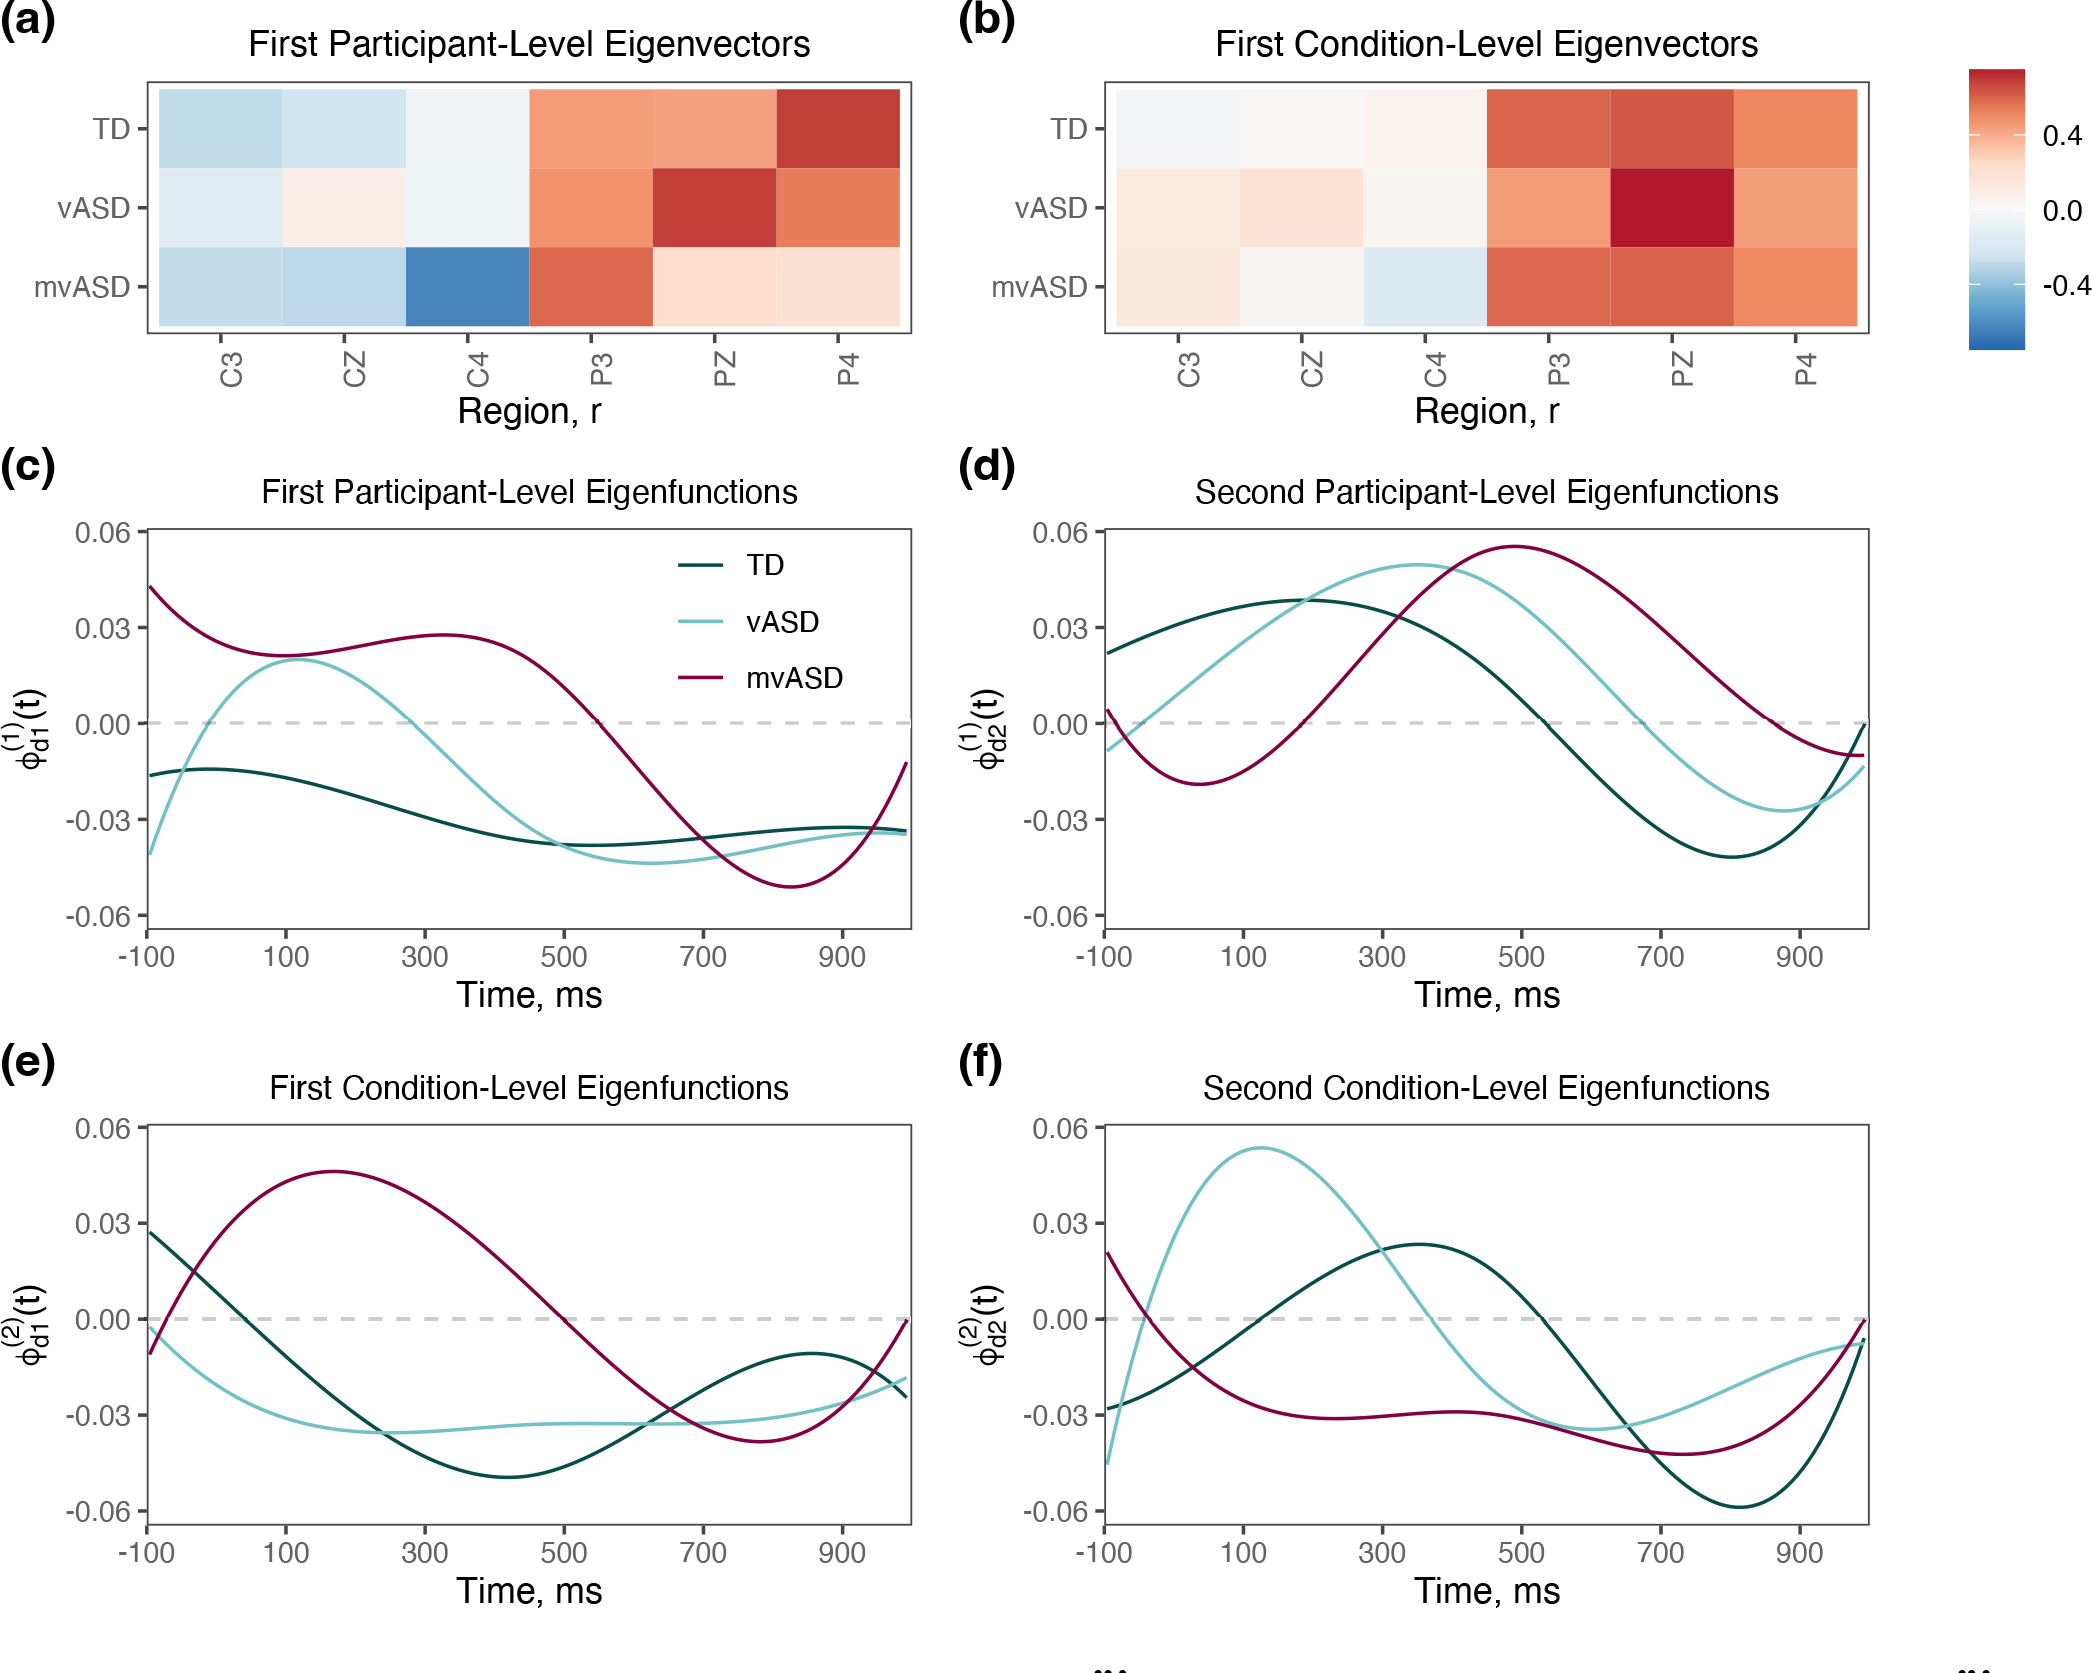
Electroencephalography experiments produce region-referenced functional data representing brain signals in the time or the frequency domain collected across the scalp. The data typically also have a multilevel structure with high-dimensional observations collected across multiple experimental conditions or visits. Common analysis approaches reduce the data complexity by collapsing the functional and regional dimensions, where event-related potential (ERP) features or band power are targeted in a pre-specified scalp region. This practice can fail to portray more comprehensive differences in the entire ERP signal or the power spectral density (PSD) across the scalp. Building on the weak separability of the high-dimensional covariance process, the proposed multilevel hybrid principal components analysis (M-HPCA) utilizes dimension reduction tools from both vector and functional principal components analysis to decompose the total variation into between- and within-subject variance. The resulting model components are estimated in a mixed effects modeling framework via a computationally efficient minorization-maximization algorithm coupled with bootstrap. The diverse array of applications of M-HPCA is showcased with two studies of individuals with autism. While ERP responses to match vs mismatch conditions are compared in an audio odd-ball paradigm in the first study, short-term reliability of the PSD across visits is compared in the second. Finite sample properties of the proposed methodology are studied in extensive simulations.
Keywords: autism spectrum disorder (ASD); electroencephalography (EEG); functional data analysis; marginal covariance; multilevel functional principal components analysis.
© 2022 John Wiley & Sons Ltd.
Figures


References
-
- Kumar JS, Bhuvaneswari P. Analysis of electroencephalography (EEG) signals and its categorization - A study. Procedia Eng 2012; 38: 2525–2536. doi: 10.1016/j.proeng.2012.06.298 - DOI
-
- Ramsay JO, Silverman BW. Functional data analysis. Springer. 2005.
Publication types
MeSH terms
Grants and funding
LinkOut - more resources
Full Text Sources