. 2022 Jun 24;131(1):42-58.
doi: 10.1161/CIRCRESAHA.121.319120. Epub 2022 May 25.

miR-223 Exerts Translational Control of Proatherogenic Genes in Macrophages

Affiliations

miR-223 Exerts Translational Control of Proatherogenic Genes in Macrophages

My-Anh Nguyen et al. Circ Res. .

Abstract

Background: A significant burden of atherosclerotic disease is driven by inflammation. Recently, microRNAs (miRNAs) have emerged as important factors driving and protecting from atherosclerosis. miR-223 regulates cholesterol metabolism and inflammation via targeting both cholesterol biosynthesis pathway and NFkB signaling pathways; however, its role in atherosclerosis has not been investigated. We hypothesize that miR-223 globally regulates core inflammatory pathways in macrophages in response to inflammatory and atherogenic stimuli thus limiting the progression of atherosclerosis.

Methods and results: Loss of miR-223 in macrophages decreases Abca1 gene and protein expression as well as cholesterol efflux to apoA1 (Apolipoprotein A1) and enhances proinflammatory gene expression. In contrast, overexpression of miR-223 promotes the efflux of cholesterol and macrophage polarization toward an anti-inflammatory phenotype. These beneficial effects of miR-223 are dependent on its target gene, the transcription factor Sp3. Consistent with the antiatherogenic effects of miR-223 in vitro, mice receiving miR223-/- bone marrow exhibit increased plaque size, lipid content, and circulating inflammatory cytokines (ie, IL-1β). Deficiency of miR-223 in bone marrow-derived cells also results in an increase in circulating pro-atherogenic cells (total monocytes and neutrophils) compared with control mice. Furthermore, the expression of miR-223 target gene (Sp3) and pro-inflammatory marker (Il-6) are enhanced whereas the expression of Abca1 and anti-inflammatory marker (Retnla) are reduced in aortic arches from mice lacking miR-223 in bone marrow-derived cells. In mice fed a high-cholesterol diet and in humans with unstable carotid atherosclerosis, the expression of miR-223 is increased. To further understand the molecular mechanisms underlying the effect of miR-223 on atherosclerosis in vivo, we characterized global RNA translation profile of macrophages isolated from mice receiving wild-type or miR223-/- bone marrow. Using ribosome profiling, we reveal a notable upregulation of inflammatory signaling and lipid metabolism at the translation level but less significant at the transcription level. Analysis of upregulated genes at the translation level reveal an enrichment of miR-223-binding sites, confirming that miR-223 exerts significant changes in target genes in atherogenic macrophages via altering their translation.

Conclusions: Our study demonstrates that miR-223 can protect against atherosclerosis by acting as a global regulator of RNA translation of cholesterol efflux and inflammation pathways.

Keywords: animal models of human disease; cholesterol; inflammation; lipids; metabolism; vascular biology.


Figures

Figure 1.
Figure 1.
miR-223 positively regulates ABCA1 (ATP-binding cassette transporter A1) expression and promotes macrophage cholesterol efflux. A–C, SP3 mRNA (A) and protein (B) expression, as well as ABCA1 protein expression (C), in BMDMs transfected with control mimic/miR-223 mimic (100 nM) or isolated from WT/miR-223−/− mice. Data are the means of n=3 independent experiments±SEM. Western blot is representative of a single experiment done in triplicate (n=3). D, Cholesterol efflux to apoA1 (25 μg/mL) was measured for 24 h. Graphs represent the means±SEM from n=3 independent experiments. E, BMDMs were cholesterol-loaded and polarized into M1 macrophages or M2 macrophages by induction with LPS (100 ng/ml)/IFN-γ (100 ng/mL) or IL-4 (10 ng/mL), respectively, for 24 h. Cholesterol efflux to apoA1 (25 μg/mL) was measured for 24 h. Graphs represent the experiments performed in triplicate (n=3). F, BMDMs isolated from WT/miR-223−/− mice were transfected with control siRNA or Sp3 siRNA (25 nM). Following siRNA transfection, BMDMs were cholesterol-loaded for 24 h, and cholesterol efflux to apoA1 (25 μg/mL) was measured for 24 h. Graphs represent the experiments performed in triplicate (n=3). For comparisons between 2 groups (A–D), a t test was used. For comparisons between 2 groups in different conditions (E and F), a 2-way ANOVA with a Sidak post hoc test for multiple comparisons was used (E was corrected for 3 tests and F was corrected for 2 tests). Ctrl siRNA indicates control short interfering RNA; HSP90, heat shock protein 90 kDa; SP3, specificity protein 3; and WT, wild-type.
Figure 2.
Figure 2.
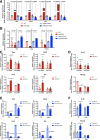
miR-223 suppresses macrophage pro-inflammatory activation and promotes macrophage polarization toward the anti-inflammatory phenotype. A and B, BMDMs transfected with control mimic/miR-223 mimic (100 nM) or isolated from WT/miR-223−/− mice were polarized into either M1 macrophages by induction with LPS (100 ng/mL)/IFN-γ (100 ng/mL) or M2 macrophages by induction with IL-4 (10 ng/mL) for 24 h. Expression levels of (A) M1 markers (Tnfa, Nos2, Il-1b, Il-6) and (B) M2 markers (Il-10, Arg1, Retnla) were measured by qPCR. Graphs represent the means±SEM from at least n=3 technical or biological replicates. C and D, Inhibition of SP3 partially relieves the effects of miR-223 on macrophage polarization. BMDMs isolated from WT/miR-223−/− mice were transfected with control siRNA or Sp3 siRNA (25 nM). Expression levels of (C) M1 markers (Tnfa, Nos2, Il-1b, Il-6) and (D) M2 markers (Arg1, Retnla) were measured by qPCR. Data are the means of n=3 (Tnfa, Il-1b, Il-6, Retnla) or n=4 (Nos2, Arg1) technical/biological replicates±SEM. E and F, miR-223 alters M2 activation but not M1 activation dependently of ABCA1 (ATP-binding cassette subfamily A member 1). BMDMs isolated from WT/Abca1−/− mice were transfected with control mimic or miR-223 mimic (100 nM). Expression levels of (E) M1 markers (Tnfa, Nos2, Il-1b, Il-6) and (F) M2 markers (Il-10, Retnla) were measured by qPCR. Graphs represent the experiments performed in triplicate (n=3). For comparisons between 2 groups (A and B), a t test was used. For comparisons between 2 groups in different conditions (C–F), a 2-way ANOVA with a Sidak post hoc test for multiple comparisons (corrected for 2 tests) was used. Arg1 indicates arginase 1; Ctrl siRNA, control short interfering RNA; Il, interleukin; Nos2, nitric oxide synthase 2; Retnla, resistin-like alpha; Sp3, specificity protein 3; Tnfa, tumor necrosis factor alpha; and WT, wild-type.
Figure 3.
Figure 3.
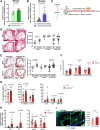
Deletion of miR-223 in bone marrow (BM) cells promotes atherogenesis and enhances inflammatory signaling. A, Aortic expression of miR-223 in ApoE−/− mice fed a chow (n=5) or western diet (21% fat, 0.2% cholesterol) for 12 wk (n=7). The graph represents the means±SEM. B, Human miR-223 expression in plaque samples from asymptomatic (stable) (n=15) or symptomatic (ruptured) (n=15) patients. Data are the means±SEM. C, Ldlr−/− mice (n=6 male and 6 female/group) were lethally irradiated and given BM transplantation from WT or miR-223−/− donors, followed by high-cholesterol diet (HCD) for 12 wk. D and E, miR-223 deficiency in BM cells increases atherosclerotic plaque (D) size and (E) lipid content. Aortic sinus lesion areas across the entire aortic root from H&E-stained sections were quantified using ImageJ whereas lipid accumulation in aortic sinus lesions was measured by oil red O staining. Images show representative sections from Ldlr−/− mice with WT BM (left) and miR-223−/− BM (right). Data are the means±SEM. F, Circulating levels of leukocytes after 12 wk of HCD were analyzed by FACS. Data are the mean levels of 12 mice per group ± SEM. G, Circulating cytokine levels in mice receiving WT BM or miR-223−/− BM (n=12 mice per group for IL-2, IL-12(p70), IL-17A, IL-1b; n=6 mice per group for IL-9, GM-CSF) were determined by the Bio-Plex Pro Mouse Cytokine 23-plex assay at the end of the 12-wk study. Data are the means±SEM. H, Gene expression in the aortas of Ldlr−/− mice receiving WT BM or miR-223−/− BM. The aorta was homogenized using microbeads along with the Bullet Blender. Total RNA was isolated and the expression levels of Sp3, Il6, Abca1, and Retnla were measured by ddRT-PCR. Graphs represent the means±SEM from n=10–12 mice per group. I, Immunofluorescence staining for SP3 in lesions from mice receiving WT BM or miR-223−/− BM. Data are the mean levels of 8 mice per group±SEM. A t test was used to determine statistical significance for comparisons between 2 groups (A–I), except E—data of male mice, G—IL-1b data, and H—Il6 data (that did not pass normality testing) where a Mann-Whitney U test was used. Abca1 indicates ATP-binding cassette subfamily A member 1; ApoE, apolipoprotein E; GM-CSF, granulocyte macrophage-colony stimulating factor; IL, interleukin; Ldlr, low-density lipoprotein receptor; MFI, mean fluorescence intensity; ORO, oil red O; Retnla, resistin like alpha; Sp3, specificity protein 3; and WT, wild-type.
Figure 4.
Figure 4.
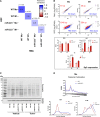
Global analysis of transcription and translation regulation in miR-223 −/− BMDMs. A, Correlation matrix of ribosome-protected fragment (RPF; y-axis) and mRNA (x-axis) expression. Numbers show Pearson’s correlation for each pair of RPF-RNA. P for each comparison is shown on top of each cell. Average expression level of each gene was used. B, Upper panels: scatter plots showing the expression levels of individual genes in miR-223−/− (y-axis) vs WT (x-axis) BMDMs at the mRNA or RPF level as indicated. Lower panels: graphs of Sp3 expression measured at the RNA or RPF level, or Sp3 translation efficiency (RPF/RNA). A 2-way ANOVA with a Sidak post hoc test for multiple comparisons was used (corrected for 2 tests). C, Puromycin metabolic labeling of newly synthesized proteins of WT or miR-223−/− BMDMs. Torin1 (300 nmol/L) was used to inhibit mTORC1-dependent protein synthesis as a control. D, Polysome fractionation analysis of translation activity in WT vs miR-223−/− Mo BMDMs. Left panel: polysome traces of cytoplasmic RNA extract on a linear 10% to 50% sucrose gradient. Middle and right graphs: distribution of Sp3 or ActB mRNA across sucrose gradient, quantified by RT-qPCR. ActB indicates beta-actin; RPF, ribosome protected fragment; RPKM, read per kilobase million; Sp3, specificity protein 3; TE, translation efficiency; and WT, wild-type.
Figure 5.
Figure 5.
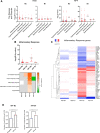
Ingenuity pathway analysis reveals activation of inflammatory signaling at the transcription and translation level in BMDMs. A, Scatter plot of Benjamini-Hochberg (B–H) adjusted P of significantly dysregulated processes/functions in Disease and Disorder analysis of the transcriptome and translatome of miR-223−/− BMDMs compared with WT BMDMs. A B-H adjusted P cutoff of 0.05 (−log10[B-H adjusted P] >1.3) was applied and all accepted processes/functions were shown as individual dots. B, Top plot: scatter plot of B-H adjusted P of significantly dysregulated processes/functions in the Inflammatory Response sub-category of miR-223−/− BMDMs compared with that of WT BMDMs. A B-H adjusted P cut-off of 0.05 (−log10[B-H adjusted P] >1.3) was applied, and all accepted processes/functions were shown as individual dots. Bottom plot: activation z-score of top 5 differentially regulated pathways in the Inflammatory Response sub-category of miR-223−/− BMDMs compared with that of WT BMDMs. The cell is gray when an activation z-score cannot be determined by IPA. C, Heatmap of average miR-233−/−/WT fold change of representative inflammatory response genes at the RNA and ribosome protected fragment (RPF) level. All genes associated with all processes/functions in B were combined, then their clustering was calculated based on their fold change (miR-233−/−/WT) values using the Average Linkage method. D, Occurrence of AUUUA motif in the 3’UTR of all genes vs upregulated genes in miR-223−/− BMDMs. Normalized count values were compared using Mann-Whitney U test. RPF indicates ribosome protected fragment.

References

    1. Lusis AJ. Atherosclerosis. Nature. 2000;407:233–241. doi: 10.1038/35025203 - PMC - PubMed
    1. Tabas I, García-Cardeña G, Owens GK. Recent insights into the cellular biology of atherosclerosis. J Cell Biol. 2015;209:13–22. doi: 10.1083/jcb.201412052 - PMC - PubMed
    1. Weber C, Noels H. Atherosclerosis: current pathogenesis and therapeutic options. Nat Med. 2011;17:1410–1422. doi: 10.1038/nm.2538 - PubMed
    1. Di Gregoli K, Johnson JL. Role of colony-stimulating factors in atherosclerosis. Curr Opin Lipidol. 2012;23:412–421. doi: 10.1097/MOL.0b013e328357ca6e - PubMed
    1. Moore KJ, Tabas I. Macrophages in the pathogenesis of atherosclerosis. Cell. 2011;145:341–355. doi: 10.1016/j.cell.2011.04.005 - PMC - PubMed

Publication types

Grants and funding