. 2022 Jul;9(21):e2103332.
doi: 10.1002/advs.202103332. Epub 2022 May 25.

ALTEN: A High-Fidelity Primary Tissue-Engineering Platform to Assess Cellular Responses Ex Vivo

Affiliations

ALTEN: A High-Fidelity Primary Tissue-Engineering Platform to Assess Cellular Responses Ex Vivo

Andrew M K Law et al. Adv Sci (Weinh). 2022 Jul.

Abstract

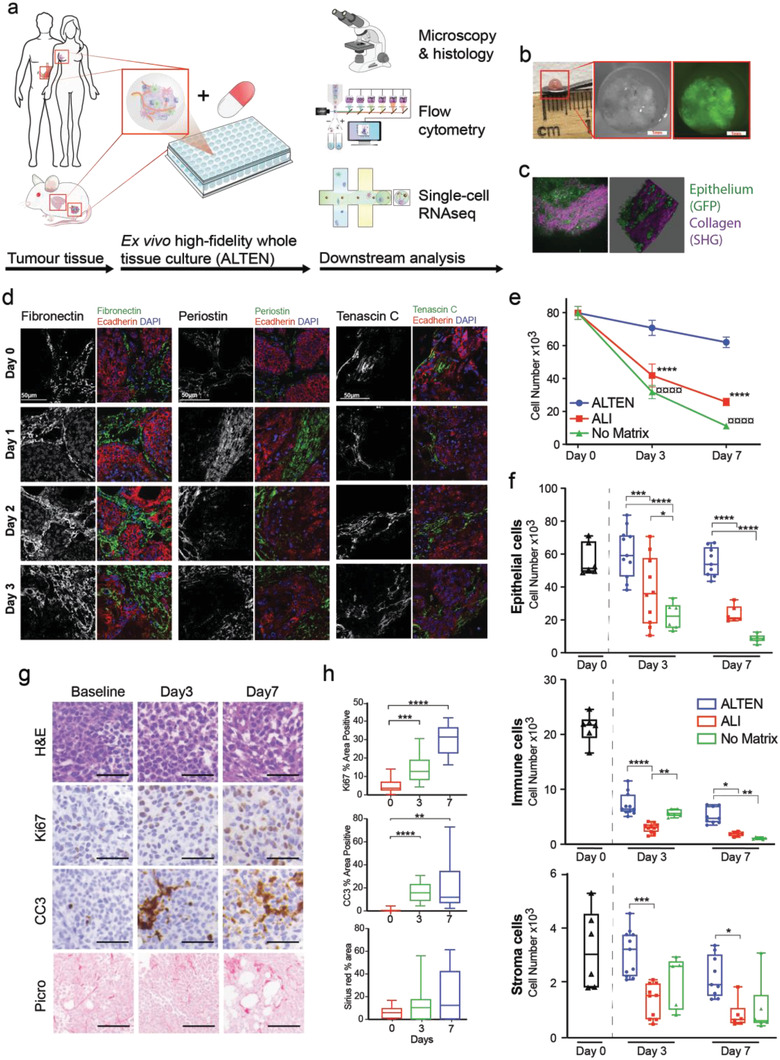
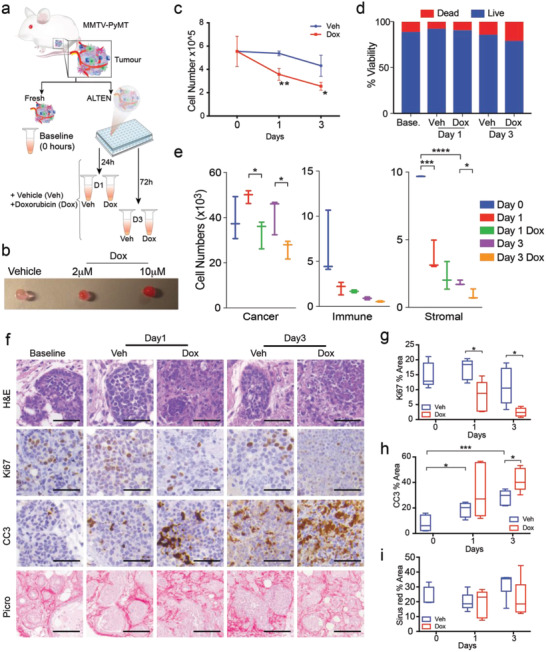
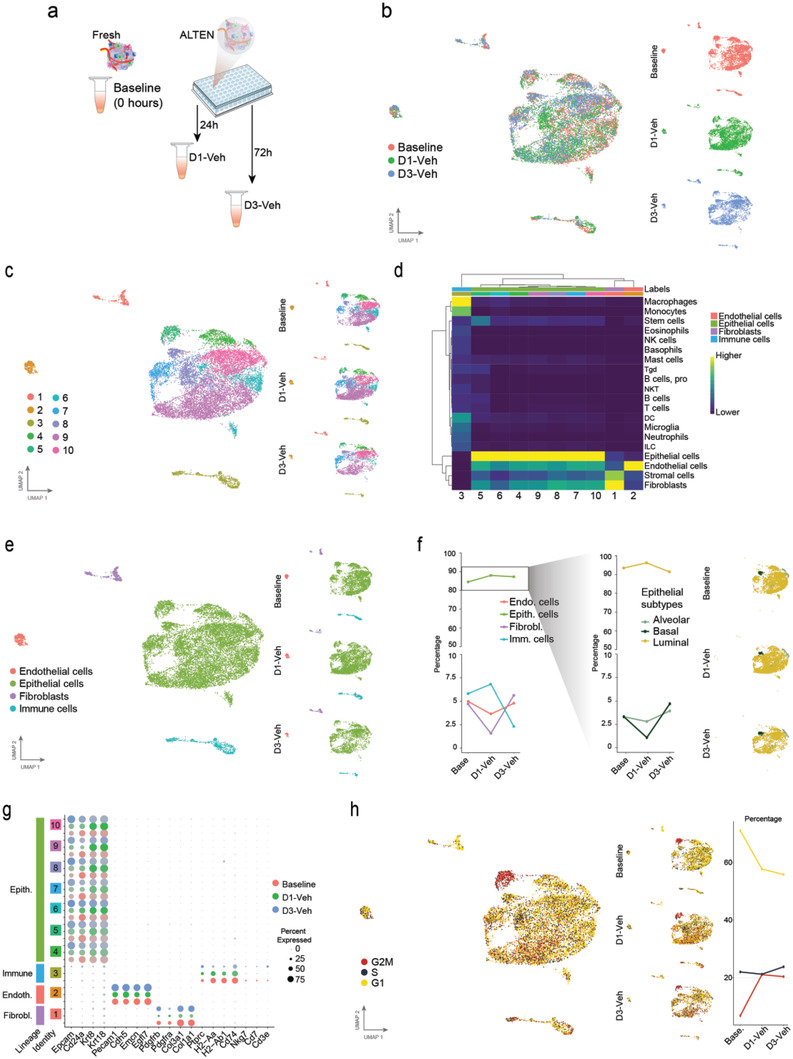
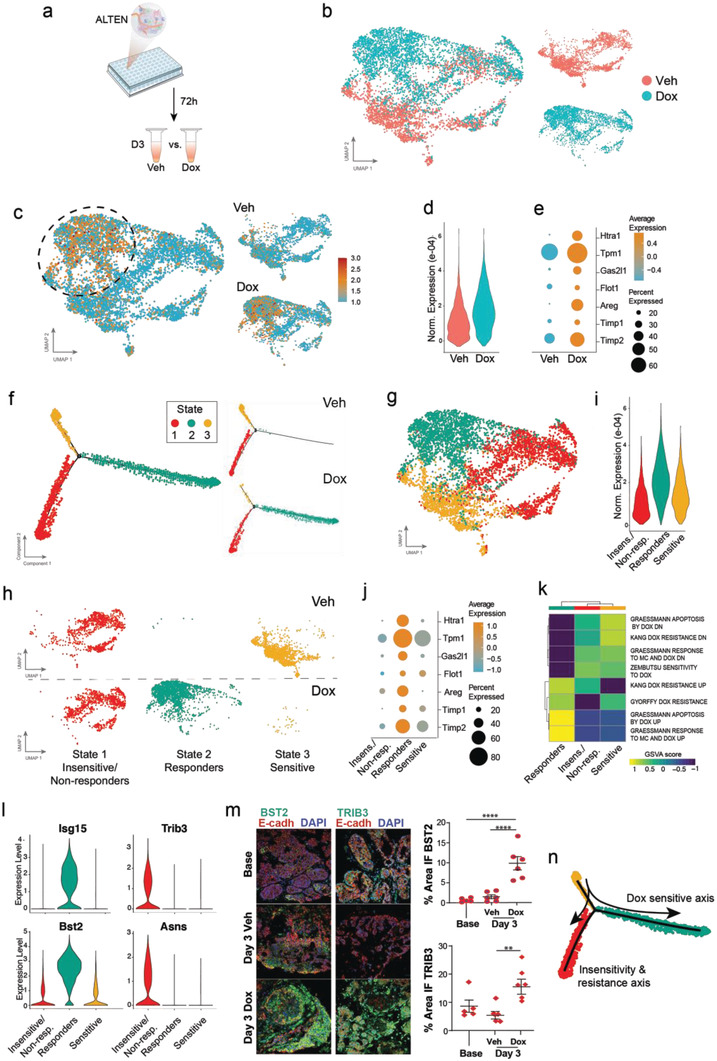
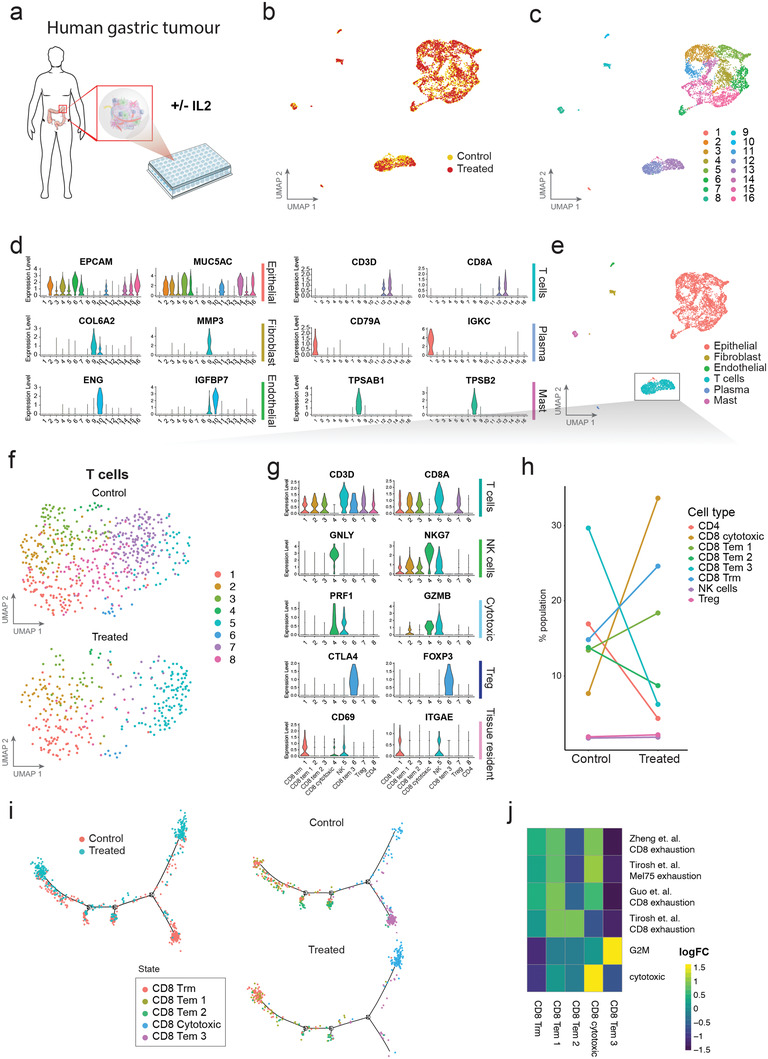
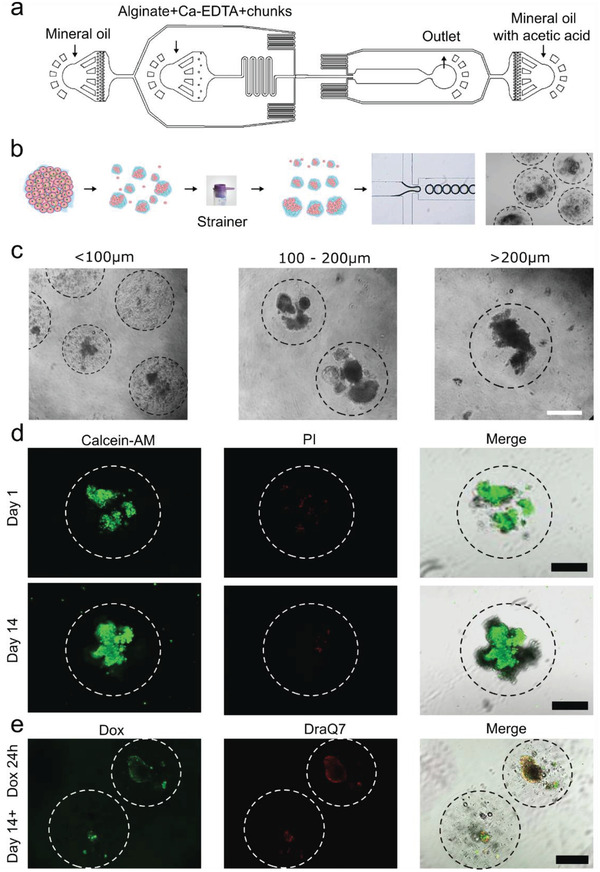
To fully investigate cellular responses to stimuli and perturbations within tissues, it is essential to replicate the complex molecular interactions within the local microenvironment of cellular niches. Here, the authors introduce Alginate-based tissue engineering (ALTEN), a biomimetic tissue platform that allows ex vivo analysis of explanted tissue biopsies. This method preserves the original characteristics of the source tissue's cellular milieu, allowing multiple and diverse cell types to be maintained over an extended period of time. As a result, ALTEN enables rapid and faithful characterization of perturbations across specific cell types within a tissue. Importantly, using single-cell genomics, this approach provides integrated cellular responses at the resolution of individual cells. ALTEN is a powerful tool for the analysis of cellular responses upon exposure to cytotoxic agents and immunomodulators. Additionally, ALTEN's scalability using automated microfluidic devices for tissue encapsulation and subsequent transport, to enable centralized high-throughput analysis of samples gathered by large-scale multicenter studies, is shown.

Keywords: alginate; ex vivo drug screening; single-cell RNAseq; three dimensional culture; tissue microenvironment; whole-tissue organoids.


Conflict of interest statement

The authors declare no conflict of interest.

Figures

Figure 1
Figure 1
ALTEN preserves tissue architecture and cell viability ex vivo. a) Schematic representation of the ALTEN methodology. b) Macroscopic and stereo microscopy pictures of a MMTV‐PyMT/GFP+ ALTEN‐engineered tumoroid, Green: GFP expression restricted to mammary epithelial cells. c) Multiphoton microscopy image and 3D projection of an encapsulated MMVT‐PyMT/GFP tumor. Green: GFP expression restricted to mammary epithelial cells, purple: second harmonic generation (SHG) signal from collagen fibers within the tumor extracellular matrix. d) Immunofluorescent analysis of the main ECM components, fibronectin, periostin, and tenascin C (greyscale and green) in ALTEN encapsulated MMTV‐PyMT tumors for 1, 2, and 3 days. Epithelial cells are stained with E‐cadherin (red) and nuclei counterstained with DAPI (blue). e) Comparison of live cell number assayed by flow cytometry from cell suspensions of 4T1.2 mammary carcinomas (equivalent volume) cultured in ALTEN (blue line), ALI (red line), and as a naked explant (green line) compared to the cell number yield of the fresh tissue (baseline, time = 0) (n ≥ 5). f) Flow cytometric analysis of live cell number as in (e) but divided by main lineage, (4T1.2 cancer cells are defined by expression of mCherry, immune cells are defined by CD45, and stromal cells are defined as double negative). g) Representative histology images of ALTEN‐engineered 4T1.2 tumoroids stained by H&E, Picrosirius red (collagen), or immunolabeled for cleaved caspase 3 (CC3) and Ki67 antibodies. h) Quantification of the area stained in the histology images (n ≥ 5). Data are represented as mean ± SEM. p‐values are calculated using one‐way ANOVA testing followed by Dunnett's multiple comparison test, *p < 0.05, **p < 0.01, ***p < 0.001, ****p < 0.0001.
Figure 2
Figure 2
ALTEN is a high‐fidelity ex vivo platform for whole‐tissue drug perturbation analysis. a) Schematic representation of the experimental design. b) Macroscopic images of ALTEN hydrogels incubated 24 h with doxorubicin (red) at the indicated dose. c,d) Cell number and cell viability assayed by flow cytometry (DAPI) from cell suspensions of fresh (baseline, time = 0) or ALTEN‐cultured MMTV‐PyMT mammary carcinomas. e) Number of live cells obtained on the tissues assayed in panel (c) and divided by major lineage (PyMT cancer cells are defined by expression of EpCAM, immune cells are defined by CD45, and stromal cells are defined as double negative). f) Representative histology images of ALTEN‐engineered PyMT tumoroids stained by H&E, Picrosirius red (collagen), or immunolabeled for cleaved caspase 3 (CC3) and Ki67 antibodies. g–i) Quantification of the area stained in the histology images in response to doxorubicin (n ≥ 5). All captions: Veh = vehicle, DOX = doxorubicin. Data are represented as mean ± SEM. p‐values are calculated using one‐way ANOVA testing followed by Dunnett's multiple comparison test, *p < 0.05, **p < 0.01, ***p < 0.001, ****p < 0.0001.
Figure 3
Figure 3
ALTEN preserves tumor complexity and cell diversity measured by scRNAseq. a) Schematic representation of the experimental design. b) UMAP projection of ALTEN‐engineered tumoroids cultured 1 (5474 cells) and 3 days (3156 cells) compared with fresh tissue (baseline, 5048 cells) normalized using SCTransform function and anchor‐based integration from Seurat. c) UMAP projection showing unsupervised clustering overall (left) and split by time point (right). d) Heatmap showing the single R score of each unsupervised cluster against the mouse cell type reference signature generated by the Immunologic Genome Project.[ 12a,b ] e) UMAP projection showing cell lineage based on single R analysis overall (left) and split by time point (right). f) Line plot showing the percentage of cells from each lineage in the baseline condition and after 1 day or 3 days of culture in ALTEN (left). The right panel shows the percentage of cells in each epithelial cell type per culture condition and the epithelial subtypes plotted in the epithelial UMAP. g) Dot plot showing the comparison between culture conditions in the level of expression of top cell lineage markers in each cell cluster. h) UMAP projection showing cell cycle phase (left) and the percentage of cells from each phase at each culture timepoint (right).
Figure 4
Figure 4
Detecting the molecular response of Doxorubicin treatment in ALTEN‐tumoroids. a) Schematic representation of the experimental design. b) UMAP projection of epithelial cells cultured in the ALTEN system for 72 h with doxorubicin (DOX, 3777 cells) or vehicle (Veh, 2843 cells) normalized using SCTransform function from Seurat. c) UMAP visualization showing the metagene signature of doxorubicin response (see Table 1) overall (left) and split based on condition (right). d) Violin plot showing the normalized expression of the metagene signature of doxorubicin response in vehicle and doxorubicin treated cells. e) Dot plot showing the percentage of expressing cells and average expression of seven genes from the doxorubicin response signature in untreated (Veh) and treated (DOX) cells. f) Trajectory analysis of cancer epithelial cells based on differential analysis between the vehicle‐ and DOX‐treated cells using the DDRTree method in Monocle2 and colored by states. Right panels show the distribution of the cell states by condition. g) Projection of the states defined by pseudotime analysis into the UMAP coordinates. h) Projection of the states defined by pseudotime analysis into the UMAP coordinates per trajectory state and condition. i) Violin plot showing the normalized expression of the metagene signature for doxorubicin response of each state (1: insensitive/Resistant, 2: DOX committed, 3: DOX sensitive). j) Dot plot showing the percentage of expressing cells and average expression of seven genes from the doxorubicin response signature in each DOX‐dependent state. k) Enrichment analysis (GSVA score) for doxorubicin response gene sets. l) violin plot for marker genes from gene sets in panel (k). m) Immunofluorescence of Bst2, Trib3, and E‐Cadh of PyMT‐derived ALTEN tumoroids at baseline (t = 0) and after 3 days in culture exposed to doxorubicin (DOX) a vehicle control (Veh). n) Summary of the doxorubicin response axis at the single‐cell resolution. Data are represented as mean ± SEM, n = 5. p‐values are calculated using one‐way ANOVA testing followed by Dunnett's multiple comparison test, **p < 0.01, ****p < 0.0001.
Figure 5
Figure 5
Immunomodulation of gastric intestinal metaplasia (GIM) infiltrated immune cells ex vivo. a) Schematic representation of experimental workflow. b) UMAP projection of human GIM tissue cultured in the ALTEN system for 24 h and colored based on condition, control (yellow, 2754 cells) or IL2 treated (red, 2501 cells). c) UMAP projections colored based on k‐nearest neighbor clustering. d) Violin plots showing normalized expression of marker genes for epithelial, fibroblast, endothelial, T, Plasma, and Mast cells. e) UMAP projections colored based on cell lineages. T cells are indicated by the boxed area. f) UMAP projection of T cells colored based on k‐nearest neighbor clustering and split by condition (control, 573 cells and IL2, 321 cells). g) Violin plot showing normalized expression of marker genes for T cells, natural killer (NK) cells, cytotoxic T cells, regulatory T cells (Treg), and tissue resident memory T cells (TRM). h) Line plot showing percent of cells from each cell type per condition. i) Trajectory analysis of the T cells based on differential analysis between the control and IL2 treated cells using the DDRTree method in Monocle2 and colored by condition (left) or by cell type and split by condition (right). j) Enrichment analysis (GSVA score) for CD8 T signature gene‐sets.[ 19 ]
Figure 6
Figure 6
Implementation of the ALTEN microfluidic device. a) Blueprint of the microfluidic chip. b) Schematic representation of the process of automated the tissue ALTEN‐engineering. c) Transmitted light microscopy pictures of ALTEN‐engineered tumoroids of different sizes generated by scalable‐size ALTEN devices. d) Fluorescent microscopy images of 200 µm ALTEN‐engineered tumoroids generated using the ALTEN device stained with calcein AM (green) highlighting live cells and propidium iodide (PI, red) revealing dead cells after 1 and 14 days of culture. e) Doxorubicin (DOX) exposure for 24 h on 14‐day cultured ALTEN‐engineered tumoroids, DOX (green), and DraQ7 (Red) (Scale bars = 200 µm).

References

    1. Hay M., Thomas D. W., Craighead J. L., Economides C., Rosenthal J., Nat. Biotechnol. 2014, 32, 40. - PubMed
    1. Law A. M. K., de la Fuente L. R., Grundy T., Fang G., Valdes‐Mora F., Gallego‐Ortega D., Front. Oncol 2021, 11, 782766. - PMC - PubMed
    1. a) Siegel R. L., Miller K. D., Jemal A., Ca‐Cancer J. Clin. 2017, 67, 7. - PubMed
    2. b) Lv D., Hu Z., Lu L., Lu H., Xu X., Oncol. Lett. 2017, 14, 6999. - PMC - PubMed
    1. a) Langhans S. A., Front. Pharmacol. 2018, 9, 6; - PMC - PubMed
    2. b) Tibbitt M. W., Anseth K. S., Biotechnol. Bioeng. 2009, 103, 655. - PMC - PubMed
    1. Sun J., Tan H., Materials 2013, 6, 1285. - PMC - PubMed

LinkOut - more resources