. 2022 Jun 6;154(6):e202213082.
doi: 10.1085/jgp.202213082. Epub 2022 May 25.

Probing function in ligand-gated ion channels without measuring ion transport

Affiliations

Probing function in ligand-gated ion channels without measuring ion transport

Nicole E Godellas et al. J Gen Physiol. .

Abstract

Although the functional properties of ion channels are most accurately assessed using electrophysiological approaches, a number of experimental situations call for alternative methods. Here, working on members of the pentameric ligand-gated ion channel (pLGIC) superfamily, we focused on the practical implementation of, and the interpretation of results from, equilibrium-type ligand-binding assays. Ligand-binding studies of pLGICs are by no means new, but the lack of uniformity in published protocols, large disparities between the results obtained for a given parameter by different groups, and a general disregard for constraints placed on the experimental observations by simple theoretical considerations suggested that a thorough analysis of this classic technique was in order. To this end, we present a detailed practical and theoretical study of this type of assay using radiolabeled α-bungarotoxin, unlabeled small-molecule cholinergic ligands, the human homomeric α7-AChR, and extensive calculations in the framework of a realistic five-binding-site reaction scheme. Furthermore, we show examples of the practical application of this method to tackle two longstanding questions in the field: our results suggest that ligand-binding affinities are insensitive to binding-site occupancy and that mutations to amino-acid residues in the transmembrane domain are unlikely to affect the channel's affinities for ligands that bind to the extracellular domain.


Figures

Figure 1.
Figure 1.
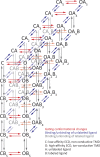
A theoretical framework. A 42-state reaction scheme used to calculate equilibrium ligand-binding concentration–response curves of homopentameric pLGICs as they interact with binary mixtures of ligands competing for the five orthosteric neurotransmitter-binding sites. Curves were calculated to learn about the predicted behavior of this system and guide the interpretation of the experimentally obtained curves. The reaction scheme is composed of elementary thermodynamic cycles consisting of gating conformational changes and ligand-binding steps; thus, the values of the equilibrium constants within each cycle were constrained by detailed balance. The scheme assumes that all five binding sites are identical. Unless otherwise stated, our calculations also assumed that the affinities for labeled and unlabeled ligands are independent of receptor occupancy; affinities depend only on whether the receptor channel is closed or open. For the sake of simplicity, the open and desensitized conformations—that is, the conformations of the channel that bind neurotransmitter and other agonists with higher affinity—were grouped together, not only for the graphical display of this reaction scheme, but also for the calculations. Hence, in the context of this paper, open state refers to both open and desensitized states. Throughout this study, the following symbols were used: KCO, gating equilibrium constant of the unliganded channel; KDA,closed and KDA,open, dissociation equilibrium constants of unlabeled ligand from the closed and open states, respectively; and KDB,closed and KDB,open, dissociation equilibrium constants of labeled ligand from the closed and open states, respectively.
Figure S1.
Figure S1.
Calculated concentration–response curves and various ligand-binding probabilities. (A and B) Various quantities were calculated on the basis of the reaction scheme in Fig. 1 for a hypothetical competition experiment between a labeled ligand and an unlabeled ligand. The parameters were: KCO = 10−7; KDA,closed = 1 μM; KDA,open = 15 nM; KDB,closed = 1 nM; and KDB,open = 4 nM. Thus, the unlabeled ligand was assumed to be an agonist (such as ACh, nicotine, or carbamylcholine), and the labeled ligand, a weak inverse agonist (such as α-BgTx; Bertrand et al., 1997; Jackson, 1984). The total number of binding sites (n) was 5. The principle of detailed balance and the notion that the binding sites are identical and independent were applied to calculate the gating equilibrium constants of the channel in its different ligation states (Eq. 6). The fixed concentration of unbound labeled ligand was set to be equal to its calculated half-saturation concentration. Only the binding of labeled ligand (red plot in A) can be estimated experimentally. In A, the plot in blue is the sum of those in orange and cyan. Also in A, the plot in gray shows what a binding curve of the unlabeled ligand would look like if a competing ligand were not used in the assay. For both panels, the concentration of unlabeled ligand (on the x axes) corresponds to the concentration of unbound unlabeled ligand at equilibrium.
Figure S2.
Figure S2.
The importance of characterizing the interaction between the receptor and the labeled ligand. Calculated equilibrium binding-competition concentration–response curves for several hypothetical scenarios involving perturbations that affect the affinities of the receptor for the unlabeled and labeled ligands. The curves were calculated using the reaction scheme in Fig. 1; for all of them, KCO = 10−7 (in keeping with experimental estimates of this quantity for the wild-type muscle AChR [Jackson, 1984; Purohit and Auerbach, 2009] and the known low unliganded activity of most other wild-type pLGICs). The principle of detailed balance was applied to calculate the gating equilibrium constants of the channel in its different ligation states (Eq. 6). For the sake of conciseness, the concentration of unbound labeled ligand that half-saturates the receptor is referred to as the half-saturation concentration of labeled ligand; the fixed concentration of unbound labeled ligand used to calculate the competition curves is referred to as the fixed concentration of labeled ligand; and the concentration of unbound unlabeled ligand that displaces half of the bound labeled ligand is referred to as the half-competition concentration of unlabeled ligand. The concentration of unlabeled ligand, on the plots’ x axes, corresponds to the concentration of unbound unlabeled ligand at equilibrium. (A and B) Absolute and normalized curves for scenarios i–iv. The curve in i represents a baseline curve calculated using the following state-specific affinities for the labeled ligand: KDB,closed = 1 nM and KDB,open = 4 nM (and thus, from detailed balance, the gating equilibrium constant of the channel bound to five molecules of this weak inverse agonist was 10−7 × (1/4)5 ≅ 10−10). Furthermore, for the unlabeled ligand: KDA,closed = 1 μM and KDA,open = 15 nM (and thus, the gating equilibrium constant of the channel fully bound to this strong agonist was 10−7 × [1/0.015]5 ≅ 132). With these values, it can be calculated that the half-saturation concentration of labeled ligand is ∼1 nM, and thus, the fixed concentration of labeled ligand was chosen to also be 1 nM—in this way, the ratio between these two quantities was unity. Under these conditions, the half-competition concentration of unlabeled ligand can be calculated to be ∼0.88 μM. In ii, we modeled a perturbation (say, a mutation) that increases KDA,closed and KDA,open by a factor of 100 (the same factor for both) without affecting KDB,closed or KDB,open. Therefore, the half-saturation concentration of labeled ligand remains ∼1 nM, and the fixed concentration of labeled ligand was again chosen to be 1 nM. Under these conditions, the half-competition concentration of unlabeled ligand can be calculated to also increase by a factor of ∼100; it is ∼88 μM (the curve shifts to the right). In iii, the hypothetical perturbation decreases KDB,closed and KDB,open by a factor of 10 in addition to increasing KDA,closed and KDA,open by a factor of 100, as in ii. With these values, it can be calculated that the half-saturation concentration of labeled ligand is ∼100 pM. Assuming that the experimenter performed a saturation curve and noted this change, the fixed concentration of labeled ligand was adjusted to 100 pM, so as to keep a constant ratio between the fixed and half-saturation concentrations across constructs. Under these conditions, the half-competition concentration of unlabeled ligand can be calculated to be ∼88 μM. That is, provided that changes in the affinity of the receptor for the labeled ligand are detected and accounted for, they have no effect on the binding-competition curves. As a result, curves ii and iii overlap completely. Finally, in iv, the situation in iii is illustrated assuming that the experimenter did not notice the change in affinities for the labeled ligand and thus still used a concentration of 1 nM of it throughout the assay. Under these conditions, the half-competition concentration of unlabeled ligand can be calculated to be quite larger than the expected value of ∼88 μM: ∼490 μM. Indeed, at a concentration of 1 nM, a ligand with a 100-pM dissociation equilibrium constant would bind to ∼91% of the binding sites (∼4.5 of 5 sites) rather than to only 50% of them, and thus, a higher concentration of competing ligand is required to half-displace it. Clearly, ignoring the effect of mutations on the receptor’s affinity for the labeled ligand leads to errors. (C and D) Absolute and normalized curves for scenarios v–viii. These curves are the counterparts of those in i–iv (A and B) with a ratio of fixed-to-half-saturation concentrations of unbound labeled ligand equal to 10 for the baseline condition. Although each curve is shifted to the right relative to its counterpart in A and B, keeping a constant ratio between the fixed and half-saturation concentrations of labeled ligand ensured that plots vi and vii are identical, much like plots ii and iii are. In iii and vii, the curves are plotted with thicker lines to clearly show the iiiii and vivii complete overlap. It follows that the ratio between the fixed concentration of labeled ligand used in competition assays and the concentration of labeled ligand that half-saturates the receptor need not be unity. However, this ratio needs to be kept constant across constructs for comparisons between receptors that display different affinities for the labeled ligand to only reflect changes in the properties of the unlabeled ligand. Furthermore, for any given construct, this ratio needs to remain constant for comparisons across different experimental conditions, different competing unlabeled ligands, and different laboratories to be meaningful.
Figure 2.
Figure 2.
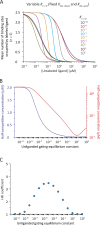
Predicted effects of changes in the unliganded-gating equilibrium constant on equilibrium binding-competition concentration–response curves. Curves were calculated using the reaction scheme in Fig. 1 with a variable KCO and the following fixed parameters: KDA,closed = 1 μM; KDA,open = 15 nM; and KDB,closed = KDB,open = 1 nM. Thus the unlabeled ligand was assumed to be an agonist, and the labeled ligand, an antagonist. The principle of detailed balance and the notion that the binding sites are identical and independent were applied to calculate the gating equilibrium constants of the channel in its different ligation states (Eq. 6). The fixed concentration of unbound labeled ligand was set to be equal to its calculated half-saturation concentration, and hence the mean number of binding sites per receptor occupied by labeled ligand in the absence of unlabeled ligand was equal to 2.5. (A) Calculated curves. The concentration of unlabeled ligand (on the x axis) corresponds to the concentration of unbound (free) unlabeled ligand at equilibrium. (B) Half-competition concentration values. The y axis is displayed in both linear (blue) and logarithmic (red) scales. Because half-competition concentration values depend on both unliganded gating and closed/open-state affinities, changes in this empirical parameter (upon, say, mutations) cannot be unequivocally ascribed to changes in specific equilibrium constants without additional information. (C) Hill-coefficient values obtained from the fitting of calculated curves with Hill equations. No more than a single Hill-equation component was required to fit the equilibrium–competition curves. The estimated values of the Hill coefficient ranged between unity and ∼2.8, that is, a number well below the total number of binding sites.
Figure S3.
Figure S3.
Predicted effects of changes in the unliganded-gating equilibrium constant on equilibrium binding-competition concentration–response curves for an inverse-agonist labeled ligand. Curves were calculated using the reaction scheme in Fig. 1 with a variable KCO and the following fixed parameters: KDA,closed = 1 μM; KDA,open = 15 nM; KDB,closed = 1 nM; and KDB,open = 4 nM. Other details of the calculations and the display of the predictions are given in the legend to Fig. 2. (A) Calculated curves. (B) Half-competition concentration values. The plot’s minimum (most clearly displayed in the logarithmic-axis representation, in red) becomes more pronounced as the KDB,open/KDB,closed ratio of the (inverse-agonist) labeled ligand increases. (C) Hill-coefficient values. The corresponding estimates ranged between unity and ∼3.5.
Figure 3.
Figure 3.
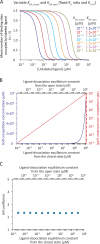
Predicted effects of changes in the closed- and open-state affinities for the unlabeled ligand on equilibrium binding-competition concentration–response curves. Curves were calculated using the reaction scheme in Fig. 1 with variable KDA,closed and KDA,open values and the following fixed parameters: KCO = 10−7 and KDB,closed = KDB,open = 1 nM. For the sake of simplicity, we assumed that the closed- and open-state affinities are linearly related (KDA,open = factor × KDA,closed) in such a way that changes in the former were accompanied by changes in the latter, but their ratio remained constant (for the muscle AChR, however, experiments have suggested that KDA,open = KDA,closedfactor, instead; Nayak et al., 2019). As a result, the channel’s gating equilibrium constants (both unliganded and liganded) remained unchanged (Eq. 6). Other details of the calculations and the display of the predictions are given in the legend to Fig. 2. (A) Calculated curves. (B) Half-competition concentration values. (C) Hill-coefficient values.
Figure 4.
Figure 4.
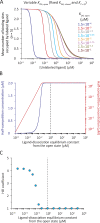
Predicted effects of changes in the closed-state affinity for the unlabeled ligand on equilibrium binding-competition concentration–response curves. Curves were calculated using the reaction scheme in Fig. 1 with a variable KDA,closed value and the following fixed parameters: KCO = 10−7; KDA,open = 15 nM; and KDB,closed = KDB,open = 1 nM. Other details of the calculations and the display of the predictions are given in the legend to Fig. 2. (A) Calculated curves. (B) Half-competition concentration values. (C) Hill-coefficient values. The corresponding estimates ranged between unity and ∼4.2. In B and C, the liganded-gating equilibrium constants (Eq. 6) increase from left to right. A vertical dashed line indicates where KDA,closed = KDA,open. Hence, to the right of this value, the unlabeled ligand is an agonist, and to the left, an inverse agonist.
Figure 5.
Figure 5.
Predicted effects of changes in the open-state affinity for the unlabeled ligand on equilibrium binding-competition concentration–response curves. Curves were calculated using the reaction scheme in Fig. 1 with a variable KDA,open value and the following fixed parameters: KCO = 10−7; KDA,closed = 1 μM; and KDB,closed = KDB,open = 1 nM. Other details of the calculations and the display of the predictions are given in the legend to Fig. 2. (A) Calculated curves. (B) Half-competition concentration values. (C) Hill-coefficient values. The corresponding estimates ranged between unity and ∼4.2. In B and C, the liganded-gating equilibrium constants (Eq. 6) decrease from left to right. A vertical dashed line indicates where KDA,open = KDA,closed. Hence, to the right of this value, the unlabeled ligand is an inverse agonist, and to the left, an agonist.
Figure 6.
Figure 6.
Experimental saturation concentration–response curves for the human α7-AChR and related constructs. All curves were best fitted with one-component Hill equations. Moreover, for the four curves at 37°C, nH ≅ 1, as expected at equilibrium from an inverse agonist binding to a receptor that is essentially closed when unliganded and has identical and independent ligand-binding sites. The number of independent saturation assays contributing to each plotted curve is indicated in parentheses in the corresponding figure caption. The normalized radioactivity (on the y axes) represents specifically bound toxin calculated by subtracting the amount of nonspecifically bound toxin from the total cell pellet–associated radioactivity. The concentration of [125I]-α-BgTx (on the x axes) corresponds to the concentration of unbound toxin, which was estimated from the radioactivity measured in the supernatant of each individual binding reaction. (A) Human α7-AChR. (B) Human–C. elegans α7-AChR–β-GluCl ECD–TMD chimera. (C) Chicken–C. elegans α7-AChR–β-GluCl ECD–TMD chimera. (D) Human–C. elegans α7-AChR–β-GluCl chimera S56T + S172T. Half-saturation and Hill-coefficient values estimated from assays incubated at 37°C for 24 h are shown in Table 1.
Figure 7.
Figure 7.
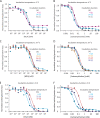
Time and temperature dependence of experimental competition concentration–response curves for MLA and carbamylcholine on the human α7-AChR. MLA is an inverse agonist, whereas carbamylcholine is an agonist. The fixed concentration of unbound [125I]-α-BgTx was approximately equal to the toxin’s half-saturation concentration (Fig. 6 A and Table 1). The number of independent competition assays contributing to each plotted curve is indicated in parentheses in the corresponding figure caption; errors were calculated only when the latter was >2. Error bars (±1 SEM) smaller than the size of the symbols were omitted. The concentration of unlabeled ligand (on the x axes) corresponds to the total (bound plus unbound) concentration. Under the conditions of our experiments, the depletion of unlabeled ligand due to its binding to the receptor was inferred to be low, and thus, the total concentration was deemed to be a good approximation for the concentration of unbound unlabeled ligand at equilibrium. (A and B) 4°C, variable incubation times. Only the curves corresponding to 96-h incubations were best fitted with one-component Hill equations; all others required a second component. (C and D) 37°C, variable incubation times. The curves corresponding to 4-h incubations were best fitted with two-component Hill equations; all others, with one-component Hill equations. (E and F) 24-h, variable incubation temperatures. The (replotted) curves at 4 and 37°C are those in A–D. Half-competition and Hill-coefficient values estimated from assays incubated at 37°C for 24 or 48 h are shown in Table 1.
Figure 8.
Figure 8.
Temperature dependence of experimental competition concentration–response curves for choline, nicotine, and DHβE on the human α7-AChR. The three curves at 4°C were best fitted with two-component Hill equations; the three curves at 37°C, with one-component Hill equations. The fixed concentration of unbound [125I]-α-BgTx was approximately equal to the toxin’s half-saturation concentration (Fig. 6 A and Table 1). The number of independent competition assays contributing to each plotted curve is indicated in parentheses in the corresponding figure caption; errors were calculated only when the latter was >2. Error bars (±1 SEM) smaller than the size of the symbols were omitted. The concentration of unlabeled ligand (on the x axes) corresponds to the total (bound plus unbound) concentration. Under the low ligand-depletion conditions of our experiments, this concentration was deemed to be a good approximation for the concentration of unbound unlabeled ligand at equilibrium. (A) Choline, an agonist. (B) Nicotine, an agonist. (C) DHβE, an extremely weak agonist. Half-competition and Hill-coefficient values estimated from assays incubated at 37°C for 24 h are shown in Table 1.
Figure 9.
Figure 9.
Structures of orthosteric ligands used or discussed in this work. Protonatable nitrogen atoms are shown in their deprotonated state.
Figure 10.
Figure 10.
Experimental competition concentration–response curves from individual assays and the concentration of unbound [125I]-α-BgTx. The receptor was the human α7-AChR. Upon completion of the incubation period (here, 24 h at 37°C for all panels), cell-bound [125I]-α-BgTx was physically separated from unbound [125I]-α-BgTx by centrifugation. The (normalized) radioactivity associated with bound toxin (circles) was plotted on the left y axes, whereas that associated with unbound toxin (triangles), expressed in concentration units, was plotted on the right y axes. The concentration of unbound [125I]-α-BgTx was approximately equal to the toxin’s half-saturation concentration (Fig. 6 A and Table 1) throughout the curves. The concentration of unlabeled ligand (on the x axes) corresponds to the total (bound plus unbound) concentration. Under the low ligand-depletion conditions of our experiments, this concentration was deemed to be a good approximation for the concentration of unbound unlabeled ligand at equilibrium. (A) MLA. (B) DHβE. (C) Carbamylcholine. (D) Choline. In A and C, different colors represent different individual assays.
Figure 11.
Figure 11.
Predicted effects of positive or negative cooperativity of binding on the competition between a labeled inverse agonist and an unlabeled antagonist. The curves were calculated using the reaction scheme in Fig. 1 assuming independence of sites (in black) or the occurrence of different degrees of deviations from it (cooperativity). Cooperativity was assumed to be caused by, and to only affect, the binding of unlabeled ligand; binding of the labeled ligand, on the other hand, was assumed to neither cause nor be affected by these departures from independence. Furthermore, cooperativity was assumed to be weak; it was only strong enough to make the (reciprocal of the) affinity of the tetra-liganded channel for the fifth molecule of antagonist appreciably different from 5 × KDA,closed, that is, the value expected from independence of five identical sites. Also, for the sake of simplicity, cooperativity was assumed to affect the affinities of the closed and open states by the same factor. The parameters used for these calculations were: KCO = 10−7; KDA,closed = KDA,open = 1 μM; KDB,closed = 1 nM; and KDB,open = 4 nM. The principle of detailed balance was applied to calculate the gating equilibrium constants of the channel in its different ligation states (Eq. 6). The fixed concentration of unbound labeled ligand was set to be equal to its calculated half-saturation concentration. The extent to which the affinity of the receptor bound to four molecules of unlabeled ligand for a fifth molecule of unlabeled ligand differs from the value expected from independence is indicated for each curve as the dissociation equilibrium constant of the fully bound, pentaliganded channel. The Hill-coefficient values obtained from the fits of the calculated curves with one-component Hill equations are also indicated. The concentration of unlabeled ligand (on the x axis) corresponds to the concentration of unbound unlabeled ligand at equilibrium.
Figure S4.
Figure S4.
Global fitting of binding-competition concentration–response curves. The following panels illustrate the process of curve fitting used in this paper. As an example, we use here the curves obtained with nicotine as the competing unlabeled ligand acting on the human α7-AChR. (A–C) Individual competition curves. A separate transfection and a different cell passage was used to generate each individual curve. Each curve consisted of 12 different concentrations of (unlabeled) nicotine competing against approximately the same fixed concentration of unbound [125I]-α-BgTx (∼1 nM). Each concentration of nicotine was assayed twice per curve, in separate binding-competition reactions; black circles correspond to the 24 individual reactions, whereas red (A), orange (B), and cyan (C) circles correspond to their averages at each concentration. The curves were fitted with a Hill equation that, in the case of nicotine incubated at 37°C for 24 h, only required a single component: Activity/protein mass=y11+Unlabeled ligandConcentration1/2nH+y2. Because each curve was generated from an independent receptor preparation (with, inevitably, a somewhat different mean number of receptors per cell) and with radioactive label that had decayed to different extents by the time of each experiment, the maximum values of activity/protein mass (that is, y1 + y2) were expected to be different for each individual curve. Similarly, the minimum values of activity/protein mass (that is, y2), which represent nonspecifically bound toxin per unit of protein mass in each cell pellet, were also expected to vary among separate replicates of the assay. On the other hand, because the three independent assays were deemed to represent the same phenomenon, a single half-competition concentration and a single Hill coefficient were expected from the three datasets. Thus, the three curves were fitted together, simultaneously (globally), by constraining the fit to generate a single value of the half-competition concentration (Concentration1/2) and a single value of the Hill coefficient (nH); the y1 and y2 values, on the other hand, were allowed to be different for each curve (solid lines). The estimates of the half-competition concentration and the Hill coefficient from the global fit were 4.82 ± 0.24 μM and 1.41 ± 0.06, respectively. To address the question of assay-to-assay variability, we also fitted each of the three curves separately. The corresponding estimates of the half-competition concentration and the Hill coefficient were: 5.08 ± 0.04 μM and 1.50 ± 0.001, for the curve in A; 4.33 ± 0.05 μM and 1.28 ± 0.001, for B; and 4.99 ± 0.45 μM and 1.42 ± 0.13, for C. Because the y2 values were typically narrowly defined by the data points, however, whether they were free parameters of the global fit or they were fixed to the values obtained from the separately fitted curves did not make a difference to our conclusions. For all fits, the reciprocal of the y-axis variable was used as weight, and parameter standard errors were computed using the reduced χ2 statistic. (D) For display purposes, each individual curve was normalized between 0 and 1 using the corresponding estimates of y1 and y2. The three normalized values of activity/protein mass (one per individual curve) obtained for each concentration of nicotine were averaged and are displayed as mean ±1 SEM. Error bars smaller than the size of the symbols were omitted.
Figure 12.
Figure 12.
Anomalous features in experimental α-BgTx–agonist competition curves. The receptor was the chicken–C. elegans α7-AChR–β-GluCl chimera, and the incubation temperature was 4°C. The fixed concentration of unbound [125I]-α-BgTx was approximately equal to the toxin’s half-saturation concentration (Fig. 6 C and Table 1). The curve in cyan was best fitted with a two-component Hill equation, whereas that in red was best fitted with a one-component Hill equation with nH = 0.59. The number of independent competition assays contributing to each plotted curve is indicated in parentheses in the corresponding figure caption; errors were calculated only when the latter was >2. Error bars (± 1 SEM) smaller than the size of the symbols were omitted. The concentration of nicotine (on the x axis) corresponds to the total (bound plus unbound) concentration. Under the low ligand-depletion conditions of our experiments, this concentration was deemed to be a good approximation for the concentration of unbound nicotine at equilibrium.
Figure 13.
Figure 13.
Predicted effects of negative cooperativity of binding on the competition between a labeled inverse agonist and an unlabeled agonist. The curves were calculated using the reaction scheme in Fig. 1 assuming independence of sites (in gray) or the occurrence of different degrees of deviations from it (cooperativity). Negative cooperativity was assumed to be caused by, and to only affect, the binding of unlabeled ligand; binding of the labeled ligand, on the other hand, was assumed to neither cause nor be affected by these departures from independence. Also, for the sake of simplicity, cooperativity was assumed to affect the affinities of the closed and open states by the same factor. The parameters used for these calculations were: KCO = 10−7; KDA,closed = 1 μM; KDA,open = 15 nM; KDB,closed = 1 nM; and KDB,open = 4 nM. The principle of detailed balance was applied to calculate the gating equilibrium constants of the channel in its different ligation states (Eq. 6). The fixed concentration of unbound labeled ligand was set to be equal to its calculated half-saturation concentration. The curve in cyan assumes that the affinity of the receptor bound to four molecules of unlabeled ligand for a fifth molecule of unlabeled ligand is lower than that expected from independence by a factor of 105. The curve in blue assumes that the affinity of the receptor bound to four molecules of unlabeled ligand for a fifth molecule of unlabeled ligand is lower than that expected from independence by a factor of 103, whereas the affinity of the receptor bound to three molecules of unlabeled ligand (whether bound to one molecule of labeled ligand or not) for a fourth molecule of unlabeled ligand is lower by a factor of 350. The curve in red assumes that the unlabeled-ligand affinity of the receptor bound to four molecules of unlabeled ligand is lower than that expected from independence by a factor of 103, that of the receptor bound to three molecules of unlabeled ligand is lower by a factor of 10, and that of the receptor bound to two molecules of unlabeled ligand is lower by a factor of 2. For the curves in cyan and blue, negative cooperativity of binding is manifested as a clear second Hill-equation component, whereas for the curve in red, negative cooperativity is manifested as a shallow, single Hill-equation component best fitted with nH < 1. The curve in gray was also best fitted with a single Hill-equation component, but nH > 1. The concentration of unlabeled ligand (on the x axis) corresponds to the concentration of unbound unlabeled ligand at equilibrium.
Figure S5.
Figure S5.
Domain architecture of pLGICs and amino-acid differences between the human and chicken α7-AChR’s ECDs. Structural model of the human α7-AChR bound to the orthosteric agonist epibatidine and the positive allosteric modulator PNU-120596 (PDB accession no. 7KOX; Noviello et al., 2021) displayed in ribbon representation. Blue spheres indicate the positions occupied by the five copies of bound orthosteric ligand. Red spheres indicate the location of the 13 amino-acid residues that differ between the sequences of the human and chicken α7-AChR subunits at the level of the ECD. Inset: ECDs of two adjacent subunits and the position occupied by the orthosteric ligand, at their interface, are emphasized. The molecular images were prepared with visual molecular dynamics (Humphrey et al., 1996).
Figure 14.
Figure 14.
Effects of mutations to the human α7-AChR’s ECD or TMD domains on experimental competition curves. The binding reactions were incubated at 37°C for 24 or 48 h. All curves were best fitted with one-component Hill equations. For each construct, the fixed concentration of unbound [125I]-α-BgTx was approximately equal to the corresponding toxin’s half-saturation concentration (Fig. 6 and Table 1). The number of independent competition assays contributing to each plotted curve is indicated in parentheses in the corresponding figure caption; errors were calculated only when the latter was >2. Error bars (±1 SEM) smaller than the size of the symbols were omitted. The concentration of unlabeled ligand (on the x axes) corresponds to the total (bound plus unbound) concentration. Under the low ligand-depletion conditions of our experiments, this concentration was deemed to be a good approximation for the concentration of unbound unlabeled ligand at equilibrium. (A) MLA. (B) Nicotine. (C) Carbamylcholine. The color code is the same for all panels. The effects of the S56T and S172T ECD mutations on the human–C. elegans α7-AChR–β-GluCl chimera were tested only for MLA. Half-competition and Hill-coefficient values are shown in Table 1.

Comment in

Similar articles

Cited by

References

    1. Bernhard, M., and Laube B.. 2020. Thermophoretic analysis of ligand-specific conformational states of the inhibitory glycine receptor embedded in copolymer nanodiscs. Sci. Rep. 10:16569. 10.1038/s41598-020-73157-2 - DOI - PMC - PubMed
    1. Bertrand, S., Devillers-Thiéry A., Palma E., Buisson B., Edelstein S.J., Corringer P.J., Changeux J.P., and Bertrand D.. 1997. Paradoxical allosteric effects of competitive inhibitors on neuronal alpha7 nicotinic receptor mutants. Neuroreport. 8:3591–3596. 10.1097/00001756-199711100-00034 - DOI - PubMed
    1. Blount, P., and Merlie J.P.. 1989. Molecular basis of the two nonequivalent ligand binding sites of the muscle nicotinic acetylcholine receptor. Neuron. 3:349–357. 10.1016/0896-6273(89)90259-6 - DOI - PubMed
    1. Blount, P., and Merlie J.P.. 1988. Native folding of an acetylcholine receptor alpha subunit expressed in the absence of other receptor subunits. J. Biol. Chem. 263:1072–1080 - PubMed
    1. Chang, Y., and Weiss D.S.. 1999. Channel opening locks agonist onto the GABAC receptor. Nat. Neurosci. 2:219–225. 10.1038/6313 - DOI - PubMed

Publication types