. 2022 Aug;144(2):353-372.
doi: 10.1007/s00401-022-02438-z. Epub 2022 May 25.

Skeletal muscle provides the immunological micro-milieu for specific plasma cells in anti-synthetase syndrome-associated myositis

Affiliations

Skeletal muscle provides the immunological micro-milieu for specific plasma cells in anti-synthetase syndrome-associated myositis

Corinna Preuße et al. Acta Neuropathol. 2022 Aug.

Abstract

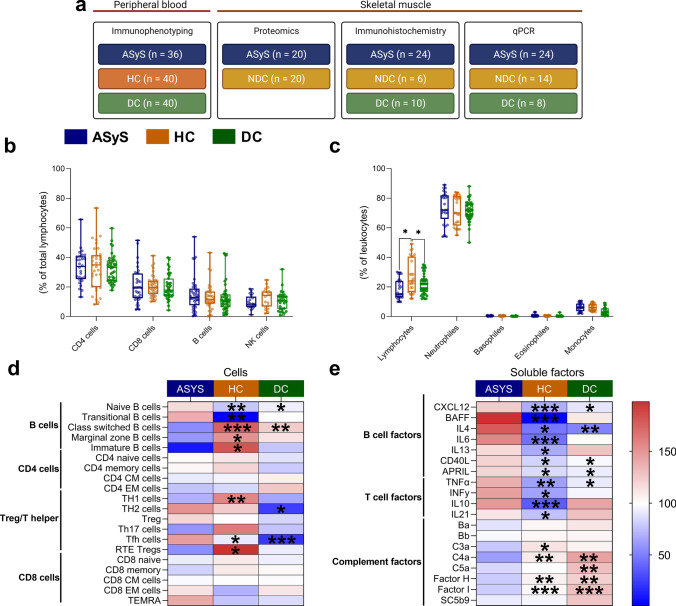
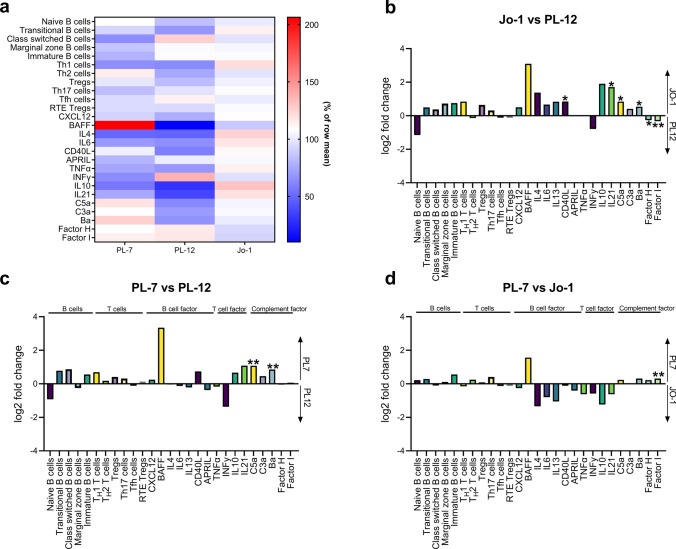
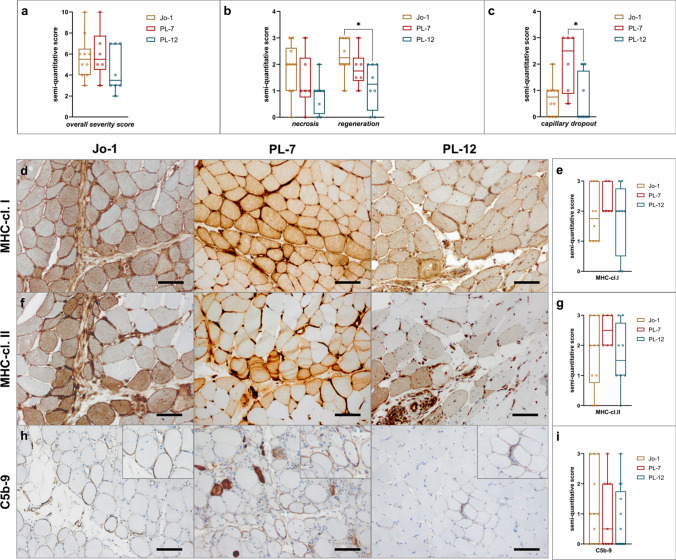
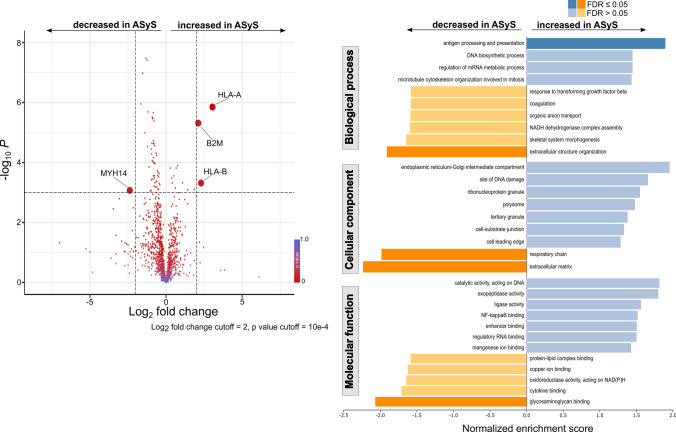
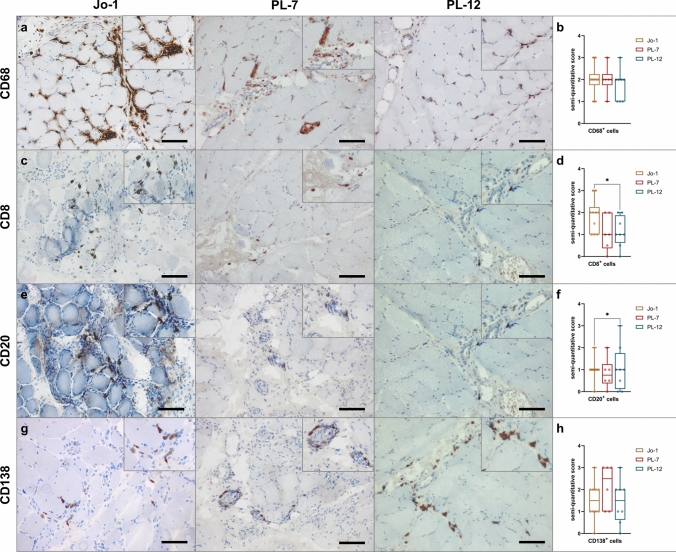
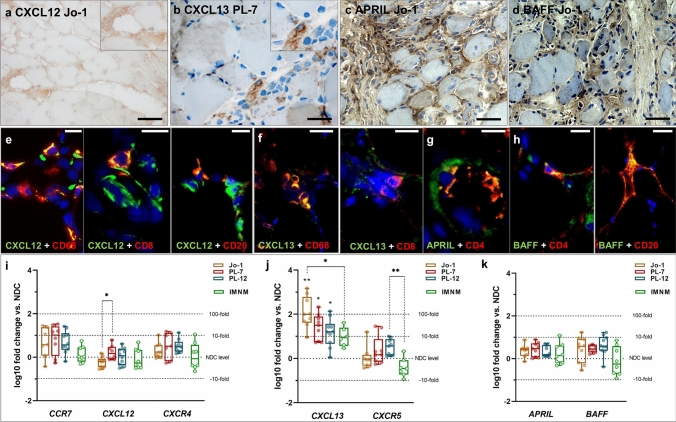
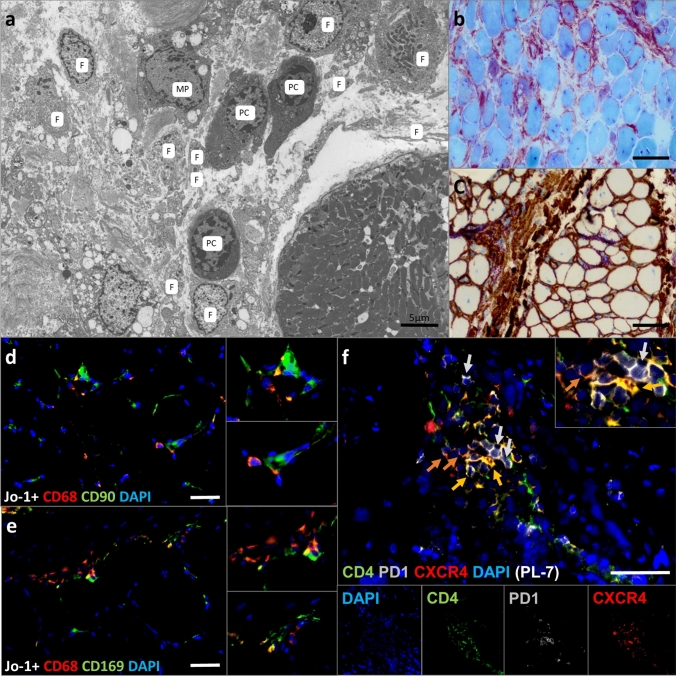
Anti-synthetase syndrome (ASyS)-associated myositis is a major subgroup of the idiopathic inflammatory myopathies (IIM) and is characterized by disease chronicity with musculoskeletal, dermatological and pulmonary manifestations. One of eight autoantibodies against the aminoacyl-transferase RNA synthetases (ARS) is detectable in the serum of affected patients. However, disease-specific therapeutic approaches have not yet been established.To obtain a deeper understanding of the underlying pathogenesis and to identify putative therapeutic targets, we comparatively investigated the most common forms of ASyS associated with anti-PL-7, anti-PL-12 and anti-Jo-1. Our cohort consisted of 80 ASyS patients as well as healthy controls (n = 40), diseased controls (n = 40) and non-diseased controls (n = 20). We detected a reduced extent of necrosis and regeneration in muscle biopsies from PL-12+ patients compared to Jo-1+ patients, while PL-7+ patients had higher capillary dropout in biopsies of skeletal muscle. Aside from these subtle alterations, no significant differences between ASyS subgroups were observed. Interestingly, a tissue-specific subpopulation of CD138+ plasma cells and CXCL12+/CXCL13+CD20+ B cells common to ASyS myositis were identified. These cells were localized in the endomysium associated with alkaline phosphatase+ activated mesenchymal fibroblasts and CD68+MHC-II+CD169+ macrophages. An MHC-I+ and MHC-II+ MxA negative type II interferon-driven milieu of myofiber activation, topographically restricted to the perifascicular area and the adjacent perimysium, as well as perimysial clusters of T follicular helper cells defined an extra-medullary immunological niche for plasma cells and activated B cells. Consistent with this, proteomic analyses of muscle tissues from ASyS patients demonstrated alterations in antigen processing and presentation. In-depth immunological analyses of peripheral blood supported a B-cell/plasma-cell-driven pathology with a shift towards immature B cells, an increase of B-cell-related cytokines and chemokines, and activation of the complement system. We hypothesize that a B-cell-driven pathology with the presence and persistence of a specific subtype of plasma cells in the skeletal muscle is crucially involved in the self-perpetuating chronicity of ASyS myositis. This work provides the conceptual framework for the application of plasma-cell-targeting therapies in ASyS myositis.

Keywords: Anti-synthetase syndrome; Jo-1; PL-12; PL-7; Pathophysiology; Plasma cells.


Conflict of interest statement

The authors report no competing interests.

Figures

Fig. 1
Fig. 1
Immune cell profiling of the peripheral blood from ASyS patients demonstrates predominant alterations in the B cell compartment. Changes to peripheral immune cell subsets analyzed by flow cytometry for the leukocyte compartment (a) and the lymphocyte compartment (b) of ASyS (n = 36), and HC (n = 40) and DC (n = 40). In-depth analysis of the cellular immune compartment was performed by flow cytometry (c). Relative cell numbers were compared between ASyS, HC and DC for the corresponding immune cell compartments. Analysis of soluble factors was performed by bead array and multiplex immunoassay (d). Serum levels of soluble factors were compared between ASyS, NDC and DC as indicated. The heatmap indicates the normalized group mean as color code. Significance is indicated for the comparison ASyS vs. HC and for ASyS vs. DC in each row, respectively. Also see suppl. Figure 1 for detailed comparison of the peripheral immune response. Differences between groups were analyzed using the Kruskal–Wallis test followed by the Bonferroni-Dunn correction for multiple comparisons. *p < 0.05. ASyS  Anti-synthetase syndrome, CM central memory, EM effector memory, NDC non-diseased control, RTE recent thymic emigrates
Fig. 2
Fig. 2
Immune profiles demonstrate subtle differences between serological ASyS subgroups. In-depth immune analyses as performed in Fig. 1 were compared for serological ASyS subgroups: anti-Jo-1+ (n = 22), PL-7+ (n = 8) and PL-12+ (n = 6). Heatmap displaying changes to cellular and soluble factors for serological subgroups (a). Data is displayed as median with normalization to the row mean. Two-sided comparison between subgroups is displayed as bar graph (b, c, d) with log2 fold change of the median on the y-axis. Significant differences between groups are indicated. Differences between groups were analyzed using the Kruskal–Wallis test followed by the Bonferroni-Dunn correction for multiple comparisons. The level of significance was set to p < 0.05. *p < 0.05, **p < 0.01. CM central memory, EM effector memory, RTE recent thymic emigrates
Fig. 3
Fig. 3
Muscle morphological features of ASyS were similar between serological ASyS subgroups. Analysis of skeletal muscle biopsies by immunohistochemistry (a, b, c, e, g, i). Muscle morphology was quantified and compared between subgroups by semi-quantitative score. Muscle biopsies from anti-Jo-1+ (n = 10), PL-7+ (n = 6) and PL-12+ (n = 8) patients were analyzed. Representative muscle biopsies are displayed (d) for C5b-9, MHC-cl. I and MHC-cl. II for serological subgroups. Scale bar 100 µm. Differences between groups were analyzed using the Kruskal–Wallis test followed by the Bonferroni-Dunn correction for multiple comparisons. The level of significance was set to p < 0.05. *p < 0.05. cl. = class
Fig. 4
Fig. 4
Proteomic profiling identifies for enhanced antigen-processing and presentation in skeletal muscle of ASyS patients. Analysis by proteomic profiling of muscle biopsies from ASyS patients (n = 20) and NDC (n = 20) displayed as volcano plot (a). Volcano plots were constructed by calculating the log2 fold change of the median and the -log10 p-value. The log2 fold change and p-value cutoff are indicated. Differentially expressed proteins are bold. Functional pathways were assessed by gene set enrichment analysis for biological processes, cellular components and molecular functions (b). The significance level was set to the FDR-adjusted p < 0.05. Statistical analysis was performed using the Mann–Whitney test (unpaired comparisons). ASyS Anti-synthetase syndrome, NDC  non-diseased control, B2M  beta2-microglobulin, FDR  false discovery rate, HLA  human leukocyte antigen, MYH14  myosin-14
Fig. 5
Fig. 5
Macrophage-rich infiltrates with B cell/plasma cell clusters are characteristic for ASyS-associated myositis. Representative immunohistochemical stains of muscle biopsies from anti-Jo-1+ (n = 10), PL-7+ (n = 6) and PL-12+ (n = 8) patients for CD68, CD8, CD20 and CD138 (a). Scale bar 100 µm. Prominent invasion by CD68+ macrophages and T cells into the perimysium and the adjacent endomysial areas was observed. Muscle morphology was quantified and compared between subgroups by semi-quantitative score. Representative muscle biopsies are displayed (d) for C5b-9, MHC-cl. I and MHC-cl. II for serological subgroups. Scale bar 100 µm. Differences between groups were analyzed using the Kruskal–Wallis test followed by Bonferroni-Dunn correction for multiple comparisons. The level of significance was set to p < 0.05. *p < 0.05. ASyS Anti-synthetase syndrome, NDC non-diseased control
Fig. 6
Fig. 6
B cell homing and transcription factors constitute a pro-inflammatory micro milieu in ASyS patients’ skeletal muscle. Representative stains of muscle biopsies from ASyS patients with corresponding serological status. Monocytic cells in the inflammatory infiltrate of the skeletal muscles in ASyS express CXCL12 (a), CXCL13 (b) APRIL (c) and BAFF (d). Scale bar 100 µm. Immunohistological co-stains for immune cells with CXCL12 (e), CXCL13 (f), APRIL (g) and BAFF (h) are displayed as representative pictures, scale bar 25 µm. CXCL12 is co-expressed in CD68+ macrophages, CD8+ T cells and CD20+ B cells, while CXCL13 is co-expressed in CD68+ macrophages and CD8+ T cells. Additionally, CD4+ T cells express APRIL and BAFF, which are also found in CD20+ B cells. Analysis of gene expression of CCR7, CXCL12 and CXCR4 (i), CXCL13 and CXCL5 (j), as well as APRIL and BAFF (k) are displayed as box-plot indicating the log10 fold change of ASyS compared to NDC for corresponding serological groups, as well as in IMNM patients, which serve as the disease control (DC) group (i, j, k). Significant differences comparing ASyS or DC with NDC are indicated by the corresponding p-value above each plot. Significant differences between serological groups is indicated by the corresponding p-value connecting groups by dotted lines. The Kruskal–Wallis one-way analysis of variance with Dunn’s multiple comparison test was used. The level of significance was set to p < 0.05. *p < 0.05, **p < 0.01, ***p < 0.001. ASyS  Anti-synthetase syndrome, DC  disease control, IMNM  immune-mediated necrotizing myopathy, NDC  non-diseased control
Fig. 7
Fig. 7
Electron microscopy dissects the plasma cell micro milieu in ASyS patients. Representative electron microscopy (EM) from the perimysial area of a muscle fascicle displays the composition of the immunological micro milieu with plasma cells (P), fibroblasts (F) and a putative macrophage (MP) (a). Scale bar 5 µm. Light microscopic imaging reveals AP-positive areas (red/purple) probably due to presence of activated CD90+ fibroblasts (brown) in muscle of ASyS patients (b, c). Scale bar 100 µm. Representative immunofluorescence microscopic images display CD90+ fibroblasts in close proximity to CD68+ macrophages (d). Individual macrophages also stain positive for CD169/Siglec1+ (e). Additionally, CD4+CXCR4+ T cells (yellow), as well as CD4+PD1+CXCR4+ Tfh cells (orange) are found in these areas (f). Scale bar a = 5 µm, b, c = 50 µm, df = 25 µm

References

    1. Aggarwal R, Bandos A, Reed AM, Ascherman DP, Barohn RJ, Feldman BM, Miller FW, Rider LG, Harris-Love MO, Levesque MC, Oddis CV, RIM Study Group Predictors of clinical improvement in rituximab-treated refractory adult and juvenile dermatomyositis and adult polymyositis. Arthritis Rheumatol Hoboken NJ. 2014;66:740–749. doi: 10.1002/art.38270. - DOI - PMC - PubMed
    1. Aggarwal R, Oddis CV, Goudeau D, Koontz D, Qi Z, Reed AM, Ascherman DP, Levesque MC. Autoantibody levels in myositis patients correlate with clinical response during B cell depletion with rituximab. Rheumatology. 2016;55:991–999. doi: 10.1093/rheumatology/kev444. - DOI - PMC - PubMed
    1. Allenbach Y, Benveniste O, Goebel H, Stenzel W. Integrated classification of inflammatory myopathies. Neuropathol Appl Neurobiol. 2017 doi: 10.1111/nan.12380. - DOI - PubMed
    1. Allenbach Y, Hervier B, Stenzel W, Benveniste O. Reply: Perifascicular necrosis in anti-synthetase syndrome beyond anti-Jo-1. Brain. 2016;139:e51. doi: 10.1093/brain/aww126. - DOI - PubMed
    1. Allenbach Y, Mammen AL, Benveniste O, Stenzel W, Group on behalf of the I-MNMW 224th ENMC International Workshop: Clinico-sero-pathological classification of immune-mediated necrotizing myopathies. Neuromuscul Disord. 2018;28:87–99. doi: 10.1016/j.nmd.2017.09.016. - DOI - PubMed

Publication types