

Historical Redlining Impacts Contemporary Environmental and Asthma-related Outcomes in Black Adults
- PMID: 35612914
- PMCID: PMC9799280
- DOI: 10.1164/rccm.202112-2707OC
Historical Redlining Impacts Contemporary Environmental and Asthma-related Outcomes in Black Adults
Abstract
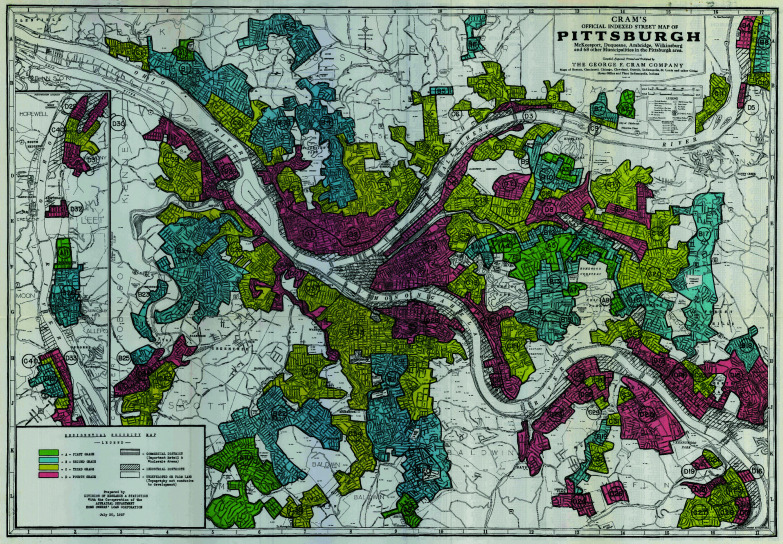
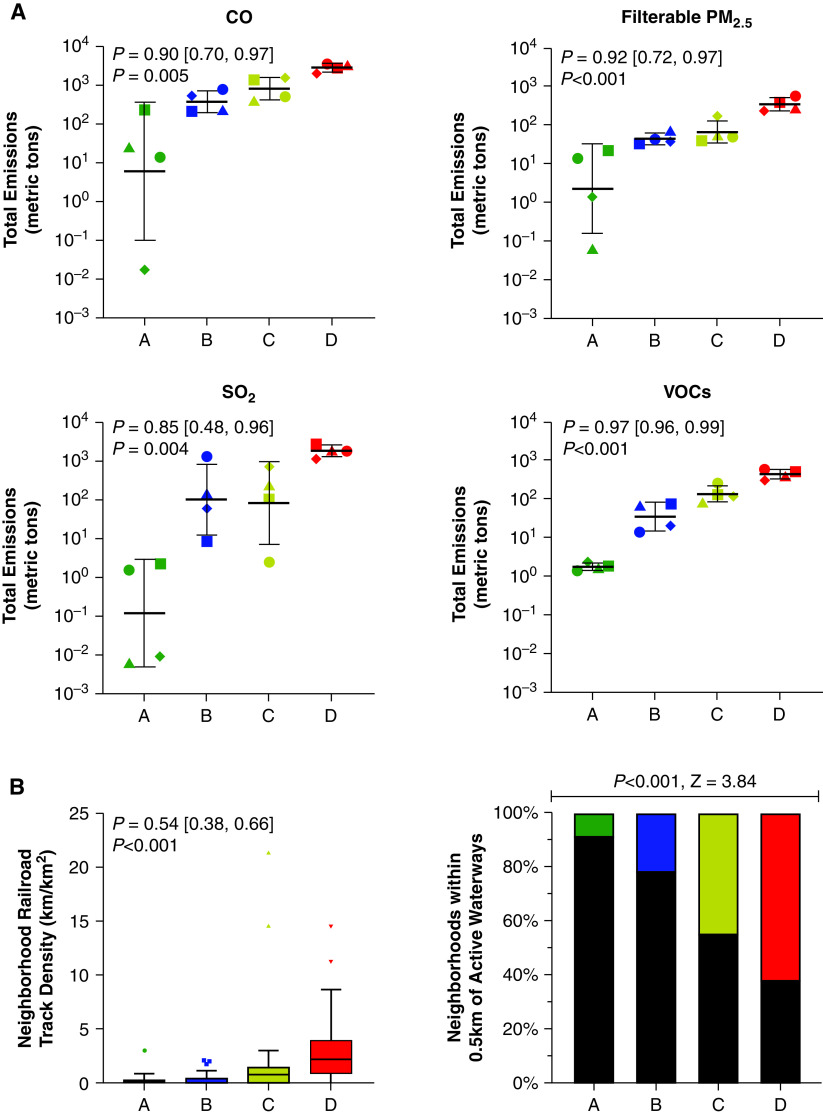
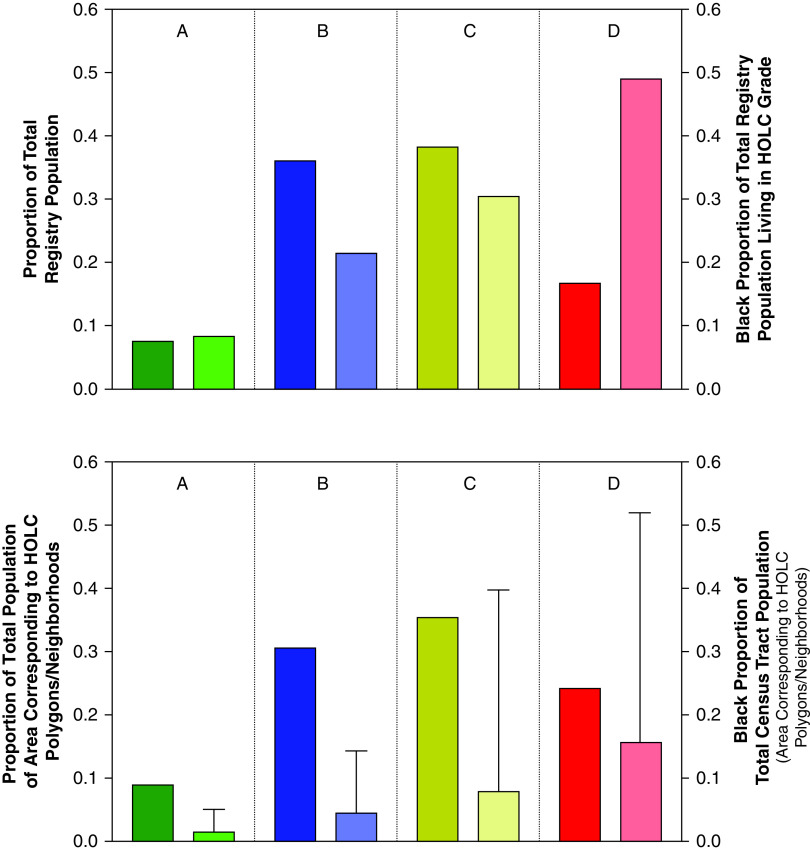
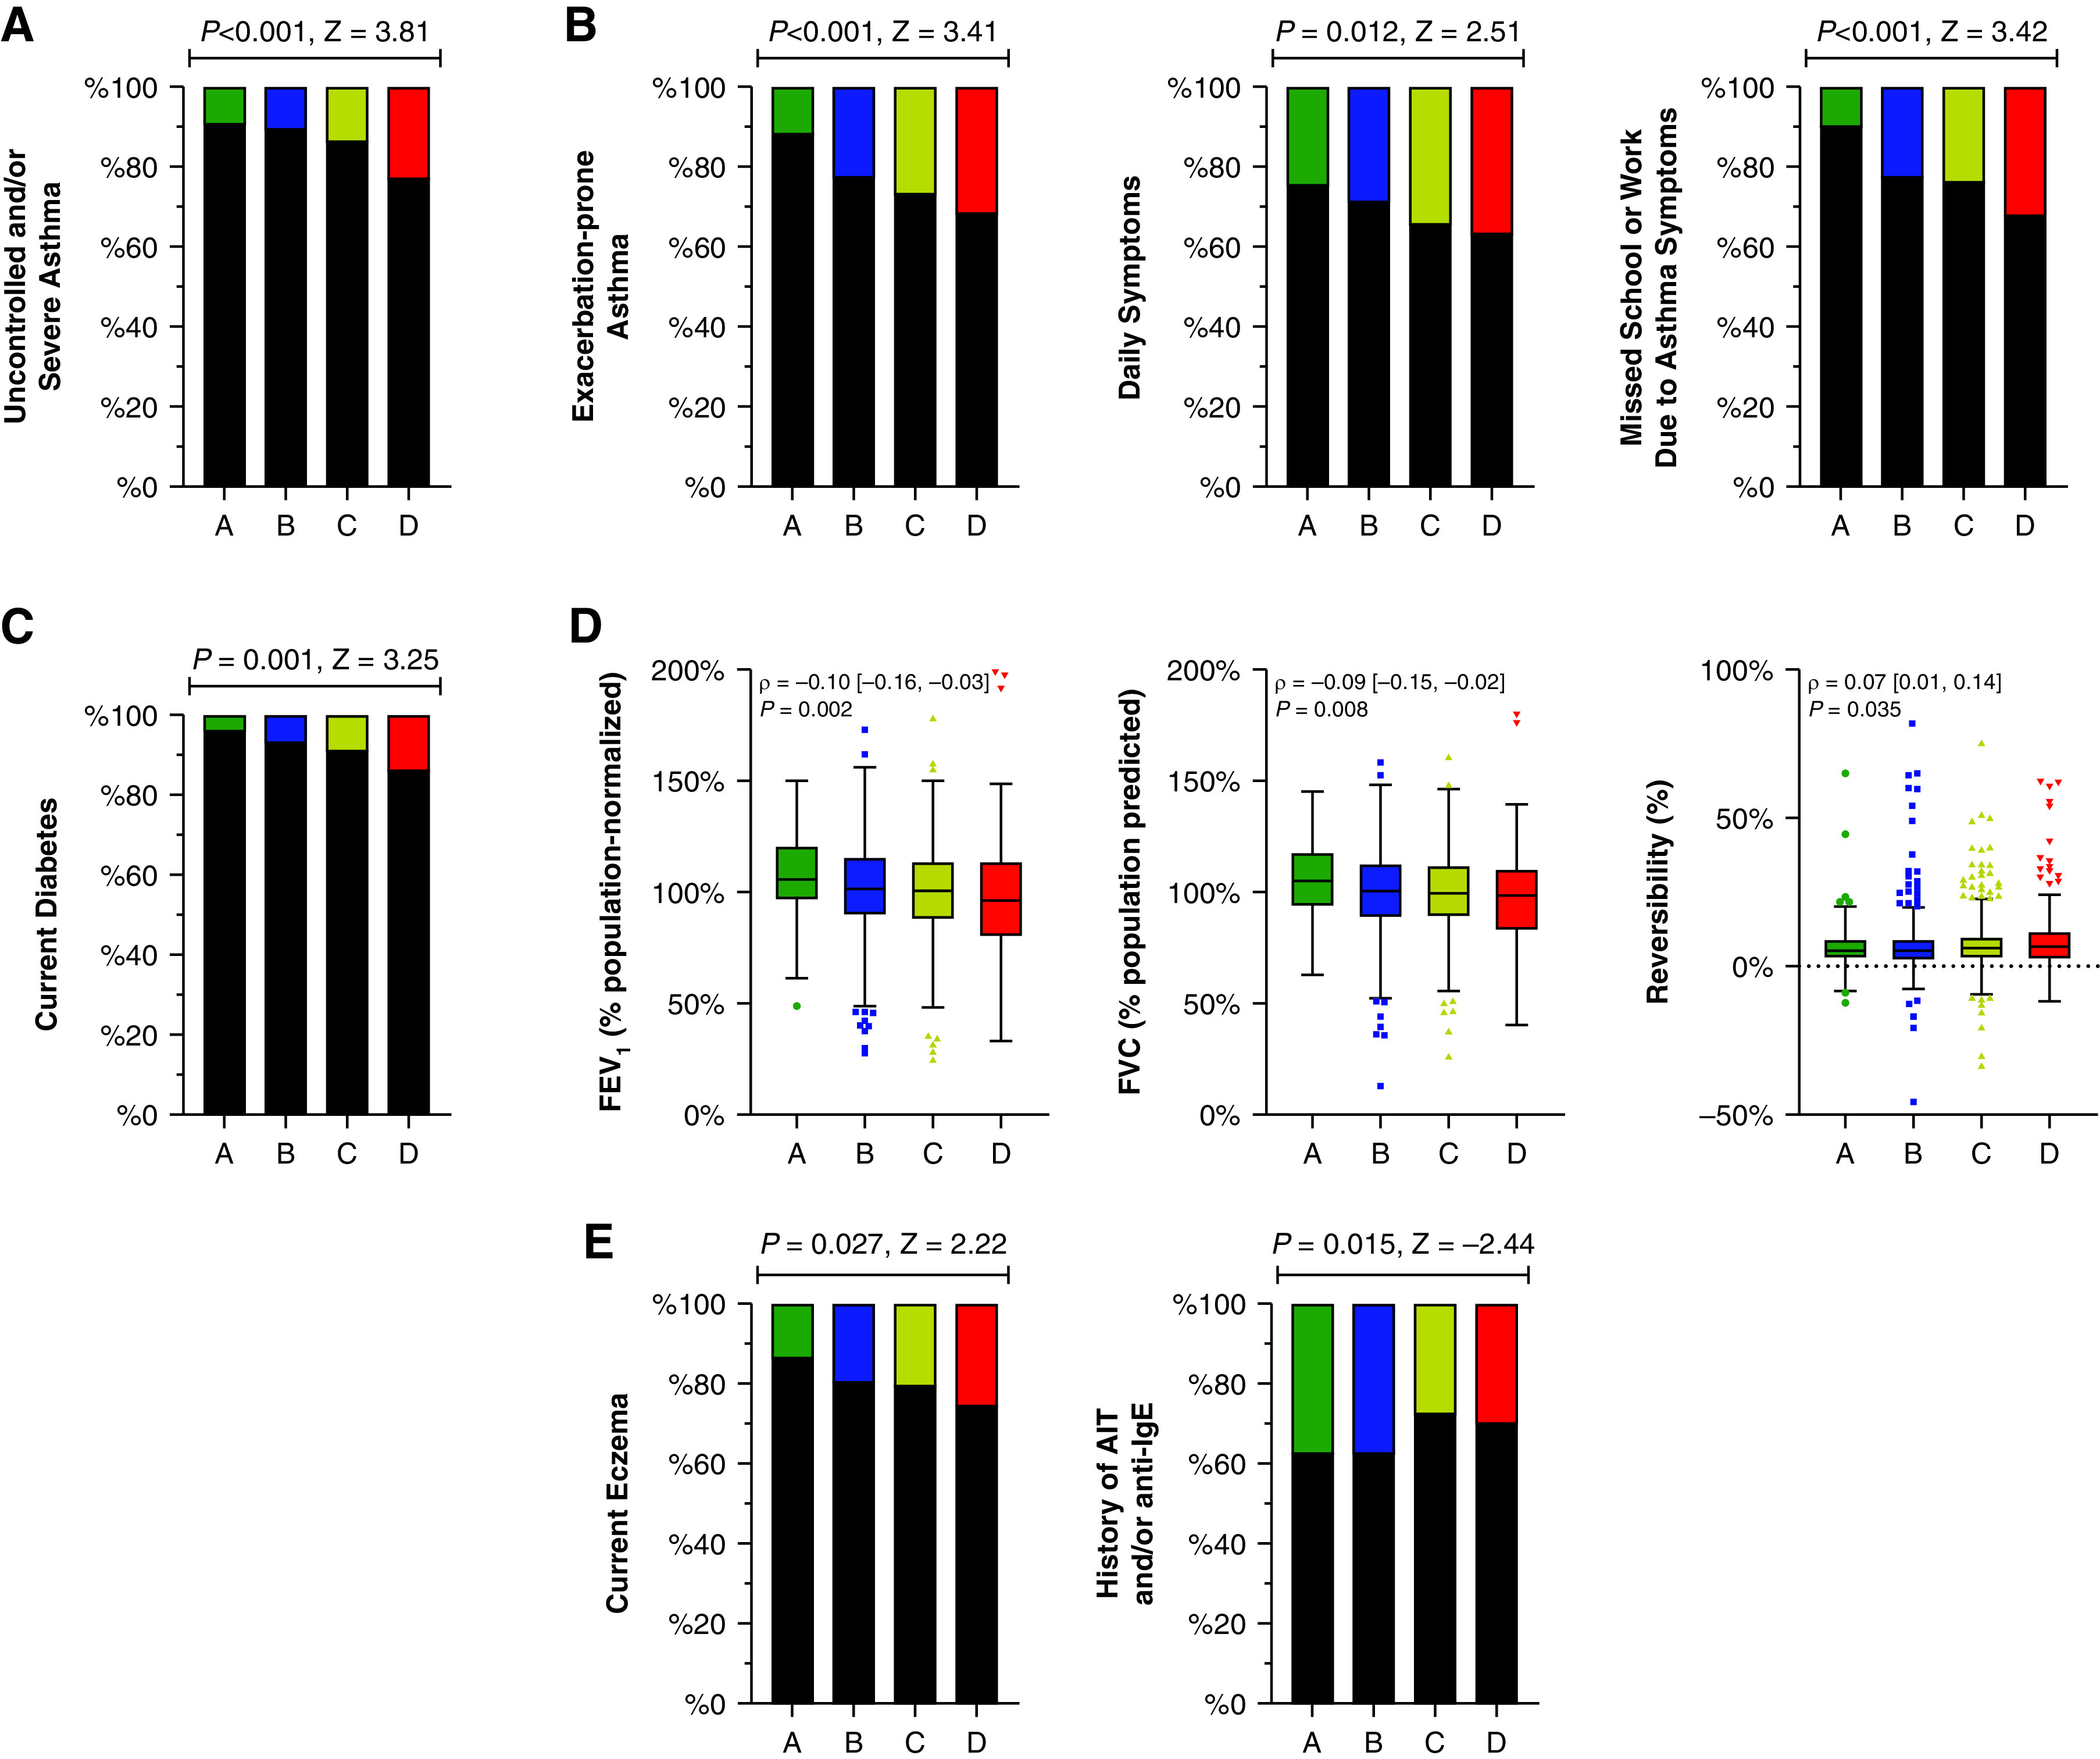
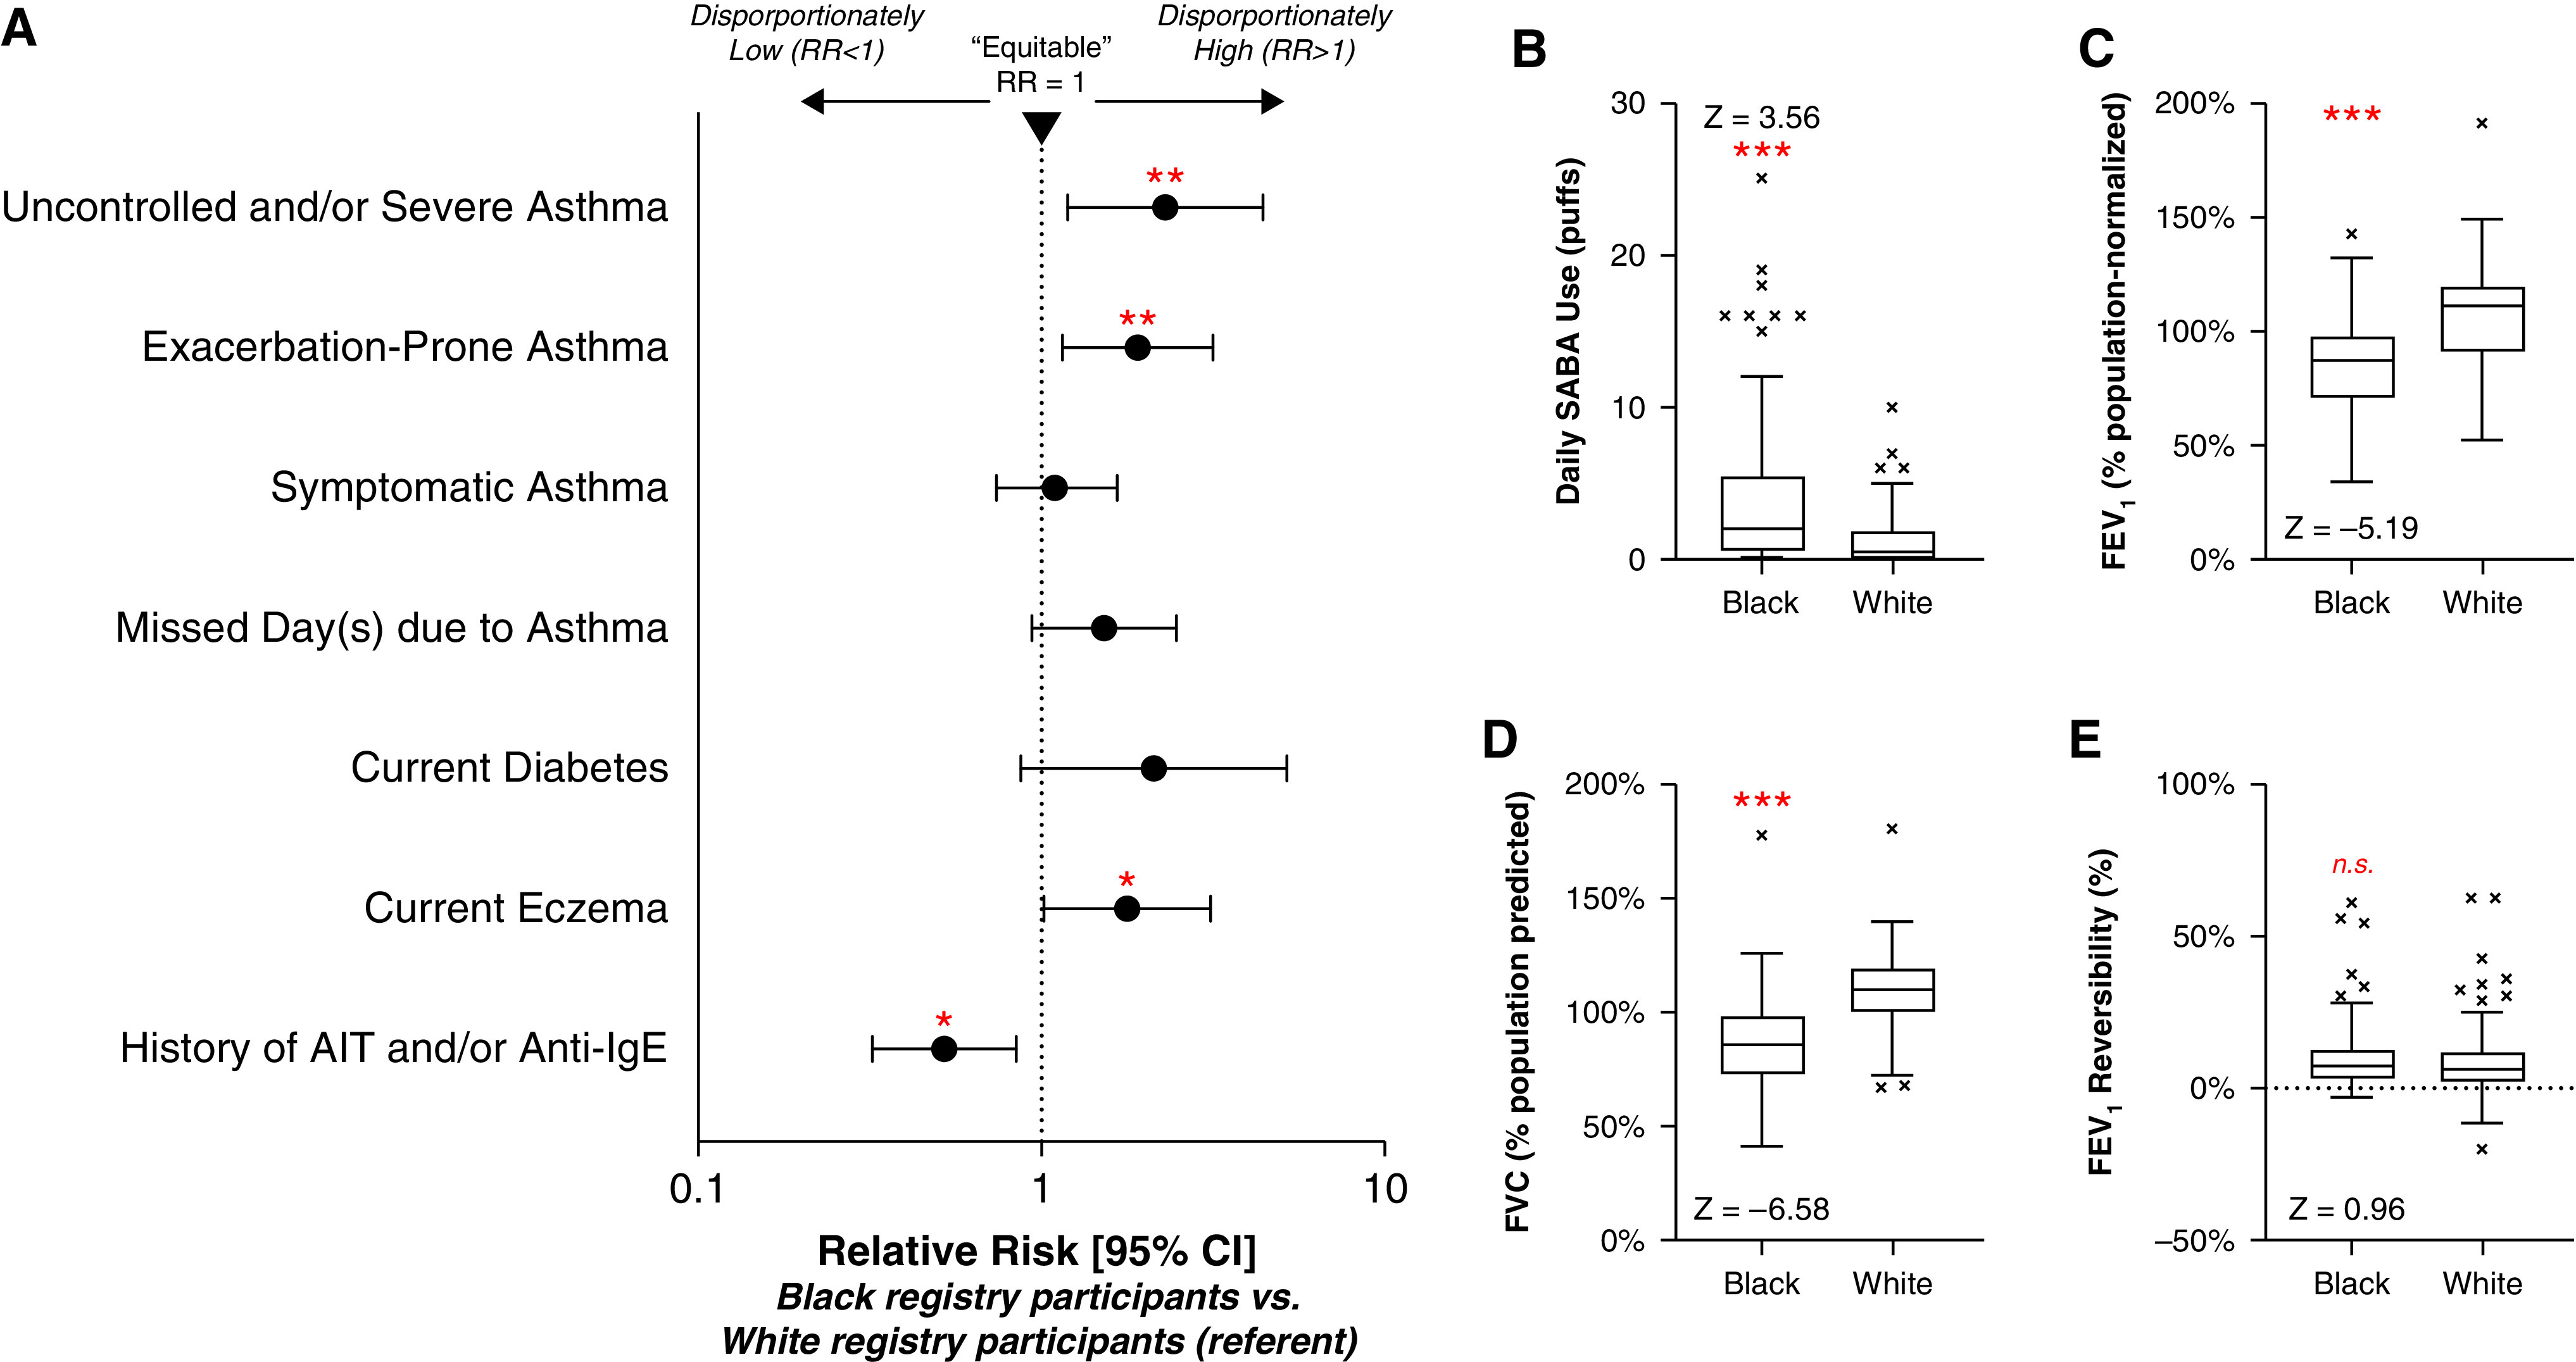
Rationale: Environmental threats and poorly controlled asthma disproportionately burden Black people. Some have attributed this to socioeconomic or biologic factors; however, racism, specifically historical redlining, a U.S. discriminatory mortgage lending practice in existence between the 1930s and the 1970s, may have actuated and then perpetuated poor asthma-related outcomes. Objectives: To link historical redlining (institutional racism) to contemporary environmental quality- and lung health-related racial inequity. Methods: Leveraging a broadly recruited asthma registry, we geocoded 1,034 registry participants from Pittsburgh/Allegheny County, Pennsylvania, to neighborhoods subjected to historical redlining, as defined by a 1930s Home Owners' Loan Corporation (HOLC) map. Individual-level clinical/physiologic data, residential air pollution, demographics, and socioeconomic factors provided detailed characterization. We determined the prevalence of uncontrolled and/or severe asthma and other asthma-related outcomes by HOLC (neighborhood) grade (A-D). We performed a stratified analysis by self-identified race to assess the distribution of environmental and asthma risk within each HOLC grade. Measurements and Main Results: The registry sampling overall reflected Allegheny County neighborhood populations. The emissions of carbon monoxide, filterable particulate matter <2.5 μm, sulfur dioxide, and volatile organic compounds increased across HOLC grades (all P ⩽ 0.004), with grade D neighborhoods encumbered by the highest levels. The persistent, dispersive socioenvironmental burden peripherally extending from grade D neighborhoods, including racialized access to healthy environments (structural racism), supported a long-term impact of historical/HOLC redlining. The worst asthma-related outcomes, including uncontrolled and/or severe asthma (P < 0.001; Z = 3.81), and evidence for delivery of suboptimal asthma care occurred among registry participants from grade D neighborhoods. Furthermore, elevated exposure to filterable particulate matter <2.5 μm, sulfur dioxide, and volatile organic compound emissions (all P < 0.050) and risk of uncontrolled and/or severe asthma (relative risk [95% confidence interval], 2.30 [1.19, 4.43]; P = 0.009) demonstrated inequitable distributions within grade D neighborhood boundaries, disproportionately burdening Black registry participants. Conclusions: The racist practice of historical/HOLC redlining profoundly contributes to long-term environmental and asthma-related inequities in Black adults. Acknowledging the role racism has in these outcomes should empower more specific and novel interventions targeted at reversing these structural issues.
Keywords: asthma; environment; pollution; racism; redlining.
Figures
Comment in
-
When Health Disparities Hit Home: Redlining Practices, Air Pollution, and Asthma.Am J Respir Crit Care Med. 2022 Oct 1;206(7):803-804. doi: 10.1164/rccm.202206-1063ED. Am J Respir Crit Care Med. 2022. PMID: 35696342 Free PMC article. No abstract available.
References
-
- Fleischman L, Franklin M.2017.
-
- United Church of Christ. 1987.
