. 2022 May 31;119(22):e2201355119.
doi: 10.1073/pnas.2201355119. Epub 2022 May 25.

Thalamocortical axons regulate neurogenesis and laminar fates in the early sensory cortex

Affiliations

Thalamocortical axons regulate neurogenesis and laminar fates in the early sensory cortex

Timothy Monko et al. Proc Natl Acad Sci U S A. .

Abstract

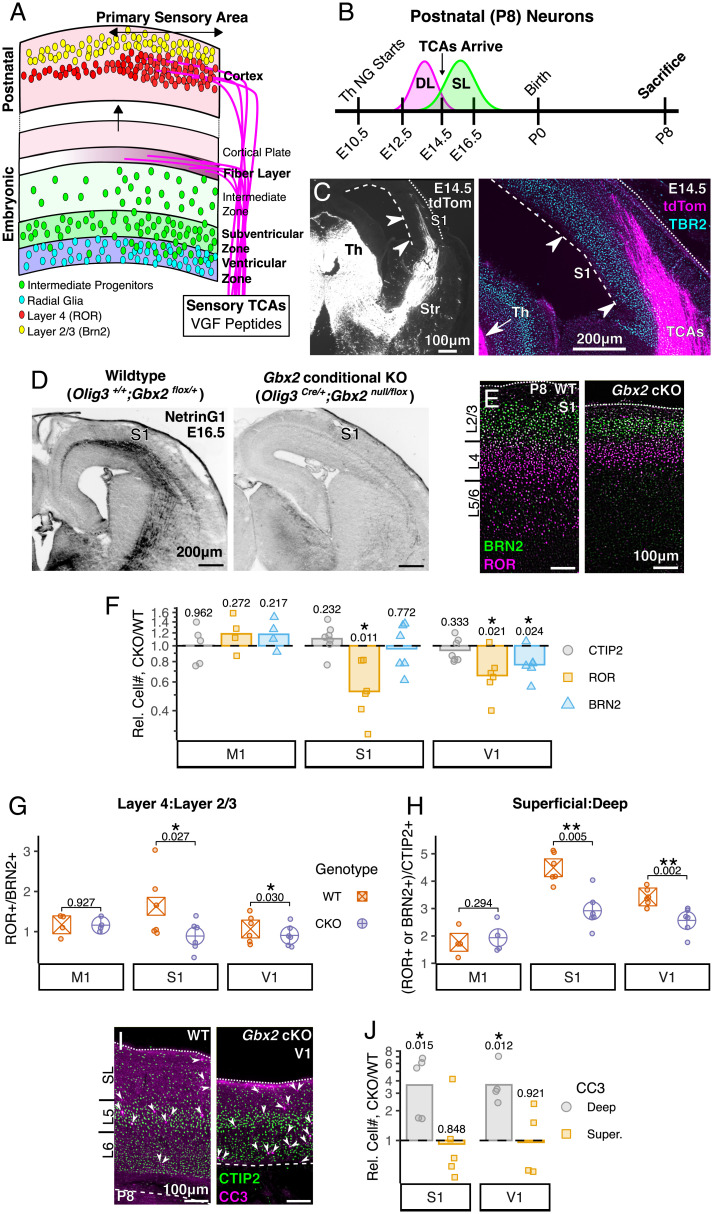
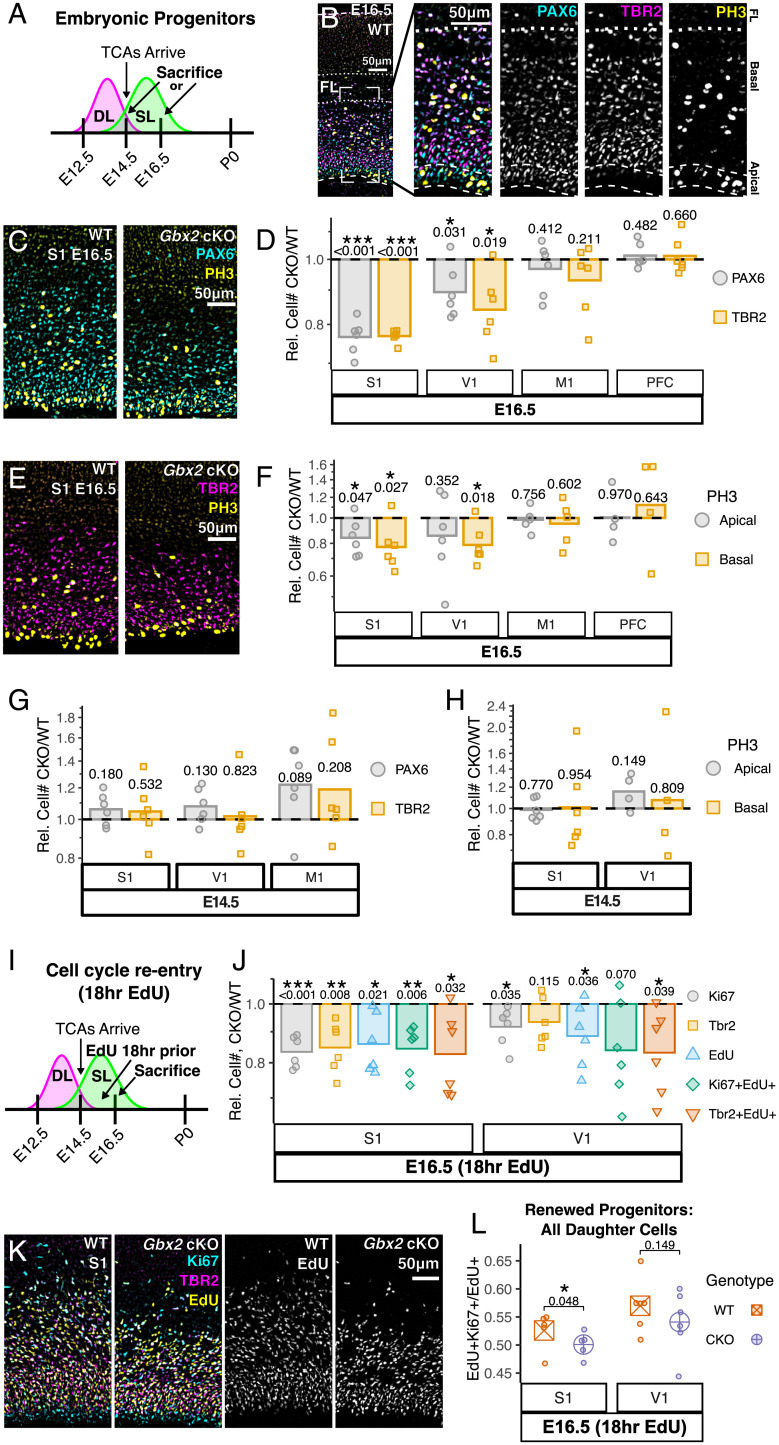
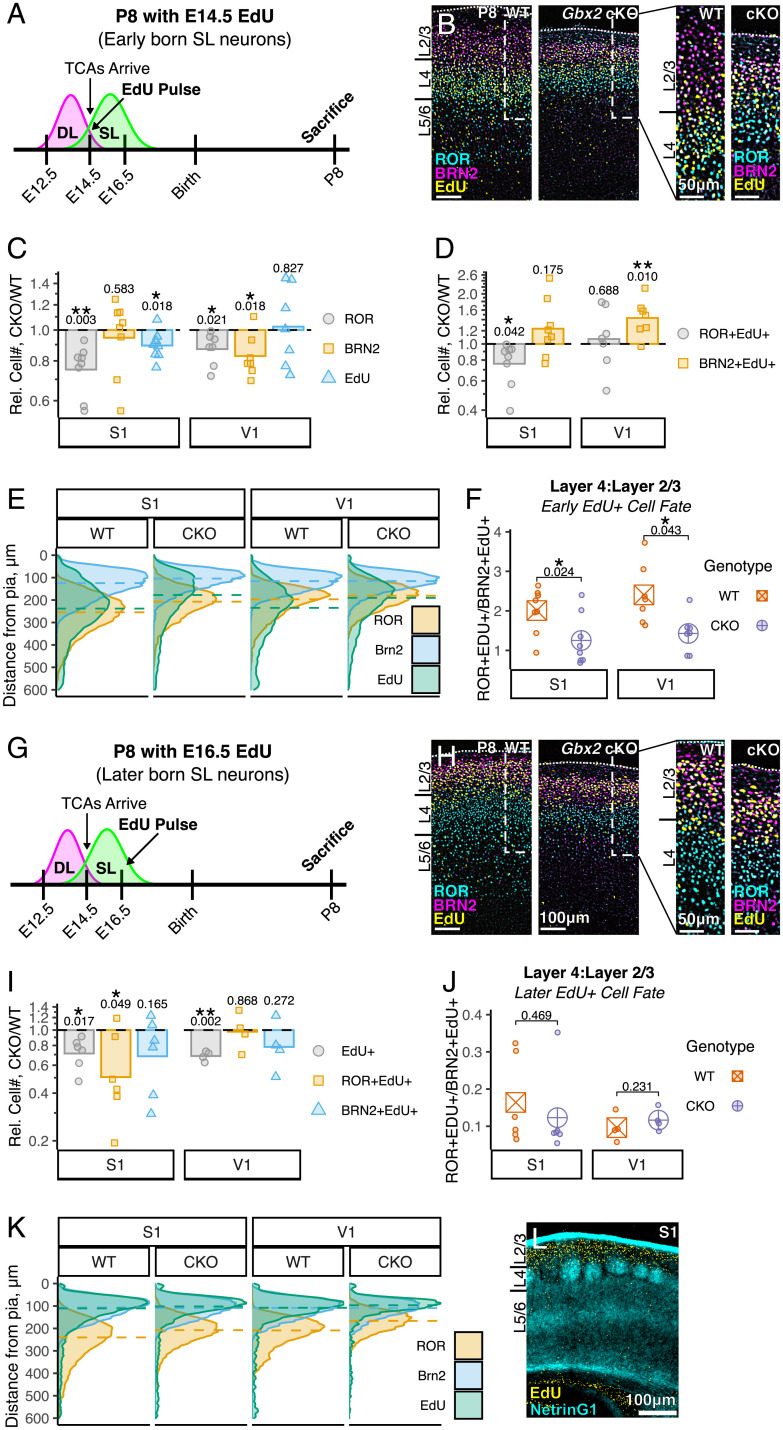
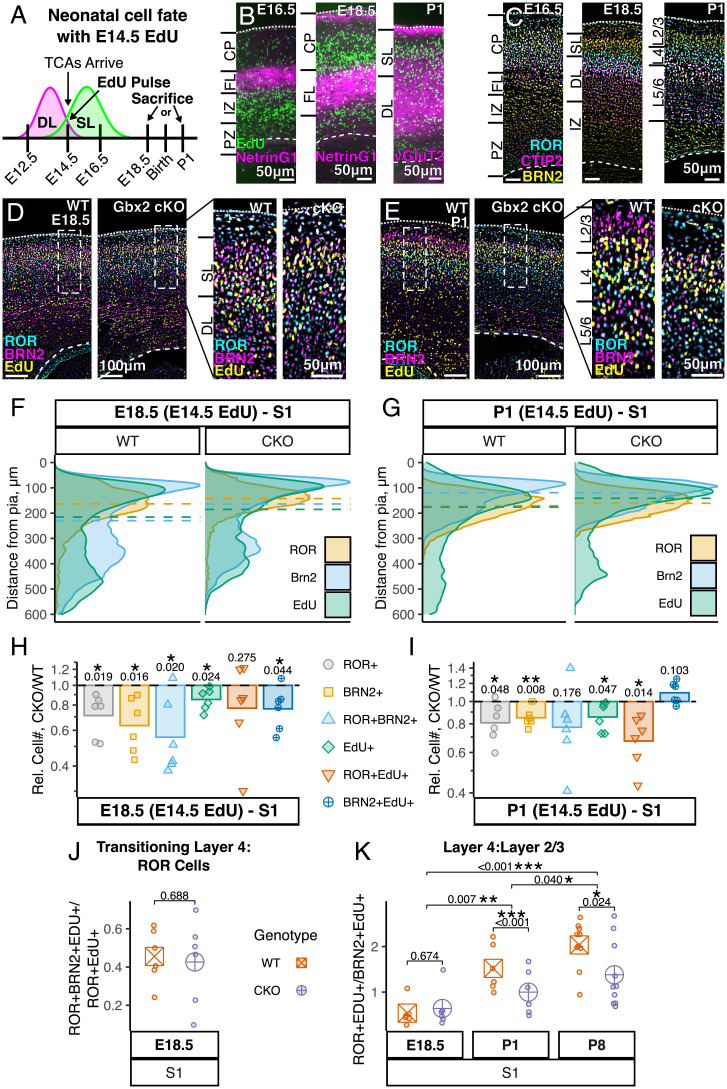
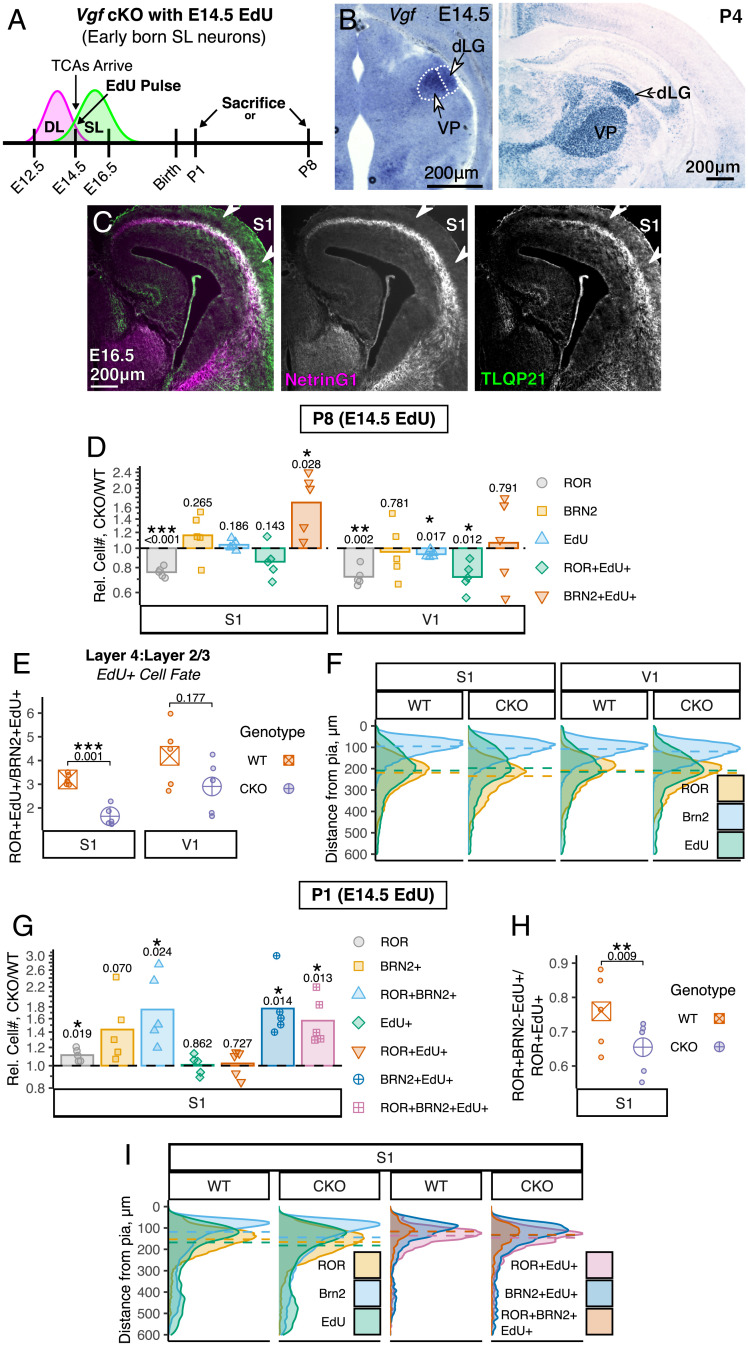
Area-specific axonal projections from the mammalian thalamus shape unique cellular organization in target areas in the adult neocortex. How these axons control neurogenesis and early neuronal fate specification is poorly understood. By using mutant mice lacking the majority of thalamocortical axons, we show that these axons are required for the production and specification of the proper number of layer 4 neurons in primary sensory areas by the neonatal stage. Part of these area-specific roles is played by the thalamus-derived molecule, VGF. Our work reveals that extrinsic cues from sensory thalamic projections have an early role in the formation of cortical cytoarchitecture by enhancing the production and specification of layer 4 neurons.

Keywords: cell fate; neocortex; neurogenesis; thalamocortical.


Conflict of interest statement

The authors declare no competing interest.

Figures

Fig. 1.
Fig. 1.
TCAs increase postnatal neuron number in the primary sensory cortex. (A) Schematic summary of our findings; TCAs, including sensory-specific VGF, increase the production of superficial layer neurons and bias their fates toward layer 4. (B) Experimental scheme in relation to the timing of neocortical neurogenesis (DL, deep layer; SL, superficial layer) and arrival of TCAs; Th NG, thalamic neurogenesis. (C) TCAs (tdTomato driven by Olig3Cre) project to the cortex and reside near TBR2+ progenitors in the E14.5 S1 cortex. (D) Comparison of WT and Gbx2 cKO TCAs labeled by NetrinG1 (inverted). At E16.5, NetrinG1+ TCA axons are found throughout the cortex in WT mice, but, in Gbx2 cKO mice, few TCAs reach the cortex. (E) Layer 4 (ROR+) and layers 2/3 (BRN2+) neurons in the S1 cortex in WT and Gbx2 cKO mice. (F) SL neurons are decreased in both S1 (ROR) and V1 (ROR and BRN2) in Gbx2 cKO mice; DL (CTIP2) is unchanged. (G and H) S1 and V1 cortex in Gbx2 cKO mice have decreased ratios of ROR+-to-BRN2+ neurons and SL-to-DL neurons compared with WT controls. (I) CTIP2 (DL) and cleaved caspase 3 (CC3: apoptotic cells) in V1 at P8. (J) CC3+ cells are increased within DLs (bounded by CTIP2+ cells) of Gbx2 cKO mice. Matched ratio t test (F and J) or paired t test (G and H) P values are shown between WT and Gbx2 cKO. For F and J, data are shown as relative difference of Gbx2 cKO to WT littermates (dashed line); points represent individual pairs; bar represents pooled mean. Th, thalamus; Str, striatum. *P < 0.05, **P < 0.01.
Fig. 2.
Fig. 2.
TCAs increase progenitor numbers, divisions, and cell cycle reentry in the primary sensory cortex. (A) Experimental timeline for BH. (B) At E16.5, the S1 WT cortex progenitors—RGs (PAX6), intermediate progenitors (TBR2), and mitotic cells (PH3)—are below TCAs in the fiber layer (FL); apical PH3 are strictly RGs; basal PH3 are PAX6+ and/or TBR2+. (C and D) The number of progenitors is decreased in Gbx2 cKO mice at E16.5 in S1 (TBR2 and PAX6) and V1 (TBR2), but not in the nonsensory cortex M1 (primary motor) or PFC (prefrontal cortex). (E and F) At E16.5, both apical and basal progenitors divide (PH3+) less in Gbx2 cKO S1, and basal progenitors divide less in V1. (G and H) At E14.5 in Gbx2 cKO mice, neither TBR2 or PAX6 is decreased, and both apical and basal cells also divide (PH3+) similarly in S1 and V1. (I) Experimental timeline for JL. (J and K) E16.5 Gbx2 cKO mice have decreased numbers of progenitors (Ki67+ & TBR2+) and fewer cells proceeding through S-phase (EdU+) in both S1 and V1. (L) At E16.5, more progenitors re-enter the cell cycle (EdU+Ki67+) in S1 of WT mice compared with Gbx2 cKO. Matched ratio t test (D, F, G, H, and J) or paired t test (L) P values are shown between WT and Gbx2 cKO. For D, F, G, H, and J, data are shown as relative difference of Gbx2 cKO to WT littermates (dashed line); points represent individual pairs; bar represents pooled mean. *P < 0.05, **P < 0.01, ***P < 0.001. See SI Appendix, Fig. S2 for breakdown of multichannel images.
Fig. 3.
Fig. 3.
TCAs bias early-born superficial layer neurons to become layer 4 instead of layer 2/3. (A) Experimental timeline for BF. (B) Distribution of E14.5-labeled EdU+ cells, ROR+ (layer 4) and BRN2+ (layers 2/3) neurons in S1 at P8. Right shows high magnification views within the dotted lines on Left. (C) Gbx2 cKO reduces EdU in both S1 and V1; EdU-injected WT and Gbx2 cKO have similar changes to the numbers of SL neurons as in noninjected mice in Fig. 1F. (D) Gbx2 cKO reduces ROR+EdU+ cells in S1 and increases Brn2+EdU+ cells in V1. (E) EdU+ cells are positioned deeper in S1 and V1 of WT mice compared with Gbx2 cKO mice. Density curve of distance from pial surface for all cells analyzed in C; dashed line is median distance. (F) WT EdU-labeled SL neurons are biased toward ROR and against BRN2 when compared with Gbx2 cKO. (G) Experimental timeline for HL. (H) E16.5-labeled EdU+ cells with SL neuron markers. (I) EdU+ cells are reduced in Gbx2 cKO in both S1 and V1; ROR+EdU+ cells are decreased in S1 Gbx2 cKO mice. (J) E16.5 EdU-labeled neurons are not biased in cell fate by TCAs; note ratio compared to F. (K and L) In S1, E16.5-labeled EdU cells are positioned superficially, mostly above TCA terminals (NetrinG1) that coalesce in “barrels” in layer 4. Matched ratio t test (C, D, and I) or paired t test (F and J) P values are shown between WT and Gbx2 cKO. For C, D, and I, data are shown as relative difference of Gbx2 cKO to WT littermates (dashed line); points represent individual pairs; bar represents pooled mean. *P < 0.05, **P < 0.01, ***P < 0.001. See SI Appendix, Fig. S3 for breakdown of multichannel images.
Fig. 4.
Fig. 4.
TCAs regulate the acquisition of cell fate in the perinatal neocortex. (A) Experimental timeline; birth, equivalent to E19.5 or P0. (B) Positional relationship between the TCAs and cells labeled by EdU at E14.5 (see SI Appendix, Fig. S4 B, E, and M for Gbx2 cKO). At E16.5, labeled cells are mostly below the fiber layer (FL), which contains TCAs (NetrinG1). At E18.5, EdU+ cells are migrating or have migrated through TCAs (NetrinG1). By P1, most labeled cells are in the cortical plate, and TCAs (vGluT2) have grown to future layer 4. (C) Dynamic changes of ROR expression. At E16.5, ROR is contained in the CTIP2+ layer. At E18.5, ROR still mostly overlaps CTIP2, but a small fraction of ROR+ cells are first found above layer 5. At P1, ROR+ cells form a more distinctive layer between CTIP+ and BRN2+ layers. (D and E) Fate analysis of E14.5 EdU-labeled cells analyzed at E18.5 or P1. At E18.5, in both the WT and cKO cortexes, E14.5-labeled EdU+ cells mostly reside above the layer containing ROR and CTIP2, and express BRN2. At P1, a majority of EdU+ cells are in the layer expressing either ROR (layer 4) or BRN2 (layer 2/3). For both D and E, Right shows high magnification views within the dotted lines on Left. (F and G) Distribution of E14.5 EdU-labeled cells in relation to that of ROR+ and BRN2+ cells at E18.5 or P1. At P1, but not at E18.5, EdU+ cells are positioned more superficially in Gbx2 cKO mice compared with WT littermates. Shown are density curves of distance from pial surface for all cells analyzed in H and I; dashed line, median distance. (H) At E18.5, the number of BRN2+ and ROR+ cells, as well as transitioning ROR+BRN2+ cells, is decreased in Gbx2 cKO mice; EdU+ and BRN2+EdU+ cells are also decreased. (I) At P1, all superficial layer neuron markers (layer 4, ROR; layer 2/3, BRN2), EdU+ cells, and ROR+EdU+ cells are decreased in Gbx2 cKO mice. (J) At E18.5, there is no change in the ratio of E14.5-born transitioning future layer 4 neurons (ROR+BRN2+EdU+) to the total ROR+EdU+ population. (K) The ratio of ROR+EdU+ cells over BRN2+EdU+ cells is not significantly changed in Gbx2 cKO mice at E18.5, but is decreased at P1 and P8. PZ, progenitor zone (including ventricular zone and subventricular zone); IZ, intermediate zone; CP, cortical plate. *P < 0.05, **P < 0.01, ***P < 0.001.
Fig. 5.
Fig. 5.
Thalamus-derived, sensory-specific VGF peptides increase superficial layer neurons and play a role in establishing separate ROR+ and BRN2+ cell populations. (A) Experimental timeline. (B) In situ hybridization for the Vgf mRNA. Principal sensory thalamic nuclei (VP, ventral posterior; dLG, dorsal lateral geniculate) express Vgf. High expression of Vgf remains isolated to sensory nuclei in the postnatal brain. (C) At E16.5, TCAs (NetrinG1) contain high levels of a VGF peptide, TLQP21, in future sensory areas (S1). (D) At P8, Vgf cKO mice injected with EdU at E14.5 have reduced numbers of layer 4 ROR+ neurons in both S1 and V1 compared with WT mice. EdU is slightly decreased in V1 of Vgf cKO mice. Vgf cKO mice have more Brn2+EdU+ cells in S1 and fewer ROR+EdU+ cells in V1. (E) VGF biases E14.5-born neurons to become layer 4 (ROR+) compared to layers 2/3 (BRN2+) in S1, with a trend toward this ratio in V1. (F) Radial distribution of E14.5 EdU+ cells is not different between WT and Vgf cKO mice at P8. Shown are density curves of distance from pial surface for all cells analyzed in D; dashed line, median distance. (G) At P1, Vgf cKO mice have increased ROR+, BRN2+, and ROR+BRN2+ cells as well as more BRN2+EdU+ and ROR+BRN2+EdU+ cells after EdU injection at E14.5. (H) At P1, Vgf cKO mice have fewer E14.5-born (EdU+) ROR+ neurons that transition to fully specified layer 4 (ROR+BRN2) neurons. (I) At P1, EdU, ROR, and BRN2 distribution is not different between WT and Vgf cKO mice. More ROR+BRN2+EdU+ cells are present in Vgf cKO mice, and the increased overlap of ROR+EdU+ and BRN2+EdU+ cells is likely to account for this. Shown are density curves of distance from pial surface for all cells analyzed in G; dashed line, median distance. Matched ratio t test (D and G) or paired t test (E and H) P values shown are between WT and Gbx2 cKO. For D and G, data are shown as relative difference of Gbx2 cKO to WT littermates (dashed line); points represent individual pairs; bar represents pooled mean. *P < 0.05, **P < 0.01, ***P < 0.001. See SI Appendix, Fig. S5 for breakdown of multichannel images.

Similar articles

Cited by

References

    1. McConnell S. K., The determination of neuronal fate in the cerebral cortex. Trends Neurosci. 12, 342–349 (1989). - PubMed
    1. Llorca A., et al. , A stochastic framework of neurogenesis underlies the assembly of neocortical cytoarchitecture. eLife 8, e51381 (2019). - PMC - PubMed
    1. Gao P., et al. , Deterministic progenitor behavior and unitary production of neurons in the neocortex. Cell 159, 775–788 (2014). - PMC - PubMed
    1. Oberst P., et al. , Temporal plasticity of apical progenitors in the developing mouse neocortex. Nature 573, 370–374 (2019). - PubMed
    1. Peters A., Jones E. G., Cerebral Cortex: Cellular Components of the Cerebral Cortex (Springer, 1984).

Publication types