. 2022 May 27;8(21):eabn3783.
doi: 10.1126/sciadv.abn3783. Epub 2022 May 25.

The dynamic atmospheric and aeolian environment of Jezero crater, Mars

Affiliations

The dynamic atmospheric and aeolian environment of Jezero crater, Mars

Claire E Newman et al. Sci Adv. .

Erratum in

Abstract

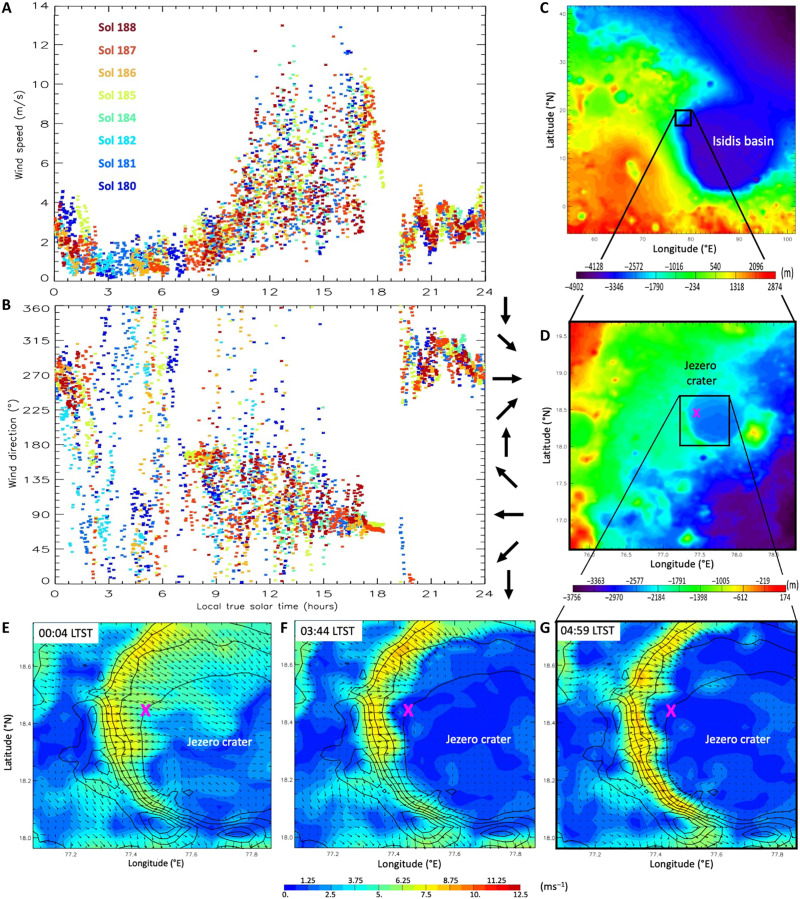
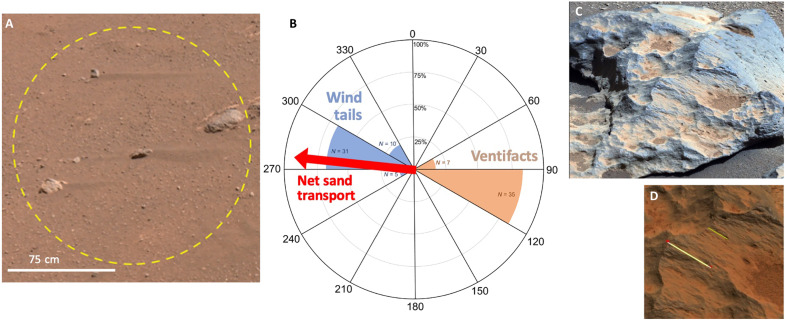
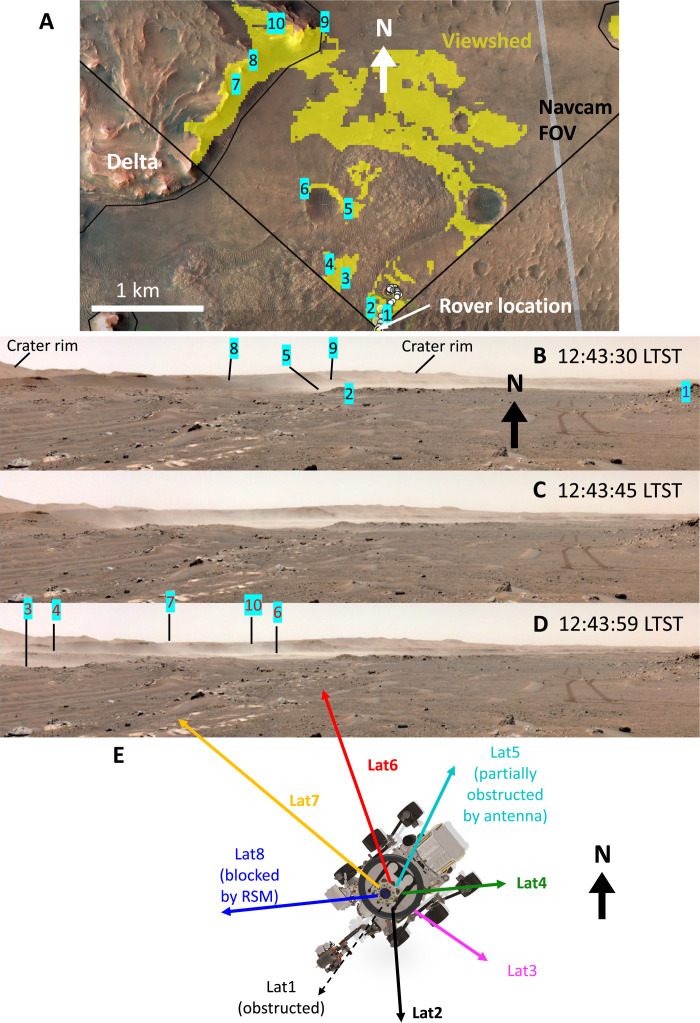
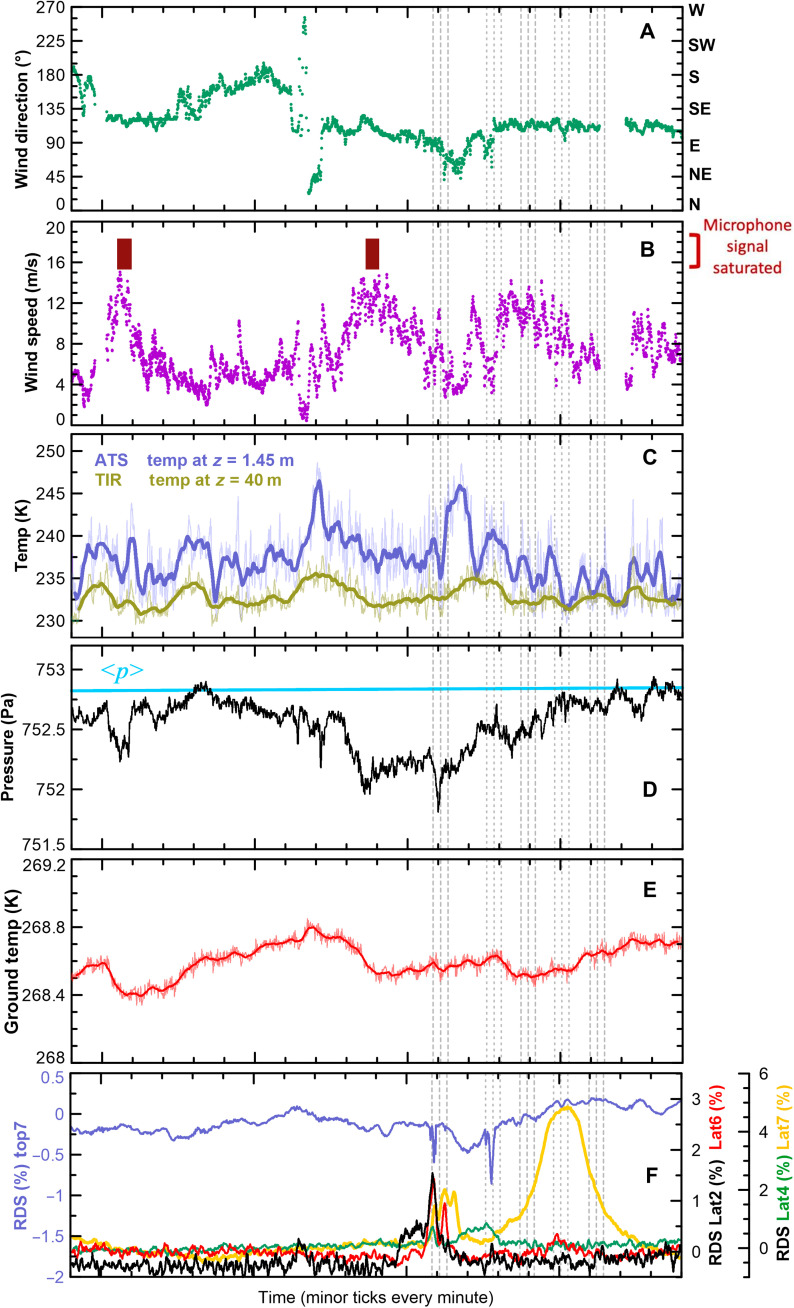
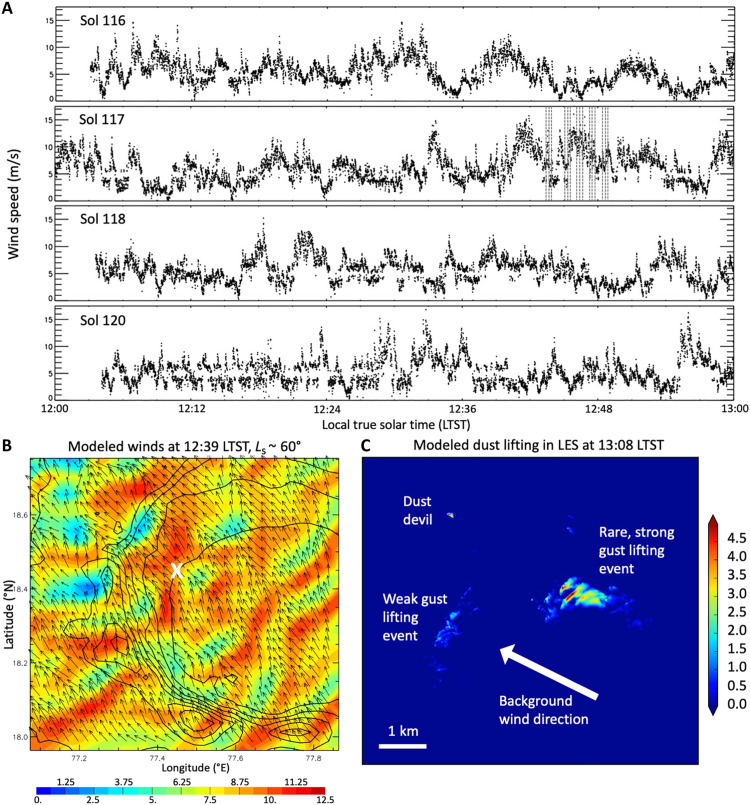
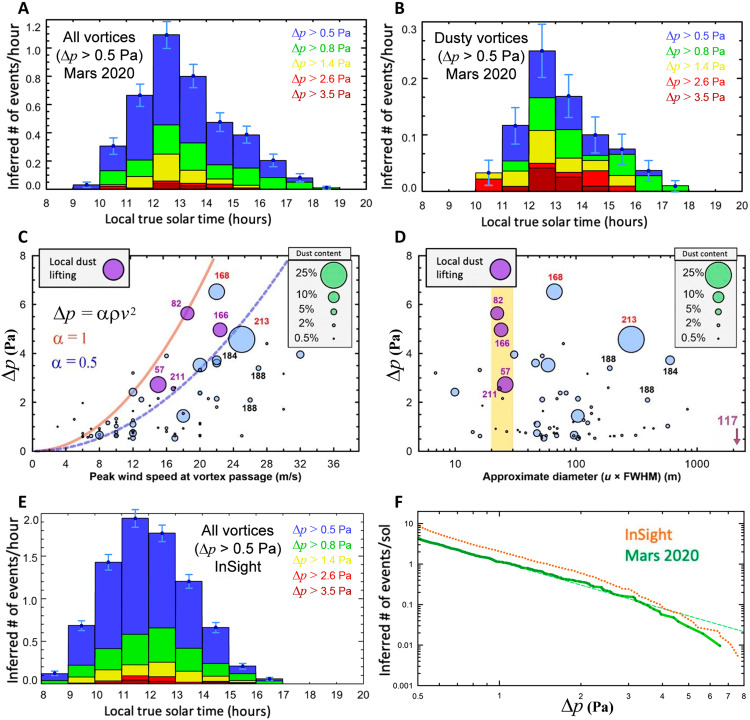
Despite the importance of sand and dust to Mars geomorphology, weather, and exploration, the processes that move sand and that raise dust to maintain Mars' ubiquitous dust haze and to produce dust storms have not been well quantified in situ, with missions lacking either the necessary sensors or a sufficiently active aeolian environment. Perseverance rover's novel environmental sensors and Jezero crater's dusty environment remedy this. In Perseverance's first 216 sols, four convective vortices raised dust locally, while, on average, four passed the rover daily, over 25% of which were significantly dusty ("dust devils"). More rarely, dust lifting by nonvortex wind gusts was produced by daytime convection cells advected over the crater by strong regional daytime upslope winds, which also control aeolian surface features. One such event covered 10 times more area than the largest dust devil, suggesting that dust devils and wind gusts could raise equal amounts of dust under nonstorm conditions.


Figures

Fig. 1.
Fig. 1.. Observed winds, regional and local topography, and modeled local slope control at night.
Minute-averaged horizontal (A) wind speed and (B) direction the wind blows from at 1.45 m, observed by MEDA over 8 sols at Ls ~ 90°. (C and D) Location of landing site relative to Jezero crater and Isidis basin, showing (C) regional and (D) local scale topography. (E to G) Intensification and concentration of crater rim downslope flows from midnight to 5 a.m. local true solar time (LTST), shown as wind speed (shading) and vectors (arrows), simulated by the MarsWRF mesoscale model. Topography is shown as black contours, and the landing site is marked with a pink X.
Fig. 2.
Fig. 2.. Aeolian features and net sand transport direction over the first 216 sols.
(A) “Wind tails” of sandy regolith extending from small rocks indicate wind-driven sand transport directions, as seen in this portion of a Navcam image taken on sol 32. (B) Rose diagram showing the orientation of wind tails (blue) and ventifacts (orange) observed along the rover traverse, as well as net sand transport estimated from MEDA winds and air densities (red arrow) over the first 216 sols. (C) A ventifact imaged by Mastcam-Z. (D) An example of azimuth measurements of flutes, from which the transport direction of abrading grains is inferred.
Fig. 3.
Fig. 3.. The sol 117 gust lifting event in imaging.
(A) Features used to track the path of dust lifting/transport; yellow shading shows the “viewshed” (the surface that is line-of-sight visible) from the rover’s position. (B to D) The first, north-centered triplet of Navcam images, spaced ~14 s apart. Note that the right side of each image has been trimmed. (E) Azimuthal pointing of MEDA’s RDS photodiodes on this sol.
Fig. 4.
Fig. 4.. The sol 117 gust lifting event in meteorological time series.
(A to E) Time series of meteorological data over 20 min surrounding the sol 117 Navcam survey, with the timing of the five image triplets shown by vertical dotted lines. (A) MEDA direction that wind blows from. (B) MEDA wind speeds (purple) and periods with saturated SuperCam microphone signals (red boxes). (C) MEDA 1-Hz (thin lines) and 15-s running-average smoothed (thick lines) air temperature at 1.45 m (blue) and ~40 m (chartreuse). (D) MEDA surface pressure (black line) and an indication of the longer-term trend in pressure over the surrounding period (cyan). (E) As in (C) but showing MEDA surface temperature. (F) Percentage change in SW radiation measured by MEDA’s RDS top7 (blue), lat2 (black), lat4 (green), lat6 (red), and lat7 (yellow) photodiodes.
Fig. 5.
Fig. 5.. Daytime winds and simulated gust lifting in Jezero crater around sol 117.
(A) MEDA 12:00 to 13:00 instantaneous 2-Hz wind speeds for sols 116 to 118 and 120. (B) As in Fig. 1 (E to G) but now showing daytime convection cells being advected over Jezero crater at 12:39 LTST at Ls ~ 60°. (C) Snapshot of lifted dust flux (in arbitrary units) at 13:08 LTST in a MarsWRF LES of Jezero crater.
Fig. 6.
Fig. 6.. Dancing dust devils on sol 148.
(Left) Portion of Navcam dust devil movie (see movie S2) zooming in on vortices in the scene with images every ~28 s (every other frame) from 12:10:42 to 12:14:01 LTST. (Right) Difference between each image and the average enhancing changes in the scene, which include dust devils, their shadows, and surface dust changes.
Fig. 7.
Fig. 7.. The sol 166 vortex passage and dust lifting event.
(A to J) MEDA data showing the signature of a warm, single-celled, dusty convective vortex passing over the rover (see text). (K) Cartoon of inferred dust devil path. (L) Sudden, persistent change in surface reflectance following vortex passage indicates dust lifting within the TIRS FOV (see text). (M) Navcam image of the TIRS FOV on sol 165 at the same location as during the vortex passage.
Fig. 8.
Fig. 8.. Vortex and dust devil statistics in Jezero crater and comparison with same season at InSight.
(A) Number and size distribution of vortex pressure drops of >0.5 Pa as a function of LTST, detected by Perseverance for Ls ~ 13° to 105°, corrected for gaps in data. Also shown are error bars based on a Monte Carlo analysis. (B) As in (A) but for dusty vortices, defined as a decrease of >0.5% in the RDS top7 signal. (C) Scatterplot showing peak wind speed versus largest pressure drop for all vortex events, with bubble size indicating dust content as percentage of decrease in RDS top7. Curved lines show the relationship between the maximum wind and the central pressure drop in a vortex assuming cyclostrophic balance (see text). Purple bubbles indicate the four events with local dust lifting detected (see text). (D) As in (C) but replacing the maximum wind speed with an approximate vortex diameter inferred from ambient wind speed and encounter duration. The spatial scale of the sol 117 gust lifting event is shown for comparison. (E) As in (A) but for same seasonal period at InSight. (F) Intensity distribution of pressure drops per sol detected by InSight and Perseverance, corrected for gaps in data.

Comment in

References

    1. Diniega S., Bramson A. M., Buratti B., Buhler P., Burr D. M., Chojnacki M., Conway S. J., Dundas C. M., Hansen C. J., McEwen A. S., Lapôtre M. G. A., Levy J., McKeown L., Piqueux S., Portyankina G., Swann C., Titus T. N., Widmer J. M., Modern Mars’ geomorphological activity, driven by wind, frost, and gravity. Geomorphology 380, 107627 (2021).
    1. Szwast M. A., Richardson M. I., Vasavada A. R., Surface dust redistribution on Mars as observed by the Mars Global Surveyor and Viking orbiters. J. Geophys. Res. 111, E11008 (2006).
    1. Viúdez-Moreiras D., Newman C. E., Torre M., Martínez G., Guzewich S., Lemmon M., Pla-García J., Smith M. D., Harri A. M., Genzer M., Vicente-Retortillo A., Lepinette A., Rodriguez-Manfredi J. A., Vasavada A. R., Gómez-Elvira J., Effects of the MY34/2018 global dust storm as measured by MSL REMS in Gale crater. J. Geophy. Res. 124, 1899–1912 (2019). - PMC - PubMed
    1. M. A. Kahre, J. R. Murphy, C. E. Newman, R. J. Wilson, B. A. Cantor, M. T. Lemmon, M. J. Wolff, The Mars dust cycle, in The Atmosphere and Climate of Mars, R. Haberle, R. T. Clancy, F. Forget, M. D. Smith, R. W. Zurek, Eds. (Cambridge Univ. Press, 2017), pp. 295–337.
    1. Greeley R., Bridges N. T., Kuzmin R. O., Laity J. E., Terrestrial analogs to wind-related features at the Viking and Pathfinder landing sites on Mars. J. Geophys. Res. 107, E1 (2002).