. 2022 Jul 6;42(27):5330-5345.
doi: 10.1523/JNEUROSCI.2044-21.2022. Epub 2022 May 25.

Role of Sleep in Formation of Relational Associative Memory

Affiliations

Role of Sleep in Formation of Relational Associative Memory

Timothy Tadros et al. J Neurosci. .

Abstract

Relational memory, the ability to make and remember associations between objects, is an essential component of mammalian reasoning. In relational memory tasks, it has been shown that periods of offline processing, such as sleep, are critical to making indirect associations. To understand biophysical mechanisms behind the role of sleep in improving relational memory, we developed a model of the thalamocortical network to test how slow-wave sleep affects performance on an unordered relational memory task. First, the model was trained in the awake state on a paired associate inference task, in which the model learned to recall direct associations. After a period of subsequent slow-wave sleep, the model developed the ability to recall indirect associations. We found that replay, during sleep, of memory patterns learned in awake increased synaptic connectivity between neurons representing the item that was overlapping between tasks and neurons representing the unlinked items of the different tasks; this forms an attractor that enables indirect memory recall. Our study predicts that overlapping items between indirectly associated tasks are essential for relational memory, and sleep can reactivate pathways to and from overlapping items to the unlinked objects to strengthen these pathways and form new relational memories.SIGNIFICANCE STATEMENT Experimental studies have shown that some types of associative memory, such as transitive inference and relational memory, can improve after sleep. Still, it remains unknown what specific mechanisms are responsible for these sleep-related changes. In this new work, we addressed this problem by building a thalamocortical network model that can learn relational memory tasks and that can be simulated in awake or sleep states. We found that memory traces learned in awake were replayed during slow waves of NREM sleep and revealed that replay increased connections to and from overlapping memory items to form new relational memories. Our work discovered specific mechanisms behind the role of sleep in associative memory and made testable predictions about how sleep augments associative learning.

Keywords: learning and memory; memory consolidation; relational memory; sleep; synaptic plasticity; transitive inference.


Figures

Figure 1.
Figure 1.
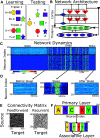
Thalamocortical model of relational memory simulates transitions between awake and sleep states. A, Basic task setup. During associative training (left), pairs of items are presented simultaneously (A + B, B + C). The relational memory task (right) tests the ability of the network to retrieve direct (B) and indirect (C) items, when presented with item A. B, Basic network architecture: PY, excitatory pyramidal cells; IN, inhibitory interneurons; TC, thalamocortical neurons; RE, inhibitory thalamic reticular neurons. Excitatory connections terminate in a dot, whereas inhibitory connections terminate in a line. Arrows indicate the direction of connections. C, Baseline network dynamics of the 200 PY neurons and 100 INs during wake and SWS. Each row represents membrane potential over time of a single neuron. D, Zoom-in of baseline network dynamics in awake state before sleep (left), during sleep (middle; one Up state is shown), and in awake state after sleep (right). Network dynamics before and after sleep are shown for layer 2 neurons. During sleep, a canonical slow wave pattern is seen across both layers. E, Weight connectivity matrix for feedforward connections from layer 1 to layer 2 in cortex (left) and recurrent connections within layer 2 (right). Connection probability is 30% for feedforward connections and 50% for recurrent connections. White dot represents that a connection exists between two neurons. F, Two-layer cortical network architecture. There are plastic feedforward connections from layer 1 to layer 2 and plastic recurrent connections within layer 2. A subset of neurons in each layer is trained to represent individual items (e.g., neurons 10-29 [denoted neuron Group A in the text] in layer 1 represent item A, and neurons 210-219 [denoted neuron Group A′] represent item A in the second layer).
Figure 2.
Figure 2.
Training and testing protocol include supervised and associative training in awake state and spontaneous activity during SWS. A, Overall network dynamics for the three phases: supervised training (purple), associative training (green), and sleep (cyan). Each phase is followed by a testing phase (T1, T2, and T3). B, During supervised training, neuron Groups A, B, C, X, Y, Z are stimulated in layer 1 and neuron Groups A′, B′, C′, X′, Y′, Z′, respectively, are stimulated in layer 2 with a 5 ms time delay. Left, Example stimulations of C and C′ and X and X′. During testing, a single neuron group in layer 1 is stimulated (e.g., neuron group Z on the right), and the response of neurons in layer 2 is measured. Red bars are shown to accentuate neuron groups that are stimulated during training phase. C, During associative training, neuron groups A + B, B + C, X + Y, Y + Z are stimulated simultaneously. Each pair is stimulated with a 500 ms delay after previous group stimulation. No stimulation is provided in layer 2. After associative training, another testing phase is performed. D, During sleep, neuromodulator levels are altered to simulate deep Stage 3 (N3) sleep activity characterized by spontaneous slow waves across cortex. After sleep, another testing phase is performed.
Figure 3.
Figure 3.
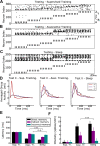
Sleep improves associative memory performance. A, C, Responses of layer 2 neuron groups after stimulating a neuron group in layer 1 during testing after supervised training (left), associative training (middle), and sleep (right). A, Responses in the model without heterosynaptic plasticity (HSP). C, Responses in the model including heterosynaptic plasticity during associative training phase. B, D, Conversion of association matrices shown in A–C to a single association performance score. B, Without heterosynaptic plasticity. D, With heterosynaptic plasticity. E, F, Associative training duration versus sleep duration. E, The model without heterosynaptic plasticity. F, The model with heterosynaptic plasticity. The first number in each cell indicates the association score before sleep, and the second number indicates the association score after sleep. Color represents the % change in association score from before to after sleep. G, Improvement in association score as a function of number of slow waves (p = 2.45 × 10⁻¹³, R2 = 0.74) in the model including heterosynaptic plasticity. Each dot represents a different network trial. Network trials are computed for 100, 300, and 500 s of sleep as well as different durations of associative training.
Figure 4.
Figure 4.
Sleep increases amplitude and decreases latency of indirect memory response. A–C, Raw network response traces during testing phase of stimulating A, B, C, X, Y, Z (from left to right) after supervised training (A), associative training (B), and sleep (C). Note increase in response and decrease in latency after sleep. D, Averaged (across 8 trials) and smoothed, through a bandpass filter at 0.1 and 20 Hz, LFP computed separately for the three neuron groups in layer 2 (X′, Y′, Z′ are shown) in response to stimulation of a neuron group X in layer 1. LFPs are shown during testing phase after supervised training (left), associative training (middle), and sleep (right). E, Average response latency for direct memories (black, e.g., latency of neuron Group B′ when A is stimulated), indirect memories (pink, e.g., latency of neuron group C′ when A is stimulated), and incorrect memories (cyan, e.g., latency of neuron group X′ when A is stimulated). F, Average firing rate of neurons in layer 2 for each type of memory (direct, indirect, and incorrect) during testing phase.
Figure 5.
Figure 5.
Synaptic weight dynamics explains improvements in relational memory after sleep. A, B, Left, Feedforward (A) and recurrent (B) synaptic weight matrices after supervised training, associative training, and sleep. Right, Synaptic input to the neurons of each memory type in layer 2 (the sum of all the weights connecting to those neurons) for self-memories (A-A′), direct memories (A-B′), indirect memories (A-C′), and incorrect memories (A-X′) after supervised training, associative training, and sleep.
Figure 6.
Figure 6.
Sleep increases modularity for each triplet of items (A′B′C′ and X′Y′Z′) in layer 2 recurrent connections. A-D, Graphs of layer 2 connectivity matrices. Each dot represents a group of 10 neurons: red dots represent A′, B′, C′; blue dots represent X′, Y′, Z′). A line is drawn between two dots if there is a weight between groups that exceeds a given threshold (75% of the maximal weight). The thickness of the line represents the number of such connections: (A) before any training, (B) after supervised training, (C) after associative training, and (D) after sleep. Threshold is calculated for each state separately; so, for example, before training many connections exceed the threshold defined by initial weak connections. E, Community assignment for layer 2 neurons over time during each training/sleep phase: ST, supervised training; AT, associative training, and sleep. Neurons were assigned the same color (at any given time) if those neurons belonged to the same community. F, The number of communities over time. Data are averaged across 10 network trials. Error bars indicate SD across trials.
Figure 7.
Figure 7.
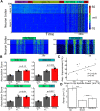
Replay during sleep drives synaptic weight changes. A, LFP during SWS (left) and “zoom-in” examples of slow waves (right). Beginning/end times of Up and Down states are computed by setting a threshold for the transition from Down to Up state and vice versa. B, Number of replay events for feedforward (top) and recurrent (bottom) connections. Replay events are selected by identifying sequential ordered firing events, within a specified time window. Replay events occur significantly more in the areas of interest (black grids) than in other areas (p < 1e-4, based on shuffling replay matrix 10,000 times). C, Change in synaptic weights as a function of number of replay events between neurons for feedforward (top, R2 = 0.61, p = 1 × 10⁻¹²) and recurrent (bottom, R2 = 0.41, p = 1 × 10⁻¹⁰) connections. D, Number of replay events between self, direct, indirect, and incorrect neuron groups for feedforward (top) and recurrent (bottom) connections. For feedforward connections, there was a significantly higher number of replay events between self-connections than direct connections, direct connections than indirect connections, and indirect connections than incorrect connections. For recurrent connections, indirect connections revealed the most replay events (p = 0.006 between wrong connections, and p = 3.28 × 10−36 between direct connections).
Figure 8.
Figure 8.
Stage 2 (N2) sleep has little effect on association score, although spindle/slow oscillation nesting during N3 sleep revealed significance. A, Network dynamics including both N2 and N3 sleep: supervised training (purple), associative training (green) and sleep, comprised of N2 (lime) and N3 sleep (cyan). Bottom row represents zoom-in of N2 sleep (two spindles are shown) and N3 sleep (slow waves). B, Association scores following 300 s of N2 sleep (top left), 300 s of N3 sleep (top right), 600 s of N2 sleep (bottom left), and 300 s of mixed sleep (200 s N2 and 100 s N3, bottom right). C, Association score improvement as a function of spindle power near Down-to-Up transition of N3 sleep suggests a significant correlation between spindle/slow oscillation nesting and association score. Spindle power in 1000 s of mV2. D, Spindle power is significantly higher near Down-to-Up transition than near Up-to-Down transition or a random time selected during the Up state of a slow wave. Power was calculated based on 100 ms time windows.
Figure 9.
Figure 9.
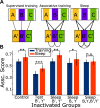
Proposed model of relational memory and main experimental predictions. A, Summary of the changes to the model at different time points. During supervised training, feedforward connections are formed between layers 1 and 2 to represent self-memories (e.g., A-A′). During associative training, the network learns to associate items presented together (e.g., A with B and B with C). However, these connections are weak, and no indirect associations are learned (e.g., A is not associated with C). After sleep, direct and indirect memory connections are strengthened and one attractor is formed for entire triplet of items (i.e., a community including A′, B′, and C′). B, Effect of inactivating different neuronal groups during either sleep or testing on association score. Blue bars represent performance after training. Orange bars represent performance after sleep. Silencing linking group in any one layer only (B′ or B, Y′ or Y) during sleep still leads to significant post-sleep improvement for associative memories (B′, Y′: t(10) = −4.91, p = 0.001; B, Y: t(10) = −2.03, p = 0.045, one-sided t test, FDR correction). However, silencing linking groups in both layers (B/B′, Y/Y′) during sleep prevents post-sleep improvement for these associative memory tasks (t(10) = −0.59, p = 0.28). Inactivating linking groups in layer 2 alone (B′, Y′) during testing was sufficient to significantly reduce associative memory performance.

References

    1. Alexander-Bloch AF, Gogtay N, Meunier D, Birn R, Clasen L, Lalonde F, Lenroot R, Giedd J, Bullmore ET (2010) Disrupted modularity and local connectivity of brain functional networks in childhood-onset schizophrenia. Front Syst Neurosci 4:147. 10.3389/fnsys.2010.00147 - DOI - PMC - PubMed
    1. Alger SE, Payne JD (2016) The differential effects of emotional salience on direct associative and relational memory during a nap. Cogn Affect Behav Neurosci 16:1150–1163. 10.3758/s13415-016-0460-1 - DOI - PubMed
    1. Aminoff EM, Tarr MJ (2015) Associative processing is inherent in scene perception. PLoS One 10:e0128840. 10.1371/journal.pone.0128840 - DOI - PMC - PubMed
    1. Avery SN, Armstrong K, McHugo M, Vandekar S, Blackford JU, Woodward ND, Heckers S (2021) Relational memory in the early stage of psychosis: a 2-year follow-up study. Schizophr Bull 47:75–86. 10.1093/schbul/sbaa081 - DOI - PMC - PubMed
    1. Bannon NM, Chistiakova M, Chen JY, Bazhenov M, Volgushev M (2017) Adenosine shifts plasticity regimes between associative and homeostatic by modulating heterosynaptic changes. J Neurosci 37:1439–1452. 10.1523/JNEUROSCI.2984-16.2016 - DOI - PMC - PubMed

Publication types

LinkOut - more resources