. 2022 May 25;13(1):2933.
doi: 10.1038/s41467-022-30467-5.

Chondroitin sulfate proteoglycans prevent immune cell phenotypic conversion and inflammation resolution via TLR4 in rodent models of spinal cord injury

Affiliations

Chondroitin sulfate proteoglycans prevent immune cell phenotypic conversion and inflammation resolution via TLR4 in rodent models of spinal cord injury

Isaac Francos-Quijorna et al. Nat Commun. .

Abstract

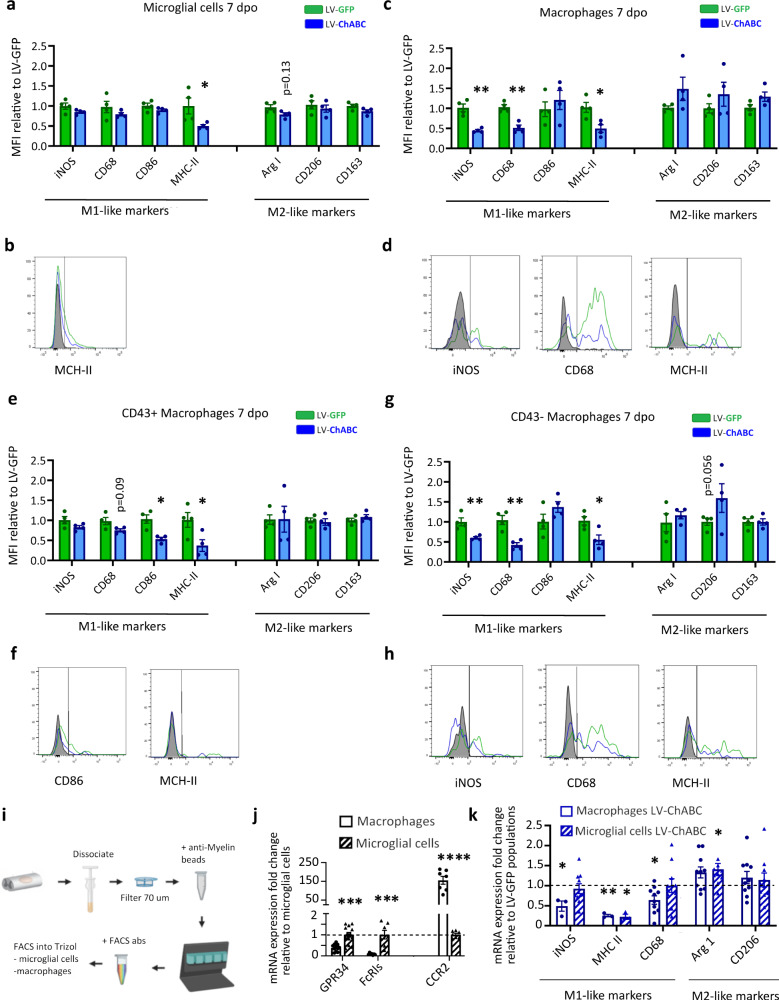
Chondroitin sulfate proteoglycans (CSPGs) act as potent inhibitors of axonal growth and neuroplasticity after spinal cord injury (SCI). Here we reveal that CSPGs also play a critical role in preventing inflammation resolution by blocking the conversion of pro-inflammatory immune cells to a pro-repair phenotype in rodent models of SCI. We demonstrate that enzymatic digestion of CSPG glycosaminoglycans enhances immune cell clearance and reduces pro-inflammatory protein and gene expression profiles at key resolution time points. Analysis of phenotypically distinct immune cell clusters revealed CSPG-mediated modulation of macrophage and microglial subtypes which, together with T lymphocyte infiltration and composition changes, suggests a role for CSPGs in modulating both innate and adaptive immune responses after SCI. Mechanistically, CSPG activation of a pro-inflammatory phenotype in pro-repair immune cells was found to be TLR4-dependent, identifying TLR4 signalling as a key driver of CSPG-mediated immune modulation. These findings establish CSPGs as critical mediators of inflammation resolution failure after SCI in rodents, which leads to prolonged inflammatory pathology and irreversible tissue destruction.


Conflict of interest statement

The authors declare no competing interests.

Figures

Fig. 1
Fig. 1. CSPG digestion enhances immune cell clearance after spinal cord injury.
a, c Experimental design of immune cell recruitment study. b Contusion device impact force and displacement measurements confirm reproducible and consistent injuries between treatment groups. Data were determined as normally distributed by the Shapiro–Wilk test and subsequently analysed using a two-tailed unpaired t test. Data are shown as mean ± SEM. d, e Graphs showing quantification of innate immune cell recruitment, using manual-gated flow cytometry, following spinal cord injury at 1, 3, 7, 14 and 28 dpi with (LV-ChABC) or without (LV-GFP) CSPG digestion. *p < 0.05 versus control (LV-GFP) group. Results were assessed for normality using the Shapiro–Wilk test and analysed using a two-way ANOVA with Bonferroni’s post hoc test (n = 8 per group at 1 dpi; n = 11 at 3 dpi; n = 11 at 7 dpi; n = 6 at 14 dpi; n = 3 at 28 dpi). Data are pooled from at least two independent experiments. Data are shown as mean ± SEM. f t-SNE flow cytometry analysis at 7dpi reveals the presence of 9 major CD45+ cell populations within the injured spinal cord. g Heat map showing the relative expression of extracellular markers in the 9 identified clusters. hm CSPG digestion reduces the number of microglial cells and monocyte/macrophages at 7 dpi. h tSNE plot highlighting cluster 1 identified as microglia in LV-GFP (left) and LV-ChABC (right) treated rats. i tSNE plot highlighting clusters 2 and 3 identified as monocytes/macrophages in LV-GFP (left) and LV-ChABC (right) treated rats. j Graph showing the number of microglial cells within the injured spinal cord at 7 dpi. Microglial cell number is significantly reduced after CSPG digestion. k Graph showing the number of monocyte/macrophages within the injured spinal cord at 7 dpi. Monocyte/macrophage cell number is significantly reduced after CSPG digestion. l, m LV-ChABC treatment exhibits greater effects in CD43low monocyte/macrophages. l tSNE plots showing the expression of CD43 in the different clusters. Note that monocytes/macrophages are differentiated in two different subsets by CD43 relative expression. m Graph showing the number of CD43high and CD43low monocyte/macrophages within the injured spinal cord at 7 dpi. Both populations are significantly reduced after CSPG digestion. j, k, m *p < 0.05, **p < 0.01 versus control (LV-GFP) group. Results were assessed for normality using the Shapiro–Wilk test and analysed using a two-tailed unpaired t test. Data are shown as mean ± SEM (n = 4 per treatment). Detailed statistics and exact p values are provided in Supplementary Table 8. Source data are provided as a Source Data file.
Fig. 2
Fig. 2. CSPG digestion shifts inflammatory gene co-expression dynamics after spinal cord injury during the resolution phase of inflammation.
a Experimental design of inflammatory gene co-expression analysis. be Dynamic analysis of the expression of 29 target genes over time with or without CSPG digestion. Gene expression was measured by qPCR on RNA extracted from the injury epicentre at different time-points after SCI. b Bar graph showing that multivariate pattern detection using dual multiple factor analysis (dMFA) detected 2 dynamic patterns (dimensions) over time explaining ~56% of the total variation in gene co-expression. c Loadings correlation bar graph to show which cytokines contribute to each of the patterns (interpreted as the Pearson r correlation coefficient ranging from −1 to 1). d Bar graph representing the Euclidean distance to the naïve centroid for each group at different time-points, measuring the relative movement of treated animals with respect to naïve in the global inflammatory gene profile. Two-way ANOVA with time and group as factors using Tukey for multiple testing correction. *p < 0.05, **p < 0.01, ***p < 0.001 versus uninjured (naive) group; #p < 0.05 versus LV-GFP group. Data are shown as mean ± SEM (n = number of animals/samples, with n = 6 for each group–time combination except LV-GFP at 12 h, LV-ChABC at 6 and 12 h post injury (n = 4); LV-GFP at 3 dpi (n = 5) and LV-ChABC at 7 dpi (n = 7). e Bidimensional plots of the component scores in dimensions 1 and 2. Ellipsoids represent the bivariate standard deviation and the coloured circles the centroid. There is little divergence of LV-ChABC and LV-GFP at any timepoint except 7 dpi, where LV-ChABC becomes highly diverged from LV-GFP and is proximal to naïve, reflecting a gene expression pattern comparable to uninjured animals at 7 dpi after CSPG digestion. fi Further pattern analysis at 7 dpi was performed using principal component analysis (PCA) for 42 inflammatory-related genes, confirming a reduction of pro-inflammatory genes after CSPG digestion, assessed by qPCR. f Loadings correlation heat map show dimension 1 loadings are positive for almost all cytokines, indicative of a global higher cytokine co-expression in LV-GFP vs. LV-ChABC-treated animals. g Component score bar graphs for each group and dimension at 7 dpi show significant differences between LV-GFP and LV-ChABC in dimension 1. **p < 0.01 versus control (LV-GFP) group. Results were assessed for normality using the Shapiro–Wilk test and analysed using a two-tailed unpaired t test. Data are shown as mean ± SEM. (h) Bidimensional plot of the component scores for each group in dimension 1 and 2 at 7 dpi showing significant differences between LV-GFP and LV-ChABC in dimension 1. **p < 0.01 versus control group (LV-GFP) (n = 5 per treatment). i Heatmap showing gene expression data for 42 key genes in the inflammatory response at 7 dpi. LV-ChABC treatment elicits gene expression patterns closer to naïve than LV-GFP treated animals. j Bar graph showing all significant pro-inflammatory gene expression differences between LV-GFP and LV-ChABC treatments at 7 dpi. *p < 0.05, **p < 0.01 versus control (LV-GFP) group. Results were assessed for normality using the Shapiro–Wilk test and analysed using a two-tailed unpaired t test. Data are shown as mean ± SEM (n = 6 naïve group, n = 5 per treatment). Detailed statistics and exact p values are provided in Supplementary Table 8. Source data are provided as a Source Data file.
Fig. 3
Fig. 3. CSPG digestion alters phenotypically distinct immune cell clusters during the resolution phase of inflammation after spinal cord injury.
a Bar graphs showing changes in the expression of classic M1 and M2 markers in the microglial cell population (cluster 1 in t-SNE analysis, Fig. 1f, g) at 7 dpi. Microglial cells exhibit significantly reduced expression of the pro-inflammatory (M1) marker MHC II in the LV-ChABC treated group, compared to LV-GFP treated animals. b FACS plot histogram of MHC-II expression in microglial cells at 7 dpi showing reduced expression in the LV-ChABC-treated group (blue) compared with control treatment (LV-GFP; green). Grey colour represents the isotype control. c Bar graphs showing changes in the expression of classic M1 and M2 markers in in the macrophage cell population (clusters 2 and 3 in t-SNE analysis, Fig. 1f, g), at 7 dpi. Macrophages exhibit significantly reduced expression of pro-inflammatory (M1) markers in LV-ChABC-treated animals compared to LV-GFP controls. d FACS plot histogram of M1 markers in the macrophage population at 7 dpi showing reduced expression in LV-ChABC treated group (blue) compared with control treatment (LV-GFP; green). Grey colour represents the isotype controls. e, g Graphs showing the changes in the expression of M1 and M2 markers in CD43high and CD43low macrophages (t-SNE cluster 3 and 2, respectively, Fig. 1f, g, i), at 7 dpi. Pro-inflammatory M1 marker reduction exerted by CSPG digestion is higher in the CD43low population (G). f, h FACS plot histograms of pro-inflammatory marker expression IN CD43high and CD43low macrophages, respectively, at 7 dpi showing reduced expression in the LV-ChABC treated group (blue) compared with control treatment (LV-GFP; green). Grey colour represents the isotype controls. a, c, e, g *p < 0.05, **p < 0.01 versus control (LV-GFP) group. Results were assessed for normality using the Shapiro–Wilk test and analysed using a two-tailed unpaired t test. Data are shown as mean ± SEM (a and c: LV-GFP n = 9, LV-ChABC n = 11; e and g: n = 4 per treatment). MFI mean fluorescence intensity. i Experimental design for phenotype gene expression analysis in sorted cells at 7 dpi. j Expression levels of microglial (GPR34 and FcRls) and monocyte/macrophage (CCR2) enriched genes evaluated by qPCR in sorted cells. ***p < 0.001, ****p < 0.0001 versus sorted microglial gene expression. Results were assessed for normality using the Shapiro–Wilk test and analysed using a two-tailed unpaired t test. Data are shown as mean ± SEM (n = 13 per cell population). k gene expression of classic M1 and M2 phenotype markers measured by qPCR in sorted monocytes/macrophages and microglial cells at 7 dpi. LV-ChABC treatment redirects monocytes/macrophages and microglial cells toward a pro-repair (M2) phenotype after SCI. *p < 0.05, **p < 0.01 versus normalised control group (LV-GFP treatment). Results were assessed for normality using the Shapiro–Wilk test and analysed using a two-tailed unpaired t test. Data are shown as mean ± SEM (iNOS, MHC-II n = 3; CD68, Arg I, CD206 n = 10 per treatment for macrophages; MHC-II n = 3; iNOS, CD68, Arg I, CD206 n = 10 per treatment for microglial cells). Detailed statistics and exact p values are provided in Supplementary Table 8. Source data are provided as a Source Data file.
Fig. 4
Fig. 4. CSPG digestion alters immune cell phenotype and spatial distribution at the injury epicentre after spinal cord injury.
a, b Immunohistochemistry in transverse spinal cord sections at the injury epicentre at 7 dpi showing CS-56 expression and distribution in a LV-GFP and b LV-ChABC treated animals (i and ii show higher magnification of selected areas). c, d Immunohistochemistry showing GFAP (green) and CD206 (red) expression and distribution in c LV-GFP and d Lv-ChABC treated animals (i and ii show higher magnification of selected areas). Note the change in spatial distribution of CD206+ immune cells in response to CSPGs, with CD206+ cells restricted to a ring-like pattern around the inner astroglial border and absent from CSPG-dense lesion core in LV-GFP-treated animals (a, c), in contrast to the densely packed core of CD206+ immune cells in LV-ChABC treated animals (d) mirrored almost exactly by an absence of CSPGs in the lesion core (b). e, f Immunohistochemistry showing NFH (green) and iNOS (red) expression and distribution in c LV-GFP and d LV-ChABC-treated animals (i and ii show higher magnification of selected areas). af Nuclei in blue were stained with DAPI. gj Bar graphs quantifying CS-56 (g, h), CD206 (i) and iNOS (j) expression between groups assessed by fluorescence intensity. Results were assessed for normality using the Shapiro–Wilk test and analysed using a two-tailed unpaired t test. *p < 0.05, **p < 0.01 vs. LV−. Data are shown as mean ± SEM (n = 4 in LV-GFP and n = 3 in LV-ChABC groups). Detailed statistics and exact p values are provided in Supplementary Table 8. Source data are provided as a Source Data file.
Fig. 5
Fig. 5. CSPG digestion reduces T cell infiltration and Th1 signature after spinal cord injury.
a Gating strategy used for lymphocyte recruitment assessment. bd Graphs showing quantification of lymphocyte recruitment following SCI at b 7, c 14, and d 28 dpi with (LV-ChABC) or without (LV-GFP) CSPG digestion showing a significant reduction of T cell infiltration after CSPG digestion at 7 dpi. *p < 0.05, **p < 0.01 versus control (LV-GFP) group. Results were assessed for normality using the Shapiro–Wilk test and analysed using a two-tailed unpaired t test. Data are shown as mean ± SEM (n = 5 at 7 dpi, n = 6 at 14 dpi, and n = 3 at 28 dpi per treatment). Data are pooled from at least two independent experiments. e Th1 signature gene expression assessed by qPCR in TCD4 sorted cells. f IFNg expression comparison between LV-GFP and LV-ChABC treated animals in TCD4 sorted cells at 7 dpi. e, f *p < 0.05 versus control (LV-GFP) group. Results were assessed for normality using the Shapiro–Wilk test and analysed using a two-tailed unpaired t test. Data are shown as mean ± SEM (n = 4 per treatment). Detailed statistics and exact p values are provided in Supplementary Table 8. Source data are provided as a Source Data file.
Fig. 6
Fig. 6. CSPG treatment converts anti-inflammatory macrophages to a pro-inflammatory phenotype.
a Experimental design of CSPG phenotype conversion studies in polarised bone marrow-derived macrophages (BMDMs) in vitro. b 3D PCA of inflammatory response gene expression profiles in M1 and M2 polarised BMDMs with or without CSPG treatment at 4 or 16 h (n = 3 per group). Note that gene expression alteration in BMDMs produced by CSPG treatment is highest in M2 polarised BMDMs compared to M1, and at 4 h compared to 16 h after the treatment. c Heatmap showing the effect of 4 h CSPG treatment (5 μg/ml) in M1 (left) and M2 (right) polarised BMDMs. CSPG immunomodulatory effects are predominant in M2 polarised BMDMs, causing a significant increase in multiple pro inflammatory genes. d, e Bar graphs showing genes that were significantly altered by 4 h CSPG treatment in d M1 and e M2 BMDMs. mRNA levels of inflammatory response genes were determined by qPCR. *p < 0.05, **p < 0.01, ***p < 0.001, ****p < 0.0001 vs. control (no CSPG). Results were assessed for normality using the Shapiro–Wilk test and analysed using a two-tailed unpaired t test. Data are shown as mean ± SEM (n = 3 per group). f Heatmap showing the effect of 16 h CSPG treatment (5 μg/ml) in M1 (left) and M2 (right) polarised BMDMs. g, h Bar graphs showing genes that were significantly altered by CSPG treatment in (g) M1 and (h) M2 BMDMs. mRNA levels of inflammatory response genes were determined by qPCR. *p < 0.05, **p < 0.01, ***p < 0.001, ****p < 0.0001 versus control (no CSPG). Results were assessed for normality using the Shapiro–Wilk test and analysed using a two-tailed unpaired t test. Data are shown as mean ± SEM (n = 3 per group). Detailed statistics and exact p values are provided in Supplementary Table 8. Source data are provided as a Source Data file.
Fig. 7
Fig. 7. CSPG digestion reduces the inflammatory effects of CSPGs in M2 polarised BMDMs in vitro and in vivo.
a Experimental design for evaluating the effects of ChABC conditioned media on polarised BMDMs after CSPG (5 μg/ml) activation. b mRNA level of ChABC gene expression produced by non-polarised (M0) BMDMs at different LV-ChABC titre transfection. Results were assessed for normality using the Shapiro–Wilk test and one-way ANOVA with Tukey post hoc test was used to analyse significant differences. ***p < 0.001 vs. control group (0 GC/ml), ###p < 0.001 vs. 2e7 GC/ml group, &&&p < 0.001 vs. 4e7 GC/ml group. Relative fold changes presented as mean ± SEM (n = 3 per group). The optimum titration was 1e8 GC/ml, which was used for further experiments. c Immunocytochemistry of BMDMs transfected with LV-GFP (green) to confirm (d) the percentage of transfection (68%) at 1e8 U/ml (n = 3 per group). Data are shown as mean ± SEM. Bar graphs of inflammatory gene expression by CSPG treatment with or without ChABC enriched medium in e M2 and f M1 BMDMs. mRNA levels of inflammatory response genes were determined by qPCR. **p < 0.01, ***p < 0.001, ****p < 0.0001 vs. control (no CSPG) group; #p < 0.05, ##p < 0.01, ###p < 0.001 vs. +CSPG+ ChABC group; &p < 0.05, &&p < 0.01, &&&p < 0.001, &&&&p < 0.0001 vs. +ChABC group; $p < 0.05, $$p < 0.01, $$$p < 0.001, $$$$p < 0.0001 vs. +CSPG group. Results were assessed for normality using the Shapiro–Wilk test and one-way ANOVA with Tukey post hoc test was used to analyse differences between conditions. Data are shown as mean ± SEM (n = 4 per group). g Experimental design for cytokine gene expression analysis in sorted cells from contused rat spinal cord at 7 dpi. h Bar graphs showing inflammatory cytokine gene expression measured by qPCR in sorted macrophages and microglial cells at 7 dpi, showing reduced pro inflammatory cytokine gene expression in response to CSPG digestion in both populations after SCI. *p < 0.05, ***p < 0.001 vs. normalised control group (LV-GFP treatment). Results were assessed for normality using the Shapiro–Wilk test and analysed using a two-tailed unpaired t test. Data are shown as mean ± SEM (CCL5, IL6 n = 3; Il1b, CCL3, CXCL10 n = 9, per treatment and cell population). Detailed statistics and exact p values are provided in Supplementary Table 8. Source data are provided as a Source Data file.
Fig. 8
Fig. 8. The TLR4 pathway is essential for the CSPG-activated inflammatory phenotype in M2 polarised macrophages.
a Experimental design to study the effect of CSPG treatment (5 μg/ml) on polarised BMDMs treated with or without TAK242 (100 μM), a pharmacological inhibitor of TLR4. Bar graphs showing the expression of inflammatory response genes in b M1 BMDMs and c M2 BMDMs. mRNA levels were determined by qPCR. Data were normalised with respect to control (no CSPGs). Results were assessed for normality using the Shapiro–Wilk test and one-way ANOVA with Tukey post hoc test was used to analyse differences between conditions. *p < 0.05, **p < 0.01, ***p < 0.001 vs. control group, &p < 0.05, &&p < 0.01, &&&p < 0.001 vs. CSPG treated group, #p < 0.05, ##p < 0.01, ###p < 0.001 vs. +CSPGs+TAK242 group, $p < 0.01, $$p < 0.001, $$$p < 0.001 vs. +TAK242 group. Data are presented as mean ± SEM (n = 13 in −CSPG and +CSPG groups; n = 7 in +CSPG +TAK242 group; n = 10 in −CSPG +TAK242 group). d Experimental design to compare the effect of CSPG treatment on BMDMs from C57/B6 WT and TLR4−/− mice. eh Bar graphs comparing immunomodulatory effects of CSPG treatment (4 h at 5ug/ml) between WT and TLR4−/− polarised BMDMs. Differences in inflammatory gene expression by CSPG treatment were assessed in e M1− WT, (f) M1− TLR4−/−, g M2-WT and h M2-TLR4−/− BMDMs. mRNA levels of inflammatory response genes were determined by qPCR. Data was normalised by their respective controls (WT or TLR4−/− BMDM without CSPGs), represented by dotted line. Results were assessed for normality using the Shapiro–Wilk test and analysed using a two-tailed unpaired t test. *p < 0.05, **p < 0.01, ***p < 0.001 vs. WT w/o CSPGs. Data are shown as mean ± SEM (n = 3 per group). Detailed statistics and exact p values are provided in Supplementary Table 8. Source data are provided as a Source Data file.

References

    1. Hutson TH, Di Giovanni S. The translational landscape in spinal cord injury: focus on neuroplasticity and regeneration. Nat. Rev. Neurol. 2019;15:732–745. doi: 10.1038/s41582-019-0280-3. - DOI - PubMed
    1. Bradbury EJ, Burnside ER. Moving beyond the glial scar for spinal cord repair. Nat. Commun. 2019;10:3879. doi: 10.1038/s41467-019-11707-7. - DOI - PMC - PubMed
    1. Tran AP, Warren PM, Silver J. The biology of regeneration failure and success after spinal cord injury. Physiol. Rev. 2018;98:881–917. doi: 10.1152/physrev.00017.2017. - DOI - PMC - PubMed
    1. Moon LDF, Asher RA, Rhodes KE, Fawcett JW. Regeneration of CNS axons back to their target following treatment of adult rat brain with chondroitinase ABC. Nat. Neurosci. 2001;4:465–466. doi: 10.1038/87415. - DOI - PubMed
    1. Bradbury EJ, et al. Chondroitinase ABC promotes functional recovery after spinal cord injury. Nature. 2002;416:636–640. doi: 10.1038/416636a. - DOI - PubMed

Publication types

Substances