. 2022 May 25;13(1):2923.
doi: 10.1038/s41467-022-30199-6.

Functional and multiscale 3D structural investigation of brain tissue through correlative in vivo physiology, synchrotron microtomography and volume electron microscopy

Affiliations

Functional and multiscale 3D structural investigation of brain tissue through correlative in vivo physiology, synchrotron microtomography and volume electron microscopy

Carles Bosch et al. Nat Commun. .

Abstract

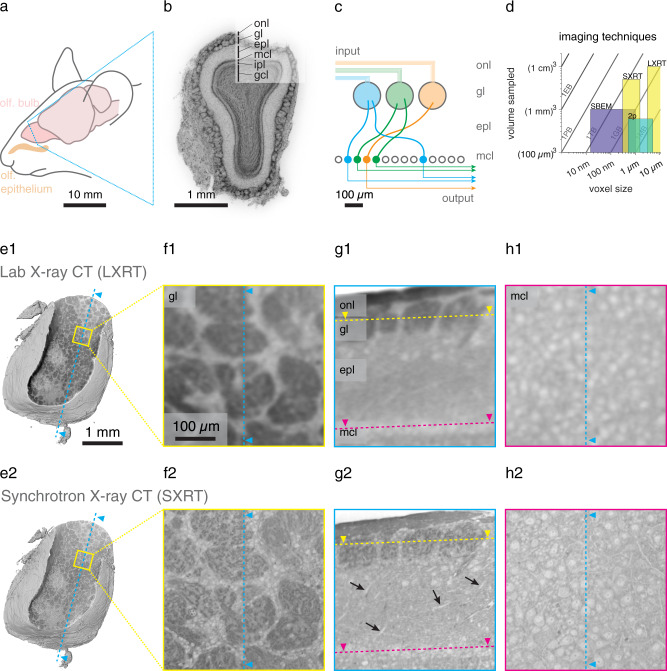
Understanding the function of biological tissues requires a coordinated study of physiology and structure, exploring volumes that contain complete functional units at a detail that resolves the relevant features. Here, we introduce an approach to address this challenge: Mouse brain tissue sections containing a region where function was recorded using in vivo 2-photon calcium imaging were stained, dehydrated, resin-embedded and imaged with synchrotron X-ray computed tomography with propagation-based phase contrast (SXRT). SXRT provided context at subcellular detail, and could be followed by targeted acquisition of multiple volumes using serial block-face electron microscopy (SBEM). In the olfactory bulb, combining SXRT and SBEM enabled disambiguation of in vivo-assigned regions of interest. In the hippocampus, we found that superficial pyramidal neurons in CA1a displayed a larger density of spine apparati than deeper ones. Altogether, this approach can enable a functional and structural investigation of subcellular features in the context of cells and tissues.


Conflict of interest statement

The authors declare no competing interests.

Figures

Fig. 1
Fig. 1. Correlative multimodal imaging for mouse brain tissue samples.
a Elements of the olfactory sensory pathway in the mouse brain. b Nuclear staining of a 100 µm coronal section of the mouse main olfactory bulb, displaying its histological layers, obtained with widefield fluorescence microscopy. c Diagram of the excitatory wiring of the glomerular columns in the olfactory bulb. d Imaging techniques capable of acquiring soft tissue volumes at the neural circuit scale. e Reconstruction of the LXRT (e1) and SXRT (e2) datasets obtained from the same sample, virtually sliced displaying the glomerular layer. fh Virtual slices in three regions showing features resolved by each imaging modality in the glomerular layer (f1-2), in a sagittal section (g1-2) and in the mitral cell layer (h1-2). Arrows in (g2) indicate apical dendrites. Source data for (d) are provided as a Source Data file. onl, olfactory nerve layer; gl, glomerular layer; epl, external plexiform layer; mcl, mitral cell layer; ipl, inner plexiform layer; gcl, granule cell layer.
Fig. 2
Fig. 2. Apical dendrites of principal neurons can be traced in SXRT datasets.
a Volume of a mouse olfactory bulb obtained with SXRT, virtually sliced sagittally, displaying all main histological layers. Below, SXRT (b) and low-resolution SBEM ((50 nm)3 voxels) (c) of the highlighted region. d Apical dendrites traced in both imaging modalities by 3 independent tracers (grey lines: SBEM ground truth consensus, coloured lines: SXRT individual traces). e Traceable length of all SXRT dendrites and of the correctly linked ones. Traceable length measures the dendrite length through which SXRT tracing is within 12 µm (lost threshold) away from the paired EM tracing. Each dot represents one cell’s apical dendrite. The box covers the 25 to 75% percentile range; the middle bar represents the median value (printed above); the whiskers extend to the most extreme data points that are not an outlier (defined as outside of the 1.5× interquartile range). The grey dashed line marks the lost threshold used. Source data for (e) are provided as a Source Data file. onl, olfactory nerve layer; gl, glomerular layer; epl, external plexiform layer; mcl, mitral cell layer; ipl, inner plexiform layer.
Fig. 3
Fig. 3. Tissue ultrastructure is preserved after SXRT.
Volumes obtained from the same sample: synchrotron X-ray CT (a) and posterior volume EM at high (10 × 10 × 40 nm3) resolution (b). Two regions of interest are cropped out to showcase the ultrastructure of the tissue. c Close-up details of the slices indicated in (b), displaying features indicative of well-preserved ultrastructure: axon bundles (yellow), thin dendrites (green) and synapses (red arrowheads). gl, glomerular layer; epl, external plexiform layer.
Fig. 4
Fig. 4. Multiscale analysis in the hippocampal CA1a region using correlative LXRT, SXRT and SBEM.
a Hippocampus acquired with LXRT, SXRT (blue dashed line) and SBEM (yellow lines, dashed: low resolution; solid: high resolution). b CA1 pyramidal neurons. Soma colours refer to their position in the pyramidal layer. Apical dendrites (traced in the SXRT dataset) are shown in blue. The dashed line shows the average depth of all seeded somata. The dendrites of seven cells were traced exhaustively in SBEM (shown in the same colour as their soma). c Dendrites and spines traced in SBEM. Spines containing a spine apparatus are highlighted in red. d Examples of spines with (d2) and without (d1) spine apparatus. e CA1 pyramidal neurons. The apical dendrite traced in the SXRT dataset is shown in blue, dendrites traced in SBEM are shown in green (dark: trunk; light: apical oblique). Spines are shown as small protrusions, a red mark highlighting those with a spine apparatus. f Density of spine apparati. n = 7 cells from one dataset, linear regression, p = 0.092, 0.039 for apical oblique and trunk dendrites, respectively. The shaded area represents the 95% confidence interval of the linear regression line. Source data for (f) are provided as a Source Data file. CTX, cerebral cortex; HPF, hippocampal formation; CA1, Ammon’s horn field CA1; so, stratum oriens; sp, stratum pyramidale; sr, stratum radiatum; mo, molecular layers; DG, dentate gyrus.
Fig. 5
Fig. 5. Subcellular compartments resolved by SXRT in other mouse brain regions.
Full-sample panels (a1, b1, c1) display SXRT data where available (boundaries in blue dashed lines) and LXRT data elsewhere. Detailed panels show LXRT (a2, b2, c2) and SXRT (a3, b3, c3) data from the regions highlighted by yellow dashed lines in (a1, b1, c1), respectively. (a) Mouse brain sample containing striatum, corpus callosum and cortex. Detail (a3) shows the subventricular zone, somata and myelinated axon bundles (white asterisks). b Sample containing cerebral cortex, hippocampus and thalamus. Detail (b3) shows cortical layers 1 and 2/3, displaying somata and apical dendrites of pyramidal neurons (orange arrowheads). c Sample containing cerebellar cortex. Detail (c3) shows a section across cerebellar lobules, displaying granular and molecular layers and purkinje neurons (blue arrowheads). CTX, cerebral cortex; STR, striatum (caudoputamen); VL, lateral ventricle; cc, corpus callosum; svz, subventricular zone; white asterisks, myelinated axon bundles; HPF, hippocampal formation; TH, thalamus; L1, cortex layer 1; L2/3, cortex layer 2/3; Orange arrowheads, apical dendrites of cortical pyramidal neurons; CBX, cerebellar cortex; gr, granular layer; mo, molecular layer; blue arrowheads, Purkinje neurons.
Fig. 6
Fig. 6. Multiscale analysis in the olfactory bulb glomerular layer using correlative in vivo 2-photon Ca2+ imaging, LXRT, SXRT and SBEM.
a in vivo 2-photon imaging setup for imaging neural activity of projection neurons in anaesthetised mice in response to a controlled odour pattern delivered to their nose (blue and yellow ports indicate odour delivery and airflow sensor). Right: Schematic of the olfactory bulb surface with blood vessels (red) and a genetically targeted glomerulus (green). b Example traces (mean of 5 presentations ± SEM) of neuronal activity in response to four odours (odour presentation window in blue). c Maximum projection (8000 frames) of a functionally imaged plane recorded in vivo, located in the glomerular layer. Highly branched dendritic tufts define the contours of 20 putative glomeruli (yellow). The fluorescence signal inside these regions of interest was measured over time. In the M72 glomerulus the afferent sensory axons expressed YFP, making it identifiable (red asterisk and contour). d Response integral of all glomeruli to all odours (average of 5 presentations). e Dataset obtained in vivo at the end of the functional recordings using 2-photon microscopy. (green: GCaMP/M72-YFP; red: blood vessels labelled by SR101). This dataset was warped into the same common space as (fh). f Same region as in (e), as obtained by LXRT. g Same region as in (e), as obtained by SXRT. h Same region as in (e), as obtained by SBEM. i Extents of the 2p anatomical (blue box) and SBEM datasets (pale grey), all functionally imaged ROIs, coloured based on whether they were found inside a glomerulus in EM (green), outside the EM-imaged volume (blue) or located outside of any glomerulus despite being inside the EM-imaged volume (yellow). Detailed reconstructions of the matched EM glomeruli are shown in grey. Centroids of all other glomeruli in the EM dataset that are also in the 2p-imaged volume are shown as filled dots. Centroids of glomeruli in the EM dataset located outside the 2p-imaged volume are shown as empty dots. j Yield of the correlative experiment (number of glomeruli matched across imaging modalities). Source data for (b, d, i, j) are provided as a Source Data file.
Fig. 7
Fig. 7. Multiple SBEM datasets obtained of two regions from the same specimen targeted using correlative ex vivo 2-photon, LXRT, SXRT and SBEM.
(a) Reconstruction of an olfactory bulb slab, displaying the regions of interest containing the MOR174/9 and M72 glomeruli in magenta and yellow, respectively. (be) Multimodal correlated image data of the same region, displaying the 2p ex vivo dataset of the fixed specimen (b), LXRT (c), SXRT (d) and SBEM (e) of the MOR174/9 (b1e1) and M72 (b2e2) regions of interest delineated in (a). f Reconstructions of the SBEM datasets containing both genetically identified glomerular columns.

References

    1. Young, B., Woodford, P. & O’Dowd, G. Wheater’s Functional Histology: a Text and Colour Atlas. 6th edn (Churchill Livingstone, 2000).
    1. Vyas S, Golub MD, Sussillo D, Shenoy KV. Computation through neural population dynamics. Annu. Rev. Neurosci. 2020;43:249–275. doi: 10.1146/annurev-neuro-092619-094115. - DOI - PMC - PubMed
    1. Helmstaedter M. Cellular-resolution connectomics: challenges of dense neural circuit reconstruction. Nat. Methods. 2013;10:501–507. doi: 10.1038/nmeth.2476. - DOI - PubMed
    1. Klinger E, Motta A, Marr C, Theis FJ, Helmstaedter M. Cellular connectomes as arbiters of local circuit models in the cerebral cortex. Nat. Commun. 2021;12:2785. doi: 10.1038/s41467-021-22856-z. - DOI - PMC - PubMed
    1. Gray EG. Electron microscopy of synaptic contacts on dendrite spines of the cerebral cortex. Nature. 1959;183:1592–1593. doi: 10.1038/1831592a0. - DOI - PubMed

Publication types