. 2022 May 25;13(1):2927.
doi: 10.1038/s41467-022-30623-x.

Cell type-specific biotin labeling in vivo resolves regional neuronal and astrocyte proteomic differences in mouse brain

Affiliations

Cell type-specific biotin labeling in vivo resolves regional neuronal and astrocyte proteomic differences in mouse brain

Sruti Rayaprolu et al. Nat Commun. .

Abstract

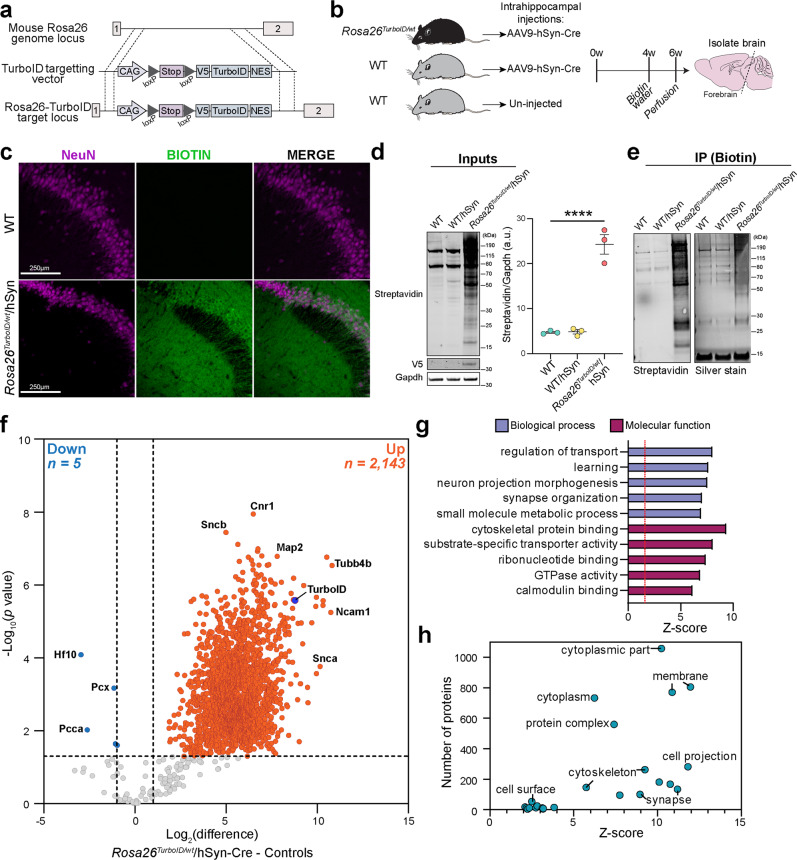
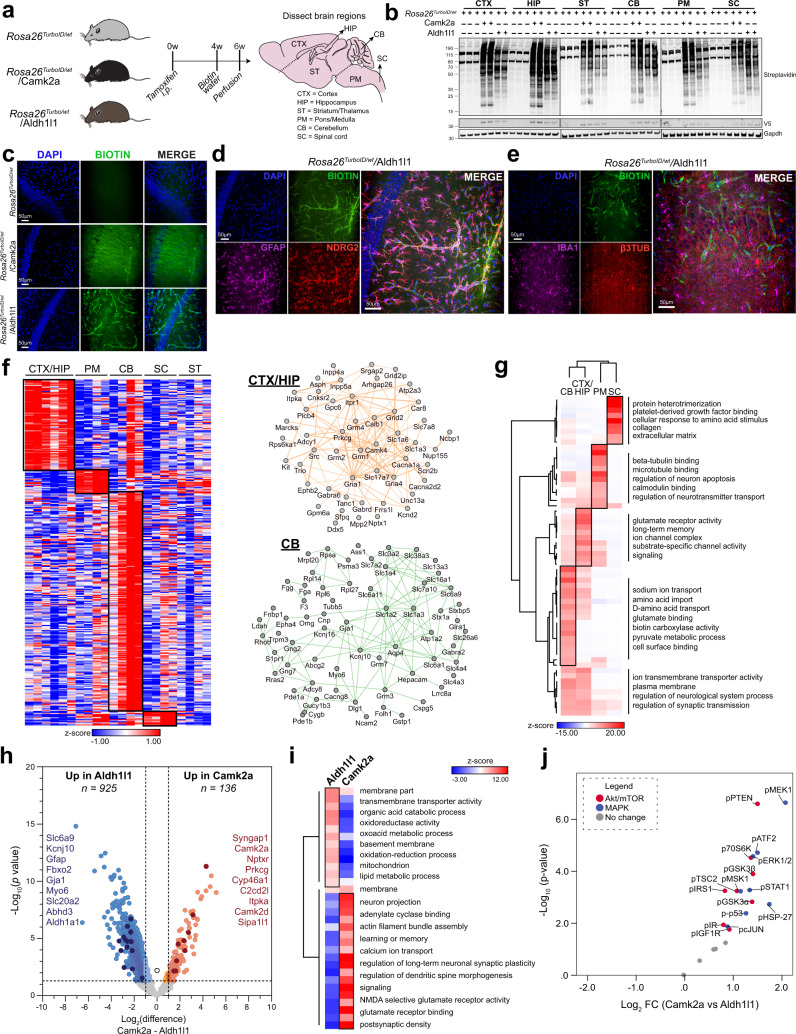
Proteomic profiling of brain cell types using isolation-based strategies pose limitations in resolving cellular phenotypes representative of their native state. We describe a mouse line for cell type-specific expression of biotin ligase TurboID, for in vivo biotinylation of proteins. Using adenoviral and transgenic approaches to label neurons, we show robust protein biotinylation in neuronal soma and axons throughout the brain, allowing quantitation of over 2000 neuron-derived proteins spanning synaptic proteins, transporters, ion channels and disease-relevant druggable targets. Next, we contrast Camk2a-neuron and Aldh1l1-astrocyte proteomes and identify brain region-specific proteomic differences within both cell types, some of which might potentially underlie the selective vulnerability to neurological diseases. Leveraging the cellular specificity of proteomic labeling, we apply an antibody-based approach to uncover differences in neuron and astrocyte-derived signaling phospho-proteins and cytokines. This approach will facilitate the characterization of cell-type specific proteomes in a diverse number of tissues under both physiological and pathological states.


Conflict of interest statement

The authors declare no competing interests.

Figures

Fig. 1
Fig. 1. Development and validation of the Rosa26TurboID/wt mouse line for cell type-specific proteomics.
a Genetic strategy for targeting TurboID (V5-TurboID-NES) to the Rosa26 locus. b Schematic of AAV studies to direct Cre recombinase expression in hippocampal neurons (n = 3 WT mice with no injections, n = 3 WT mice received AAV9-hSyn-Cre, n = 3 Rosa26TurboID/wt mice received AAV9-hSyn-Cre). c Representative immunofluorescence images of CA2/3 of the hippocampus from WT/hSyn (n = 3 mice) and Rosa26TurboID/wt/hSyn (n = 3 mice) showing biotinylation (green: streptavidin Alexa488) in relation to neuronal nuclei (magenta: NeuN). d Western blot of brain lysates (representative animal from n = 3 mice/group) probed with streptavidin fluorophore, anti-V5, and anti-Gapdh antibodies. Rosa26TurboID/wt/hSyn brain showed biotinylated proteins of different molecular weights as compared to few endogenously biotinylated proteins in the two control groups. Right: Densitometry confirming significant increase in biotinylation signal in Rosa26TurboID/wt/hSyn brains (one-way ANOVA, ****p = 0.0001; data represented as mean ± SEM). e Western blot (left) and silver stain (right) of enriched biotinylated proteins after streptavidin-pulldown and release of biotinylated proteins from 10% of streptavidin beads (representative images from n = 3 mice/group). As compared to minimal protein enriched in the two control groups, several biotinylated proteins were enriched from Rosa26TurboID/wt/hSyn brain. f Volcano plots showing differentially enriched proteins comparing Rosa26TurboID/wt/hSyn (n = 3) and control mice (n = 3 WT and n = 3 WT/hSyn). Orange symbols (two-sided T-test unadjusted p ≤ 0.05 and ≥2-fold change) represent biotinylated proteins enriched in the Rosa26TurboID/wt/hSyn brain and examples of neuron-specific proteins are highlighted, in addition to TurboID. Blue symbols represent endogenously biotinylated carboxylases enriched in the control brains. For group wise comparisons, see Supplementary Fig. 1. g Results from GSEA of ≥2-fold biotinylated neuronal proteins (orange symbols from panel f), as compared to reference list (mouse brain: n = 7736) showed enrichment of neuronal and synaptic proteins confirming neuron-specific labeling. h Graphical representation of the number of proteins within various cellular compartments determined from GSEA. For related MS data and additional analyses, see Supplementary Data 1, 3, 7, and 8. Source data are provided as a Source Data file.
Fig. 2
Fig. 2. Successful biotin labeling of Camk2a neurons in adult mouse brain.
a Schematic displaying the study design for Camk2a neuron-specific proteomic biotinylation. Heterozygous Camk2a-CreErt2 (n = 2) and Rosa26TurboID/wt/Camk2a-CreErt2 mice (n = 2) received tamoxifen intraperitoneally (i.p.) once a day for 5 days. After waiting 4 weeks for sufficient recombination and washout of tamoxifen effect, mice were supplemented with biotin water (37.5 mg/L) for 2 weeks. Brain was dissected into the following regions: cortex (CTX), hippocampus (HIP), striatal region which included the thalamus (ST), brain stem comprised on pons/medulla (PM), and cerebellum (CB). b Representative Western blots from brain lysates (n = 2 mice/experimental group), probed for biotin (streptavidin fluorophore), V5 (to detect V5-TurboID-NES), and Gapdh are shown. Rosa26TurboID/wt/Camk2a brain regions showed biotinylated proteins of different molecular weights as compared to few endogenously biotinylated proteins in the control brain regions. c Representative immunofluorescence images (n = 2 mice/experimental group) showing biotinylation (green: streptavidin Alexa488) across different brain regions. Tiled images of the entire hemisphere (sagittal section) from control and labeled mice, and higher-magnification images from individual regions of labeled mice are shown. Nuclei were labeled with DAPI (blue). d Representative immunofluorescence images (n = 2 mice/experimental group) showing overlap between biotinylation (streptavidin Alexa488) and Map2 expression in neurons and axons in the hippocampus from control and labeled mice. e Experimental outline for hippocampal slice electrophysiology from non-labeled Rosa26TurboID/wt and labeled Rosa26TurboID/wt/Camk2a mice (n = 2 mice/group). f Electrophysiological recordings from CA3c pyramidal neurons of the hippocampus showing similar firing pattern in controls and labeled Rosa26TurboID/wt/Camk2a mice. Each data point represents a single neuron. Pooled analysis from n = 17 non-labeled control and n = 8 labeled neurons is shown on the right (p value represents unpaired t-test, p = 0.2231). Data are represented as box plots, indicating median, inter-quartile range, 10th and 90th percentile. For associated immunofluorescence images for confirmation of efficient biotin labeling and additional electrophysiological studies performed, see Supplementary Fig. 4. The figure was partly generated using Servier Medical Art, provided by Servier, licensed under a Creative Commons Attribution 3.0 unported license. Source data are provided as a Source Data file.
Fig. 3
Fig. 3. Camk2a neurons exhibit region-specific proteomic differences in adult mouse brain.
a Experimental outline for LFQ-MS studies performed on biotinylated proteins enriched using streptavidin beads from Rosa26TurboID/wt/Camk2a-CreErt2 and littermate control (Camk2a-CreErt2) mice (n = 2 mice per experimental group, five regions per mouse with 2 technical replicates per region). Asterisk (*) indicates technical replicates for each brain region from Rosa26TurboID/wt/Camk2a-CreErt2 mice. b Principal Component Analysis (PCA) of MS data after normalization to TurboID abundance in each sample/brain region. PCA identified distinct clusters based on region except for hippocampal and cortical regions clustering together. Three PCs explained 30%, 14 and 13% of variance, respectively. c Clustering representation of protein abundance data of core groups of proteins most highly expressed in specific brain regions with at least 4-fold higher levels in a specific region compared to all other regions (p ≤ 0.05). STRING analysis identified networks of known direct (protein-protein) and indirect (functional) interactions within core regional protein signatures. d Heatmap representation, based on enrichment Z-scores, of KEGG pathways, Pathway Commons, and diseases from the Comparative Toxicogenomics Database (CTD) enriched in core regional proteins. For related MS data and additional analyses, see Supplementary Data 9, 11, 12, and 13. The figure was partly generated using Servier Medical Art, provided by Servier, licensed under a Creative Commons Attribution 3.0 unported license.
Fig. 4
Fig. 4. Neuron-specific regional differences in cellular signaling and cytokine levels.
a Cartoon showing standard and adapted Luminex methods to measure total and biotinylated proteins. b Cartoon representation of standard and adapted Luminex approaches to measure cytokines, MAPK and Akt/mTOR phospho-proteins in brain lysates from Rosa26TurboID/wt AAV and transgenic cohorts. ce Fluorescence values for cytokines, MAPK and Akt/mTOR phospho-proteins measured using standard and adapted assays, from Rosa26TurboID/wt/AAV9-hSyn-Cre mice (n = 3/group). Predominantly neuron-derived cytokines or phospho-proteins have similar fluorescence values in both standard and adapted assays, while predominantly non-neuronal cytokines or phospho-proteins have a markedly lower adapted assay readout as compared to the standard assay, determined by pairwise comparison between control and labeled mice (also see Supplementary Data 17). Data shown as mean ± SEM. f PCA of adapted Luminex assays performed on brain lysates from the Rosa26TurboID/wt transgenic cohort, showing regional differences (CTX, ST, PM, and CB) based on cytokines and MAPK and Akt/mTOR phospho-proteins. Fluorescence values from adapted assays from labeled (Rosa26TurboID/wt/Camk2a-CreErt2) and non-labeled controls (Camk2a-CreErt2) brain lysates were normalized to TurboID abundance from MS studies after which signal from adapted assays from control mice was subtracted. g, h Heat map summarizing HCA of normalized data from adapted Luminex assays. Analyses of cytokines and phospho-proteins from MAPK and Akt/mTOR pathways are shown, revealing region specific signatures. Overall, neuron-derived cytokines had higher levels in the cerebellum and relatively lower levels in the cortex while phospho-proteins, particularly from the Akt/mTOR pathway had higher levels in the cortex and lower levels in the cerebellum. Related raw and normalized Luminex data from all animals from AAV and transgenic cohorts are included in Supplementary Data 19–21. i An integrated tSNE of core regional proteomic signatures and Luminex data showed clustering of Akt/mTOR signaling with cortex-specific proteins while elevated cytokines clustered with the cerebellar proteomic signature and MAPK clustered with striatal/thalamic proteomic signature. (see Supplementary Data 18 for statistics). The figure was partly generated using Servier Medical Art, provided by Servier, licensed under a Creative Commons Attribution 3.0 unported license. Source data are provided as a Source Data file.
Fig. 5
Fig. 5. Astrocyte protein biotinylation reveals region-specific proteomic signatures and differences between Camk2a neurons.
a Study design for neuron-specific and astrocyte-specific proteomic biotinylation. Rosa26TurboID/wt, Rosa26TurboID/wt/Camk2a-CreErt2, Rosa26TurboID/wt/Aldh1l1-CreErt2 mice received tamoxifen intraperitoneally for 5 days. After 4 weeks, mice received biotin water for 2 weeks. b Representative Western blots from brain region lysates (n = 2 mice/group), probed for biotin (streptavidin Alexa488), V5 and Gapdh are shown. c Representative images (n = 2 mice/group) showing biotinylation in the hippocampus. d Representative immunofluorescence images (n = 2 mice/group) showing overlap between astrocytic biotinylation (streptavidin Alexa488), Gfap, and Ndrg2 in the hippocampus region from Rosa26TurboID/wt/Aldh1l1 mice. e Representative immunofluorescence images (n = 2 mice/group) showing no overlap between biotinylation, Iba1, and βIII-tubulin in astrocytes and blood vessels in the hippocampus region from Rosa26TurboID/wt/Aldh1l1 mice. f Clustering analysis of protein abundance data of region-enriched proteins with at least 4-fold enrichment over other regions in Rosa26TurboID/wt/Aldh1l1 mice. STRING analysis identified networks of direct (protein-protein) and indirect (functional) interactions within core regional protein signatures in cortex/hippocampus and cerebellum. g Heatmap representation, based on enrichment Z-scores, of gene ontologies enriched in core regional proteins. h Volcano plot showing differentially enriched proteins comparing Rosa26TurboID/wt/Aldh1l1 and Rosa26TurboID/wt/Camk2a mice. For this analysis, all six brain regions were combined for both groups. Orange symbols (two-tailed T test unadjusted p ≤ 0.05 and ≥ 2-fold change) represent biotinylated proteins enriched in Camk2a neurons with neuron-specific proteins highlighted. Blue symbols (two-tailed T test unadjusted p ≤ 0.05 and ≥ 2-fold change) represent biotinylated proteins enriched in Aldh1l1 astrocytes and examples of astrocyte-specific proteins are highlighted in dark blue. i HCA of GSEA showing over-represented ontologies within neuronal-enriched proteins and astrocyte-enriched proteins. Representative gene ontology terms are highlighted. j Volcano plot showing enrichment (two-tailed T test unadjusted p ≤ 0.05) of MAPK and Akt/mTOR phospho-proteins in Rosa26TurboID/wt/Camk2a compared to Rosa26TurboID/wt/Aldh1l1 brains. For related MS data and additional analyses, see Supplementary Data 19–24. The figure was partly generated using Servier Medical Art, provided by Servier, licensed under a Creative Commons Attribution 3.0 unported license. Source data are provided as a Source Data file. Source data are provided as a Source Data file.

References

    1. De Strooper B, Karran E. The cellular phase of alzheimer’s disease. Cell. 2016;164:603–615. doi: 10.1016/j.cell.2015.12.056. - DOI - PubMed
    1. Armand EJ, Li J, Xie F, Luo C, Mukamel EA. Single-cell sequencing of brain cell transcriptomes and epigenomes. Neuron. 2021;109:11–26. doi: 10.1016/j.neuron.2020.12.010. - DOI - PMC - PubMed
    1. Vogel C, Marcotte EM. Insights into the regulation of protein abundance from proteomic and transcriptomic analyses. Nat. Rev. Genet. 2012;13:227–232. doi: 10.1038/nrg3185. - DOI - PMC - PubMed
    1. de Sousa Abreu R, Penalva LO, Marcotte EM, Vogel C. Global signatures of protein and mRNA expression levels. Mol. Biosyst. 2009;5:1512–1526. - PMC - PubMed
    1. Sharma K, et al. Cell type- and brain region-resolved mouse brain proteome. Nat. Neurosci. 2015;18:1819–1831. doi: 10.1038/nn.4160. - DOI - PMC - PubMed

Publication types