. 2022 May 25;12(1):8883.
doi: 10.1038/s41598-022-08233-w.

Cross-reactive immunity potentially drives global oscillation and opposed alternation patterns of seasonal influenza A viruses

Affiliations

Cross-reactive immunity potentially drives global oscillation and opposed alternation patterns of seasonal influenza A viruses

Lorenzo Gatti et al. Sci Rep. .

Abstract

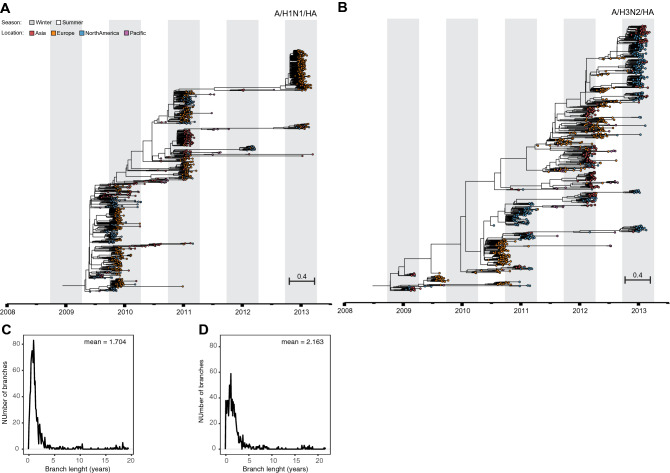
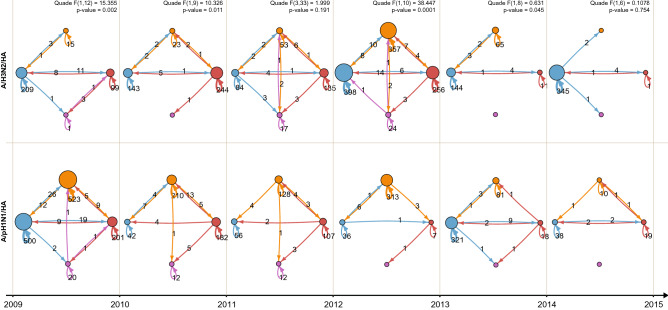
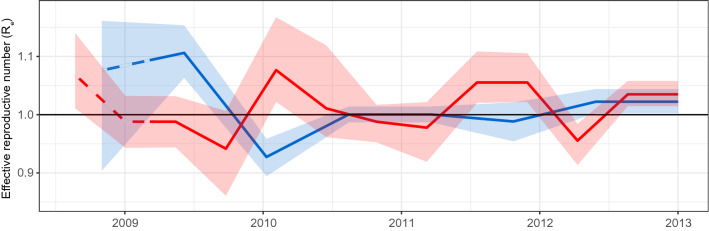
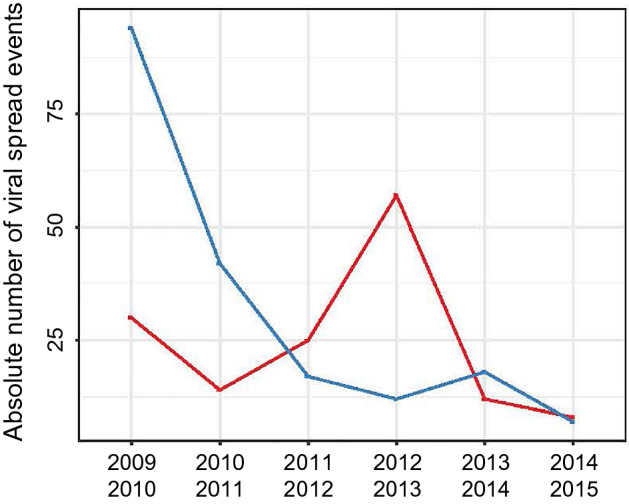
Several human pathogens exhibit distinct patterns of seasonality and circulate as pairs. For instance, influenza A virus subtypes oscillate and peak during winter seasons of the world's temperate climate zones. Alternation of dominant strains in successive influenza seasons makes epidemic forecasting a major challenge. From the start of the 2009 influenza pandemic we enrolled influenza A virus infected patients (n = 2980) in a global prospective clinical study. Complete hemagglutinin sequences were obtained from 1078 A/H1N1 and 1033 A/H3N2 viruses. We used phylodynamics to construct high resolution spatio-temporal phylogenetic hemagglutinin trees and estimated global influenza A effective reproductive numbers (R) over time (2009-2013). We demonstrate that R oscillates around R = 1 with a clear opposed alternation pattern between phases of the A/H1N1 and A/H3N2 subtypes. Moreover, we find a similar alternation pattern for the number of global viral spread between the sampled geographical locations. Both observations suggest a between-strain competition for susceptible hosts on a global level. Extrinsic factors that affect person-to-person transmission are a major driver of influenza seasonality. The data presented here indicate that cross-reactive host immunity is also a key intrinsic driver of influenza seasonality, which determines the influenza A virus strain at the onset of each epidemic season.


Conflict of interest statement

JDZ is employed by F. Hoffmann-La Roche Ltd. AO and MS have had both paid and unpaid consultancies with public and private entities. All other authors have no conflict of interests.

Figures

Figure 1
Figure 1
Spatio-temporal resolved phylogenies reveal intrinsic evolutionary influenza dynamics. Influenza hemagglutinin tree inferred by birth–death skyline phylodynamic modelling using 1078 (A/H1N1) (A) and 1033 (A/H3N2) (B) complete gene sequences. Distribution of average trunk-to-tips branch lengths of A/H1N1 (C) and A/H3N2 (D) phylogenetic trees.
Figure 2
Figure 2
Network reconstruction of viral spread between the sampled geographic locations show increased spread of influenza A/H1N1 (bottom row) compared with influenza A/H3N2 (top row) between 2009–2011, followed by an opposite trajectory between 2011–2013. Inferred viral spread networks between geographic locations are depicted between centers located in Asia (red), Europe (orange), North America (blue) and Pacific (purple). Viral spread events during a 1-year time window were pooled and numbers were shown on the arrows. The diameter of the nodes is proportional to the number of sink viral spread events, while the arrow width is proportional to the number of source spread events. The Quade test and correspondent post-hoc procedures were applied to test significant differences between spread trends and preferred viral spread trajectories are presented at the top. Significance level was set to 0.05.
Figure 3
Figure 3
Oscillation of reproductive number R-skylines estimated from influenza A virus phylogenies with opposed alternation of phases between subtypes. Time-series (2009–2013) for influenza A/H1N1 (blue, n = 1078) and A/H3N2 (red, n = 1033) viruses. Pre-pandemic period is indicated with dashed lines. Shaded regions represent 95% Highest Posterior Density interval.
Figure 4
Figure 4
Opposed alternation of influenza A virus viral spread events. Total number of viral spread events between different geographical locations of influenza A/H1N1 (blue, n = 190) and A/H3N2 (red, n = 146) viruses were pooled by 1-year intervals from the start of the 2009 pandemic. Viral spread counts were performed by traversing the fully-spatiotemporal-resolved phylogenetic trees in post-order.

References

    1. Ferguson N, Anderson R, Gupta S. The effect of antibody-dependent enhancement on the transmission dynamics and persistence of multiple-strain pathogens. Proc. Natl. Acad. Sci. U.S.A. 1999;96:790–794. doi: 10.1073/pnas.96.2.790. - DOI - PMC - PubMed
    1. Altizer S, et al. Seasonality and the dynamics of infectious diseases. Ecol. Lett. 2006;9:467–484. doi: 10.1111/j.1461-0248.2005.00879.x. - DOI - PubMed
    1. Hope-Simpson RE. The role of season in the epidemiology of influenza. J. Hyg. 1981;86:35–47. doi: 10.1017/S0022172400068728. - DOI - PMC - PubMed
    1. Tamerius J, et al. Global influenza seasonality: Reconciling patterns across temperate and tropical regions. Environ. Health Perspect. 2011;119:439–445. doi: 10.1289/ehp.1002383. - DOI - PMC - PubMed
    1. Viboud C, et al. Synchrony, waves, and spatial hierarchies in the spread of influenza. Science. 2006;312:447–451. doi: 10.1126/science.1125237. - DOI - PubMed

Publication types