. 2022 Nov;29(11):2316-2331.
doi: 10.1038/s41418-022-01018-8. Epub 2022 May 25.

Plin2-mediated lipid droplet mobilization accelerates exit from pluripotency by lipidomic remodeling and histone acetylation

Affiliations

Plin2-mediated lipid droplet mobilization accelerates exit from pluripotency by lipidomic remodeling and histone acetylation

Yi Wu et al. Cell Death Differ. 2022 Nov.

Abstract

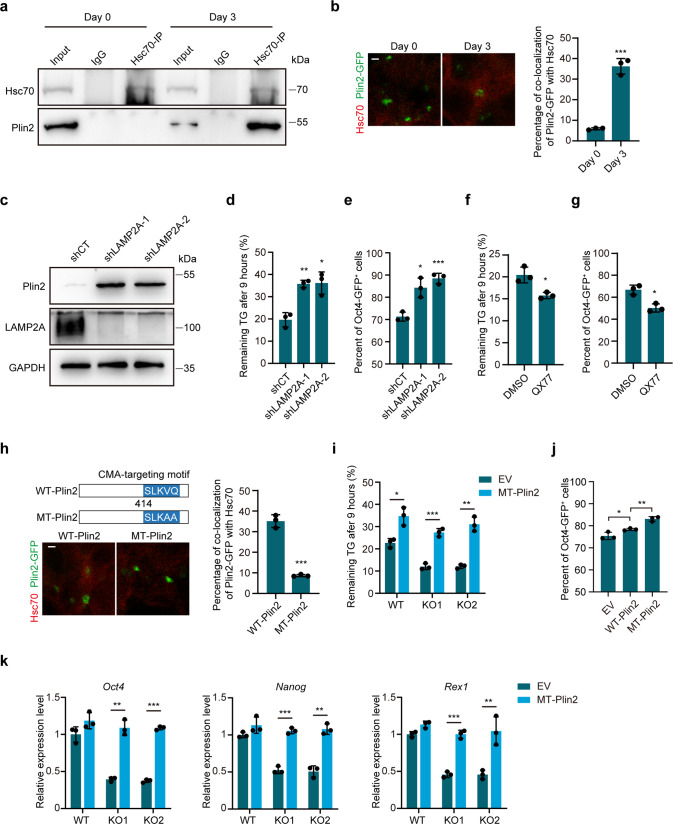
Metabolic switch is critical for cell fate determination through metabolic functions, epigenetic modifications, and gene expression. However, the mechanisms underlying these alterations and their functional roles remain unclear. Here, we show that Plin2-mediated moderate lipid hydrolysis is critical for pluripotency of embryonic stem cells (ESCs). Upon exit from pluripotency, lipid droplet (LD)-associated protein Plin2 is recognized by Hsc70 and degraded via chaperone-mediated autophagy to facilitate LD mobilization. Enhancing lipid hydrolysis by Plin2 knockout promotes pluripotency exit, which is recovered by ATGL inhibition. Mechanistically, excessive lipid hydrolysis induces a dramatic lipidomic remodeling characterized by decreased cardiolipin and phosphatidylethanolamine, which triggers defects in mitochondrial cristae and fatty acid oxidation, resulting in reduced acetyl-CoA and histone acetylation. Our results reveal how LD mobilization is regulated and its critical role in ESC pluripotency, and indicate the mechanism linking LD homeostasis to mitochondrial remodeling and epigenetic regulation, which might shed light on development and diseases.


Conflict of interest statement

The authors declare no competing interests.

Figures

Fig. 1
Fig. 1. Plin2-dependent lipid droplets delay exit from pluripotency.
a Schematic demonstrating the structure of lipid droplets and the main tissue distribution of perilipin family proteins: WAT white adipose tissue, BAT brown adipose tissue, MSC mesenchymal stem cell. b qRT-PCR analysis of expression of perilipin genes (Plin1, Plin2, Plin3, Plin4, Plin5) in MEF and mESC. Data are mean ± SD, n = 3 biological replicates. Two-tailed unpaired t-tests. ***P < 0.001, **P < 0.005. c qRT-PCR analysis of expression of Plin2, Plin3 and Oct4 during reprogramming of MEFs and spontaneous differentiation of mESCs. Data are mean ± SD, n = 3 biological replicates. d Western blot analysis of Plin2 and Oct4 during reprogramming of MEFs and spontaneous differentiation of mESCs. The experiments were repeated independently three times with similar results. e Immunofluorescence staining of Plin2 (Red) during reprogramming of MEFs and spontaneous differentiation of mESCs. Scale bar, 25 μm. The experiments were repeated independently three times with similar results. f Representative histograms and MFI values of BODIPY 493/503 during reprogramming of MEFs and spontaneous differentiation of mESCs. Data are mean ± SD, n = 3 biological replicates. Two-tailed paired t-tests. ***P < 0.001, **P < 0.005, *P < 0.05. g Schematic depicting experimental design to reduce lipid droplets in mESCs and western blot analysis of Plin2 in WT and Plin2-/- mESCs (KO1 and KO2). The experiments were repeated independently twice with similar results. h Representative images of Oil Red O staining in WT and Plin2-/- mESCs (KO1 and KO2). Scale bar, 100 μm. The experiments were repeated independently three times with similar results. i Triglyceride (TG) content in WT and Plin2-/- mESCs (KO1 and KO2). Data are mean ± SD, n = 3 biological replicates. Two-tailed unpaired t-tests. *P < 0.05. j Representative phase-contrast images and the expression of genes associated with naive pluripotency (Rex1, Tbx3, Klf4) and primed pluripotency (Fgf51, Otx2, Foxa2) of WT and Plin2-/- mESCs (KO1 and KO2) during naive-primed transition on day 5. Scale bar, 100 μm. Data are mean ± SD, n = 3 biological replicates. Two-tailed unpaired t-tests. ***P < 0.001. k Representative phase-contrast and Oct4-GFP images and the expression of pluripotency markers (Oct4, Nanog, Rex1) of WT and Plin2-/- mESCs (KO1 and KO2) on day 3 of differentiation. Scale bar, 100 μm. Data are mean ± SD, n = 3 biological replicates. Two-tailed unpaired t-tests. ***P < 0.001.
Fig. 2
Fig. 2. Plin2 safeguards pluripotency by suppressing lipid hydrolysis.
a Representative histograms and MFI values of BODIPY 493/503 of undifferentiated mESCs (day 0) and differentiating mESCs (day 3) at the indicated time points during the hydrolysis assay as shown at the top left. Data are mean ± SD, n = 3 biological replicates. Two-tailed paired t-tests. ***P < 0.001. b TG content in undifferentiated mESCs (day 0) and differentiating mESCs (day 3) at the indicated time points during the hydrolysis assay. Remaining TG is expressed as a percentage of the TG content at 0 h. Data are mean ± SD, n = 3 biological replicates. Two-tailed unpaired t-tests. ***P < 0.001, *P < 0.05. c TG content in WT and Plin2-/- mESCs (KO1 and KO2) at the indicated time points during the hydrolysis assay. Remaining TG is expressed as a percentage of the TG content at 0 h. Data are mean ± SD, n = 3 biological replicates. Two-tailed unpaired t-tests. ***P < 0.001, **P < 0.005, *P < 0.05. d Flow cytometry analysis and quantification of Oct4-GFP+ cells in WT and Plin2-/- mESCs (KO1 and KO2) on day 3 of differentiation treated with DMSO or ATGLi (10 μM Atglistatin). Data are mean ± SD, n = 3 biological replicates. Two-tailed unpaired t-tests. ***P < 0.001. e qRT-PCR analysis of expression of pluripotency markers (Oct4, Nanog, Rex1) in WT and Plin2-/- mESCs (KO1 and KO2) on day 3 of differentiation treated with DMSO or ATGLi (10 μM Atglistatin). Data are mean ± SD, n = 3 biological replicates. Two-tailed unpaired t-tests. ***P < 0.001, **P < 0.005.
Fig. 3
Fig. 3. Plin2 is recognized by Hsc70 and degraded via chaperone-mediated autophagy to facilitate LD mobilization.
a CO-IP of Plin2 and Hsc70 in undifferentiated (day 0) and differentiating mESCs (day 3). The experiments were repeated independently twice with similar results. b Representative images and quantification of the co-localization of Plin2-GFP with Hsc70 in undifferentiated (day 0) and differentiating mESCs (day 3). Scale bar, 5 μm. Data are mean ± SD, n = 3 independent experiments from 30 cells. Two-tailed unpaired t-tests. ***P < 0.001. c Western blot analysis of Plin2 in differentiating mESCs (day 3) transfected with control vector (shCT) or two different shRNAs against LAMP2A. The experiments were repeated independently twice with similar results. d Remaining TG content in differentiating mESCs (day 3) transfected with shCT or shRNAs against LAMP2A. Remaining TG is expressed as a percentage of the TG content at 0 h in the hydrolysis assay. Data are mean ± SD, n = 3 biological replicates. Two-tailed unpaired t-tests. **P < 0.005, *P < 0.05. e Quantification of Oct4-GFP+ cells by flow cytometry in mESC transfected with shCT or shRNAs against LAMP2A on day 3 of differentiation. Data are mean ± SD, n = 3 biological replicates. Two-tailed unpaired t-tests. ***P < 0.001, *P < 0.05. f Remaining TG content in differentiating mESCs (day 3) treated with DMSO or QX77. Data are mean ± SD, n = 3 biological replicates. Two-tailed unpaired t-tests. *P < 0.05. g Quantification of Oct4-GFP+ cells by flow cytometry in mESC treated with DMSO or QX77 on day 3 of differentiation. Data are mean ± SD, n = 3 biological replicates. Two-tailed unpaired t-tests. *P < 0.05. h Schematic depicting the construct of wild-type (WT) and CMA-resistant (MT) Plin2 and representative images and quantification of the co-localization of Plin2-GFP with Hsc70 in differentiating mESCs (day 3) transfected with WT-Plin2-GFP or MT-Plin2-GFP. Scale bar, 5 μm. Data are mean ± SD, n = 3 independent experiments from 30 cells. Two-tailed unpaired t-tests. ***P < 0.001. i Remaining TG content in WT and Plin2-/- mESCs (KO1 and KO2) transfected with empty vector (EV) or MT-Plin2 on day 3 of differentiation. Data are mean ± SD, n = 3 biological replicates. Two-tailed unpaired t-tests. ***P < 0.001, **P < 0.005, *P < 0.05. j Quantification of Oct4-GFP+ cells by flow cytometry in mESC transfected with EV, WT-Plin2 or MT-Plin2 on day 3 of differentiation. Data are mean ± SD, n = 3 biological replicates. Two-tailed unpaired t-tests. **P < 0.005, *P < 0.05. k qRT-PCR analysis of expression of pluripotency markers (Oct4, Nanog, Rex1) in WT and Plin2-/- mESCs (KO1 and KO2) transfected with EV or MT-Plin2 on day 3 of differentiation. Data are mean ± SD, n = 3 biological replicates. Two-tailed unpaired t-tests. ***P < 0.001, **P < 0.005.
Fig. 4
Fig. 4. Loss of Plin2 induces lipidomic remodeling associated with impaired mitochondrial cristae and FAO.
a Principal component analysis (PCA) of lipidomic data from WT and Plin2-/- mESCs (KO1 and KO2). Each dot represents a biological replicate. b Volcano plot of differential lipid molecules between WT and Plin2-/- mESCs (KO1 and KO2). Dot size reports P value, while the color indicates fold change (FC). Lipid molecules with P < 0.05 and FC > 1.5 are considered statistically significant. The top 10 lipid molecules with FC > 2.5 are indicated. c CL, PE, and PC contents in mitochondria of WT and Plin2-/- mESCs (KO1 and KO2). Data are mean ± SD, n = 3 biological replicates. Two-tailed unpaired t-tests. ***P < 0.001, **P < 0.005, *P < 0.05. d Oxygen consumption rates (OCR) and maximal mitochondrial respiration in WT and Plin2-/- mESCs (KO1 and KO2). Maximal mitochondrial respiration was determined by the increase of OCR after FCCP treatment. Data are mean ± SEM, n = 2 biological replicates with three technical replicates each. Two-tailed unpaired t-tests. ***P < 0.001. e Endogenous fatty acid oxidation (FAO) rates and maximal endogenous FAO in WT and Plin2-/- mESCs (KO1 and KO2). Maximal endogenous FAO was determined by the increase of OCR after Eto treatment in a substrate-limited assay medium. Data are mean ± SEM, n = 3 biological replicates with three technical replicates each. Two-tailed unpaired t-tests. ***P < 0.001, *P < 0.05. f Exogenous FAO rates and maximal exogenous FAO in WT and Plin2-/- mESCs (KO1 and KO2). Maximal exogenous FAO was determined by the increase of OCR after PA treatment in a substrate-limited assay medium. Data are mean ± SEM, n = 3 biological replicates with three technical replicates each. Two-tailed unpaired t-tests. ***P < 0.001. g Representative TEM images of mitochondria and quantification of mitochondria with disorganized cristae in WT and Plin2-/- mESCs (KO1 and KO2). Representative mitochondria with normal or disorganized cristae are shown below. Scale bar, top: 1 μm, below: 200 nm. Data are mean ± SD, n = 3 biological replicates (each >50 mitochondria). Two-tailed unpaired t-tests. **P < 0.005, *P < 0.05. h Pie charts of mitochondrial proteomic data showing proportion of mitochondrial proteins changed significantly (P < 0.05 and FC > 1.5) in Plin2-/- mESCs (KO1 and KO2) compared with WT mESCs. Mitochondrial proteins are divided into four categories according to their distribution (inner membrane, outer membrane, matrix or intermembrane space). The experiments were repeated twice with similar results, and one replicate was used for this analysis. i Quantification of mitochondria with disorganized cristae in WT and Plin2-/- mESCs (KO1 and KO2) transfected with EV or MT-Plin2. Data are mean ± SD, n = 3 biological replicates (each >50 mitochondria). Two-tailed unpaired t-tests. **P < 0.005. j Maximal mitochondrial respiration in WT and Plin2-/- mESCs (KO1 and KO2) transfected with EV or MT-Plin2. Data are mean ± SEM, n = 3 independent experiments. Two-tailed unpaired t-tests. ***P < 0.001, **P < 0.005.
Fig. 5
Fig. 5. Loss of Plin2 reduces acetyl-CoA and histone acetylation in mESCs.
a Heatmap showing the relative levels of metabolites involved in glycolysis, the pentose phosphate pathway, the citric acid cycle, and nucleotides in WT and Plin2-/- mESCs (KO1 and KO2) on day 0 and day 3 of differentiation. Data are represented as z-score calculated from mean of three biological replicates. b Acetyl-CoA content in WT and Plin2-/- mESCs (KO1 and KO2) on day 0 and day 3 of differentiation. Data are represented as mean ± SD, n = 3 biological replicates. Two-tailed unpaired t-tests. **P < 0.005. c The fraction of M+2 acetyl-CoA in WT and Plin2-/- mESCs (KO1 and KO2) cultured with [U-13C16] palmitic acid for 24 h. Data are mean ± SD, n = 3 biological replicates. Two-tailed unpaired t-tests. **P < 0.005. d Western blot analysis of histone acetylation and quantification of relative H3K27ac levels in WT and Plin2-/- mESCs (KO1 and KO2) on day 3 of differentiation. Data are mean ± SD, n = 3 biological replicates. Two-tailed unpaired t-tests. **P < 0.005. e Normalized signal intensity of H3K27ac-associated genes from ChIP-seq data of WT and Plin2-/- mESCs (KO1 and KO2) on day 3 of differentiation. The experiments were repeated independently twice with similar results, and one biological replicate was used for analysis. f Pie charts of ChIP-seq data showing the proportions of pluripotency genes (112) and differentiation genes (167) with decreased H3K27ac levels (green portion) and unchanged or increased H3K27ac (blue portion) in WT and Plin2-/- mESCs (KO1 and KO2) on day 3 of differentiation. The experiments were repeated independently twice with similar results, and one biological replicate was used for analysis. g Normalized signal intensity of H3K27ac on pluripotency genes from ChIP-seq data of WT and Plin2-/- mESCs (KO1 and KO2) on day 3 of differentiation. The experiments were repeated independently twice with similar results, and one biological replicate was used for analysis. h H3K27ac enrichment around selected pluripotency genes (Oct4, Nanog, and Rex1) from ChIP-seq data of WT and Plin2-/- mESCs (KO1 and KO2) on day 3 of differentiation. The experiments were repeated twice with similar results, and one biological replicate was used for analysis. i Acetyl-CoA content in WT and Plin2-/- mESCs (KO1 and KO2) transfected with EV or MT-Plin2. Data are represented as mean ± SD, n = 3 biological replicates. Two-tailed unpaired t-tests. ***P < 0.001. j Western blot analysis and quantification of relative H3K27ac levels in WT and Plin2-/- mESCs (KO1 and KO2) transfected with EV or MT-Plin2 on day 3 of differentiation. Data are mean ± SD, n = 3 biological replicates. Two-tailed unpaired t-tests. **P < 0.005, *P < 0.05. k ChIP-qPCR analysis of H3K27ac enrichment on promoter regions of selected pluripotency genes (Oct4, Nanog, and Rex1) in WT and Plin2-/- mESCs (KO1 and KO2) transfected with EV or MT-Plin2 on day 3 of differentiation. Data are mean ± SD, n = 2 independent experiments from two primers. Two-tailed unpaired t-tests. ***P < 0.001, **P < 0.005, *P < 0.05.
Fig. 6
Fig. 6. Enhanced lipid hydrolysis is responsible for phospholipid remodeling and mitochondrial defects in Plin2-/- mESCs.
a CL, PE, and PC contents in mitochondria of WT and Plin2-/- mESCs (KO1 and KO2) treated with DMSO or ATGLi (10 μM Atglistatin). Data are mean ± SD, n = 3 biological replicates. Two-tailed unpaired t-tests. ***P < 0.001, **P < 0.005. b Representative TEM images of mitochondria and quantification of mitochondria with disorganized cristae in WT and Plin2-/- mESCs (KO1 and KO2) treated with DMSO or ATGLi (10 μM Atglistatin). Scale bar, 1 μm. Data are mean ± SD, n = 3 biological replicates (each >100 mitochondria). Two-tailed unpaired t-tests. **P < 0.005. c Maximal mitochondrial respiration in WT and Plin2-/- mESCs (KO1 and KO2) treated with DMSO or ATGLi (10 μM Atglistatin). Data are mean ± SEM, n = 3 biological replicates. Two-tailed unpaired t-tests. ***P < 0.001. d Acetyl-CoA content in WT and Plin2-/- mESCs (KO1 and KO2) treated with DMSO or ATGLi (10 μM Atglistatin). Data are mean ± SD, n = 3 biological replicates. Two-tailed unpaired t-tests. *P < 0.05. e Western blot analysis and quantification of H3K27ac levels in WT and Plin2-/- mESCs (KO1 and KO2) treated with DMSO or ATGLi (10 μM Atglistatin) on day 3 of differentiation. Data are mean ± SD, n = 3 biological replicates. Two-tailed unpaired t-tests. ***P < 0.001.
Fig. 7
Fig. 7. Model of Plin2-mediated lipid droplet mobilization in mESCs.
Plin2-mediated LD mobilization is critical for pluripotency of mESCs by coordinating phospholipid homeostasis, mitochondrial activity, and histone acetylation. LD-associated protein Plin2 protects LD from ATGL to maintain low lipid hydrolysis in mESCs. Upon exit from pluripotency, Plin2 is recognized by Hsc70 and degraded by chaperone-mediated autophagy to facilitate ATGL-mediated lipid hydrolysis. Excessive lipid hydrolysis induces a dramatic lipidomic remodeling characterized by decreased cardiolipin and phosphatidylethanolamine, which triggers defects in mitochondrial cristae and fatty acid oxidation. Impaired fatty acid oxidation results in decreased cellular acetyl-CoA content and histone acetylation, which are crucial for the expression of pluripotency genes, ultimately making mESC prone to exit from pluripotency.

References

    1. Zhang J, Zhao J, Dahan P, Lu V, Zhang C, Li H, et al. Metabolism in pluripotent stem cells and early mammalian development. Cell Metab. 2018;27:332–8. doi: 10.1016/j.cmet.2018.01.008. - DOI - PubMed
    1. Yanes O, Clark J, Wong DM, Patti GJ, Sanchez-Ruiz A, Benton HP, et al. Metabolic oxidation regulates embryonic stem cell differentiation. Nat Chem Biol. 2010;6:411–7. doi: 10.1038/nchembio.364. - DOI - PMC - PubMed
    1. Folmes CD, Nelson TJ, Martinez-Fernandez A, Arrell DK, Lindor JZ, Dzeja PP, et al. Somatic oxidative bioenergetics transitions into pluripotency-dependent glycolysis to facilitate nuclear reprogramming. Cell Metab. 2011;14:264–71. doi: 10.1016/j.cmet.2011.06.011. - DOI - PMC - PubMed
    1. Moussaieff A, Rouleau M, Kitsberg D, Cohen M, Levy G, Barasch D, et al. Glycolysis-mediated changes in acetyl-CoA and histone acetylation control the early differentiation of embryonic stem cells. Cell Metab. 2015;21:392–402. doi: 10.1016/j.cmet.2015.02.002. - DOI - PubMed
    1. Dahan P, Lu V, Nguyen RMT, Kennedy SAL, Teitell MA. Metabolism in pluripotency: both driver and passenger? J Biol Chem. 2019;294:5420–9. doi: 10.1074/jbc.TM117.000832. - DOI - PMC - PubMed

Publication types