. 2022 Jun;606(7912):137-145.
doi: 10.1038/s41586-022-04777-z. Epub 2022 May 25.

Neuropathic pain caused by miswiring and abnormal end organ targeting

Affiliations

Neuropathic pain caused by miswiring and abnormal end organ targeting

Vijayan Gangadharan et al. Nature. 2022 Jun.

Abstract

Nerve injury leads to chronic pain and exaggerated sensitivity to gentle touch (allodynia) as well as a loss of sensation in the areas in which injured and non-injured nerves come together1-3. The mechanisms that disambiguate these mixed and paradoxical symptoms are unknown. Here we longitudinally and non-invasively imaged genetically labelled populations of fibres that sense noxious stimuli (nociceptors) and gentle touch (low-threshold afferents) peripherally in the skin for longer than 10 months after nerve injury, while simultaneously tracking pain-related behaviour in the same mice. Fully denervated areas of skin initially lost sensation, gradually recovered normal sensitivity and developed marked allodynia and aversion to gentle touch several months after injury. This reinnervation-induced neuropathic pain involved nociceptors that sprouted into denervated territories precisely reproducing the initial pattern of innervation, were guided by blood vessels and showed irregular terminal connectivity in the skin and lowered activation thresholds mimicking low-threshold afferents. By contrast, low-threshold afferents-which normally mediate touch sensation as well as allodynia in intact nerve territories after injury4-7-did not reinnervate, leading to an aberrant innervation of tactile end organs such as Meissner corpuscles with nociceptors alone. Genetic ablation of nociceptors fully abrogated reinnervation allodynia. Our results thus reveal the emergence of a form of chronic neuropathic pain that is driven by structural plasticity, abnormal terminal connectivity and malfunction of nociceptors during reinnervation, and provide a mechanistic framework for the paradoxical sensory manifestations that are observed clinically and can impose a heavy burden on patients.


Conflict of interest statement

The authors declare no competing interests.

Figures
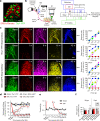
Fig. 1
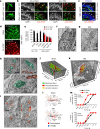
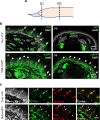
Fig. 1. Emergence of chronic neuropathic pain and allodynia after a period of complete loss of sensation as nociceptors repopulate denervated territories whereas tactile fibres do not regenerate.
a, Confocal image of DRGs, showing the segregation of YFP-expressing touch-sensitive neurons (Aβ-LTMRs; Thy1-YFP transgene) and tdTomato-expressing pain-sensing neurons (nociceptors; SNS-Cre transgene) (n = 5). Scale bar, 100 μm. b, Experimental scheme of non-invasive two photon imaging longitudinally over 42 weeks and concurrent behavioural analyses in the SNI model, which involves ligation and cutting of the tibial and common peroneal branches while leaving the sural branch intact. 2P, two-photon; d, days; w, weeks; bold number 3 indicates digit 3. c, Examples of imaging in individual Thy1-YFP mice and SNS-mGFP mice with concurrent analysis of mechanical sensitivity (von Frey force in grams) at the imaged digit 3 (middle end phalanx) longitudinally over 42 weeks after sham or SNI surgery; matching time points are indicated by using the same false colours in imaging (left) and behaviour (right). Scale bars, 200 μm. d, Quantitative summary of total length of YFP-positive Aβ-LTMRs (square symbols; n = 4 and 4 for sham and SNI, respectively; F(1,12) = 8,614.43, P = 1.63 × 10−18) and mGFP-positive nociceptors (circular symbols; n = 4 and 6 for sham and SNI, respectively; F(1,12) = 9.153, P = 0.016; two-way repeated measures ANOVA with Bonferroni multiple comparison) in the tibial innervation territory. e, Summary of changes in withdrawal thresholds to von Frey force in tibial territory digit (n = 9 per group; after 20 weeks: F(1,4) = 43.33, P = 0.00223. *P < 0.05 compared to baseline, †P < 0.05 compared to control group (sham); two-way repeated measures ANOVA with Bonferroni multiple comparison). f, Aversion to light touch in the previously insensitive tibial territory in the PEAP; the dark chamber was associated with mechanical stimulation (n = 9 for sham and n = 7 for SNI in no stimulation group, and n = 9 for sham and n = 10 for SNI in mechanical stimulation group; F(3,31) = 8.794, P = 0.000228. *P < 0.05 as compared to without mechanical stimulation, †P < 0.05 as compared to sham group; one-way repeated measures ANOVA with Bonferroni comparison). Data are mean ± s.e.m. Source data
Fig. 2
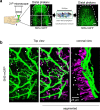
Fig. 2. During the emergence of reinnervation-induced neuropathic pain, collaterally sprouting nociceptors of sural origin precisely replicate the original trajectories of tibial nociceptors along blood vessels but do not invade the epidermis.
a, Comparison of the original innervation with tibial nociceptors (green) and invading sural nociceptors (false coloured in red) at 42 weeks after nerve injury; representative images of mouse 631, out of 6 similar results from experiments in 6 mice. Scale bar, 50 μm. b, Dual-colour multiphoton imaging of Texas-red-dextran-labelled blood vessels with YFP-positive Aβ fibres (right) and GFP-labelled nociceptors (left) in the tibial territory. Scale bars, 25 µm. Representative images, out of 6 similar results from experiments in 3 sham and 3 SNI mice. c, Processed 3D stacks of in vivo multiphoton images showing complete innervation pattern of a single hind paw digit by YFP-positive Aβ-LTMRs and mGFP-expressing nociceptors; arrows indicate specialized endings with Meissner-corpuscle-like morphology and arrowheads indicate intra-epidermal free endings (n = 4). Scale bars, 100 µm. d, Segmentation of intra-epidermal free endings (false coloured in purple; arrowheads) of nociceptors from their afferent branches (green) (n = 4). Scale bar, 25 µm. e, f, Quantitative summary (e) and typical example (f) demonstrating the lack of epidermal invasion (arrowheads in f) of collaterally sprouting sural nociceptors in the tibial territory, expressed as a percentage fraction of baseline values (n = 4 and 4 for sham and SNI, respectively; groups F(1,12) = 1,429.65, P = 7.53 × 10−14; two-way repeated measures ANOVA with Bonferroni multiple comparison).*P < 0.05, as compared to basal values; †P < 0.05, as compared to sham group. Data are mean ± s.e.m. Scale bar, 100 µm. Source data
Fig. 3
Fig. 3. Nociceptors pathologically switch to a tactile low-threshold fibre phenotype after collateral sprouting into denervated skin.
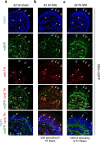
ad, High-magnification in vivo multiphoton images (a, d) and confocal images (b, c) of YFP-positive Aβ-LTMR fibres (expressing NF200 in c; n = 4) and mGFP-expressing nociceptors (bottom) at Meissner-like structures (arrowheads; expressing S100; n = 4) and nociceptor free endings in the tibial territory of control mice and after SNI (bd). Scale bars, 25 μm (a); 50 μm (b, c); 100 μm (d). e, Quantitative overview of sensory afferent terminations at S100-expressing Meissner corpuscles in the tibial territory at 42 weeks after SNI or sham (n = 10 per group; for groups F(1,5) = 225.321, P = 2.37 × 10−5; two-way ANOVA with Bonferroni multiple comparison). SP, substance P. fk, Ultrastructural high-resolution 3D analyses in the tibial territory 24–28 weeks after SNI (g, i, k) or in control mice (f, h, j) showing dermal nerves (f, g) and Meissner corpuscles (hk). Images show myelinated axons (black arrowheads) and their terminations (false coloured in green) or unmyelinated axons (black arrows) and their terminations (false coloured in red) and glial cell lamellae (white arrowheads) in Meissner corpuscles (n = 3 SNI and 3 control mice). Scale bars, 5 μm (f, g, h (top left), i (top left); 1 μm (h (top right and bottom), i (top right and bottom). j, k, Full 3D reconstruction of Meissner innervation showing terminations of unmyelinated fibres (false coloured in red), myelinated fibres (false coloured in green) and glial cell lamellar wrapping (false coloured in yellow) in control (https://wklink.org/8342) and SNI (https://wklink.org/8231) mice. l, Electrophysiological single-fibre recordings demonstrating receptive fields of C-fibres (red dots) and Aβ-LTMRs (blue dots) in the sural nerve after stimulation of the tibial territory (n = 12 fibres each from 3 sham and 3 SNI mice). m, Single-fibre recordings showing C-fibre recruitment by tactile stimuli in denervated tibial territory, but not in the intact sural territory (n = 8 fibres each from 6 control and 5 SNI mice). P values derived from chi square analysis for tibial territory (P = 1.25 × 10−6) and for sural territory (P = 0.1255). Data are mean ± s.e.m. Source data
Fig. 4
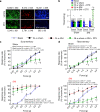
Fig. 4. Genetic ablation experiments reveal a causal role for nociceptors in reinnervation-induced chronic neuropathic allodynia.
a, In mice with DTX-induced ablation of nociceptors (SNS-DTR), examples and quantitative estimate of large-diameter NF200-positive neurons (left; n = 3 per group, degrees of freedom (DF) = 2.897, t = 1.941, P = 0.124), CGRP-positive peptidergic nociceptors (middle; n = 3 per group, DF = 2.802, t = 11.179, P = 0.000365) and non-peptidergic isolectin B4 (IB4)-binding nociceptors (n = 3 per group, DF = 2.149, t = 31.750, P = 5.87 × 10−6) after treatment with vehicle or DTX (two-tailed t-test). Numbers of DRG neurons from three mice per treatment are shown. Scale bar, 100 μm. bd, Nociceptor ablation significantly decreases mechanical nociception and reverses reinnervation-induced allodynia in the tibial territory (b, d), but not allodynia in the intact sural territory (b, c), as demonstrated by analysis of response thresholds (b) and response rates (c, d) to mechanical stimulation. In b, n = 8 per group; groups F(3,6) = 25.234, P = 0.000842; treatment F(2,6) = 10.001, P = 0.0122; groups × treatment F(6,56) = 12.525, P = 6.74 × 10−9. In c (sural territory): n = 8 per group; for sham (top part): groups F(2,12) = 1.798, P = 0.202; for SNI (bottom part): groups F(2,12) = 93.888, P = 4.697 × 10−8). In d (tibial territory): n = 8 per group; for sham (top part): groups F(2,12) = 2.226, P = 0.145; for SNI (bottom part): groups F(2,12) = 29.514, P = 2.32 × 10−5); these P values correspond to group P values (P values shown within the figure refer to comparisons between pairs of treatment group (that is, individual pairs from three different groups)). In all panels, *P < 0.05 compared to baseline, †P < 0.05 compared to before DTX application, two-way repeated measures ANOVA with Bonferroni multiple comparison in b, c. Data are mean ± s.e.m. Source data
Extended Data Fig. 1
Extended Data Fig. 1. Comprehensive characterization of the neurochemical identity of fluorescently marked cells in the DRGs of Thy1-YFP mice and SNS-tdTomato mice.
(a) Confocal images of YFP and Tomato expression are shown with immunohistochemical staining of diverse sensory neuron populations. Scale bar = 100 µm. (b) Quantitative degree of co-localization with markers of distinct classes of DRG neurons (n = 5 mice/group). (c) Quantification of lack of colocalization of Thy1-labelled and tdTomato-labelled neuronal population mice in double-transgenic mice. (n = 5 mice/group). Data shown as mean ± S.E.M. Source data
Extended Data Fig. 2
Extended Data Fig. 2. Development of late-onset, chronic neuropathic pain after a period of complete loss of sensitivity in denervated skin of mice with nerve injury, referred to henceforth as reinnervation-induced neuropathic pain.
(a, b) In the SNI model, intense mechanical allodynia develops in the territory of the undamaged sural nerve, as previously described, as evidenced by drop in response threshold to application of graded mechanical force via von Frey hairs to the plantar surface of the hind paw. Shown are data from the digit (a) and central part of the paw plantar surface (upper panel in b) in the sural territory. In a N = 9 per group: F(1,12) = 329.423, P = 4.31E-10. As expected, mice initially show a complete loss of sensitivity in the territory of the ligated and severed tibial nerve, recover sensitivity around 12 weeks post-SNI and unexpectedly show marked reduction in mechanical response threshold as of 16 weeks post-SNI. In b (lower panel), data from the central paw surface in the tibial territory are shown, complementary to data from the corresponding digit shown in main Fig. 1e. N = 9 per group; sural territory: F(1,12) = 284.970, P = 9.99E-10; tibial territory after 20 weeks: F(1,4) = 86.057, P = 0.00075; In a, b,* represents p < 0.05 compared to baseline, †p < 0.05 compared to control group (sham), two-way repeated measures ANOVA with Bonferroni multiple comparison. Data shown as mean ± S.E.M. (c, d) Passive escape avoidance behaviour after application of 0.16 g von Frey force to the tibial innervation territory (middle digit) either ipsilateral to the nerve injury in the dark chamber at 24 weeks post sham- or SNI surgery. Shown are schematic overview (c), one typical example each from SNI and sham mice (d), complementary to main Fig. 1f. (e) Increased duration of nocifensive responses to acetone, demonstrating significant cold allodynia in undamaged sural territory and the denervated tibial territory after collateral sprouting at 24-26 weeks post-SNI (N = 8 for sham and 14 for SNI; sural territory: t = 4.27, df = 20, F = 33.91, P = 0.00037; tibial territory: t = 2.392, df = 20, F = 13.91, P = 0.0266; *p < 0.05; two-tailed unpaired t test). Source data
Extended Data Fig. 3
Extended Data Fig. 3. Alterations in tibial innervation territory (middle digit) after loss of tibial and common peroneal nerves through SNI.
(a) Schematic representation of multiphoton non-invasive imaging in tibial digit (3rd digit) (right panel). At day 3 after SNI, both large diameter sensory fibres (YFP-positive) and nociceptive fibres (mGFP-positive) are fully lost in the respect transgenic mouse lines (left panel) (N = 4). (b) After degeneration of YFP-positive fibres in Thy1-YFP mice, YFP fluorescence is seen in cell-like structures; by 30-36 weeks, there is faint re-emergence of YFP fluorescence in a few medium-diameter nerves although the large fibres ending in Meissner corpuscles are still missing. (N = 4) (c) High magnification view of YFP-expressing cells, which show a stellate morphology resembling dendritic-type immune cells (N = 2); see Supplementary Note 1 for details. (d) YFP-positive cells found in the vicinity of blood vessels labelled via Texas-red-conjugated Dextran (N = 2). Scale bar = 100 µm in a, b, d and 50 µm in c.
Extended Data Fig. 4
Extended Data Fig. 4. Further demonstration of the absence of reinnervation with Aβ-LTMR and recovery of nociceptor innervation with the emergence of reinnervation-induced neuropathic pain in the tibial territory through co-immunostaining with endogenous marker proteins.
(a, b) Example confocal images represent the skin of the area at the centre of the hind paw in panel a and the digit in the tibial nerve territory in panel b. Both panels show nociceptors expressing mGFP in SNS-mGFP mice that repopulate the tibial innervation territory at the at 42 weeks post-SNI or sham surgery. Large diameter (Aβ) fibres are identified via immunostaining for Neurofilament 200 (NF200) in panel a and peptidergic nociceptors are identified via immunostaining for the peptidergic nociceptor marker, calcitonin gene related peptide (CGRP) in panel b. Hoechst dye (blue) was used to counterstain nuclei in panel b. In all panels, arrowheads represent intra-epidermal nerve fibres. Taken together, both panels show that collaterally sprouting nociceptors arrive at dermal-epidermal border in SNI mice, despite a loss of NF200-immunoreactive Aβ fibres; however, they do not enter the epidermis (arrowheads). These images complement with endogenous markers of sensory afferents the data shown with transgenic fluorescent markers in main Fig.1d and Fig. 2e, f.
Extended Data Fig. 5
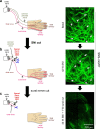
Extended Data Fig. 5. Analysis establishing the sural origin of GFP-expressing fibres that populate the denervated tibial territory after SNI.
Experimental steps are schematically shown on the left and the corresponding multiphoton analyses are shown on the right. (a) Innervation pattern of mGFP-expressing nociceptive nerves in the middle digit (tibial territory) in SNS-mGFP prior to SNI. (b) Sprouted mGFP-positive fibres that repopulate the denervated territory when analysed at 42 weeks post-SNI. (c) Complete loss of GFP-expressing fibres in the same mouse 1 week after transection of the sural nerve at 42 W post-SNI, demonstrating the sural origin of the collaterally sprouted nociceptive fibres in the denervated tibial territory (N = 2). Scale bar = 200 µm.
Extended Data Fig. 6
Extended Data Fig. 6. Workflow for quantitative analyses of sensory fibres in in vivo multiphoton imaging datasets.
(a) Workflow used for extraction of signals over background in two photon imaging of individual digits in mouse hind paw. Examples show skin afferents of mice with SNS-Cre-derived expression of membrane GFP expression (mGFP) in small-diameter nociceptors. (b) Segmentation of free endings (shown in false colour purple, arrowheads) of mGFP-labelled nociceptors and their delineation from afferent branches (shown in green) in top view and transverse view, which enabled 3D quantitative analyses (N = 4). This figure is complementary to main Fig. 2c, d.
Extended Data Fig. 7
Extended Data Fig. 7. Analysis of precise termination patterns of labelled nociceptors and Aβ-LTMRs in the hind paw skin of SNS-mGFP and Thy1-YFP mice, respectively.
(a) Schematic representation of parts of the paw digit where sensory fibre terminations were studied. (b) Upper panels show labelling of Aβ-LTMRs in Thy1-YFP mice. Shown are DAPI-stained images depicting the dermal invaginations into the epidermis (arrows, left panels), harbouring YFP-expressing large diameter fibres ending in Meissner corpuscles (arrowheads, left panels) in distal regions (i) and YFP-expressing fibres more proximally (ii) in the digits (right panels). Lower panels show terminations of labelled nociceptors in SNS-mGFP mice in form of mesh-like structures surrounding Meissner corpuscles at dermal invaginations in DAPI-stained images distally (i) and epidermal free nerve endings (arrowheads) distally (i) and proximally (ii). (c) Anti-S100 immunohistochemistry to identify Meissner corpuscles (arrows) in paw sections of Thy1-YFP and SNS-mGFP mice (N = 4). Arrowheads indicate free nerve endings. Panel c is a more complete representation of main Fig. 3b.
Extended Data Fig. 8
Extended Data Fig. 8. Further demonstration of loss of Aβ-LTMR terminations and recovery of nociceptor terminations at Meissner corpuscle zones in the tibial territory of mice with SNI through co-immunostaining with endogenous marker proteins.
(a) Confocal analyses showing recovery of collaterally sprouted nociceptor terminations (SNS-mGFP) at Meissner zones, whereas Aβ-LTMR innervation is lost as seen with native marker protein NF200 in the tibial territory post-SNI. These images correspond to the overlay image shown in main Fig. 3c. (b) Both YFP fluorescence as well as NF200-expressing terminations are lost, whereas collaterally sprouted nociceptors expressing the peptide CGRP are seen in the Meissner zone at the dermis–epidermis border in the tibial territory 42 weeks post-SNI. These examples extend the data shown in main Fig. 3b, e (N = 4). (c) Complementary to the quantitative summary shown in main Fig. 3d, this panel shows Meissner corpuscle cells identified via S100-immunoreactivity that are seen in close proximity of collaterally sprouted mGFP-expressing nociceptors in tibial territory of SNI mice (42 weeks) and sham controls, of which some are Substance P-negative (arrowheads) and some are Substance P-positive (arrows) (N = 4).
Extended Data Fig. 9
Extended Data Fig. 9. C-LTMRs in denervated tibial territories in mice at 42 weeks after SNI.
Examples of immunostaining for tyrosine hydroxylase (TH), a marker of C-LTMRs, which also stains sympathetic fibres, at 42 weeks after sham (a) and SNI (b, c) treatment in SNS-mGFP mice. Shown are examples of SNI mice (2 out of 8 mice) which showed ectopic presence of TH-expressing fibres at the dermal border (arrows in b) and SNI mice (6 out of 8 mice) that did not show any differences to sham-treatment (c). Scale bar = 50 µm.
Extended Data Fig. 10
Extended Data Fig. 10. Electrophysiological single-fibre recordings from skin nerve preparation from sural or tibial nerve with attached paw skin after mechanical stimulation over the sural (intact) and tibial (denervated) territories in mice at 24 weeks after SNI as compared to sham-treated mice.
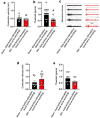
(ac) C-fibres identified via measurement of conduction velocity (a) and typical examples of evoked C-fibre responses in the tibial (sham) or sural (SNI) nerve after stimulation of the tibial territory (c) are shown. C-fibre response thresholds after stimulation of sural or tibial territories as indicated are shown (b). In panels a and b, N = 12 fibres from 3 sham mice and 12 fibres from 3 SNI mice; Unpaired two-tailed t-test; P = 0.4673, t = 0.74, df = 20, F = 1.37; in panel a and P = 0.00147, t = 3.68, df = 20, F = 5.55 in panel b. (d, e) Conduction velocity (d) and response threshold (e) of evoked C-fibre responses in the sural nerve (sham and SNI) after stimulation of the sural territory. In d and e, N = 8 fibres each from 6 sham and 5 SNI mice. Unpaired two-tailed t-test; P = 0.2362, t = 1.23, df = 14, F = 1.758 in panel d and P = 0.1788, t = 1.42, df = 14, F = 2.724 in panel e. Data are shown as mean ± S.E.M. This figure extends the data shown in main Fig. 3l, m. Source data
Extended Data Fig. 11
Extended Data Fig. 11. Analysis of potential immune cell accumulation in injured and uninjured nerve territories at the time of emergence of reinnervation neuropathic allodynia.
Typical examples (a, c) and quantification (b, d) demonstrating lack of immune cell infiltration and accumulation in the tibial or sural nerve territories at 24-26 weeks post-SNI, using tissue from hind paw inflamed with Complete Freund’s Adjuvant (CFA) as positive controls. Shown are data with anti-Gr1 immunohistochemistry to identify macrophages (a, b; arrows in a) and anti-CD4/CD8 to identify T-cells (c, d; arrows in c). In both cases, N = 2–3 sections each from the 4 mice for sham-sural, 6 mice for sham-tibial group, 5 mice each from SNI-sural and SNI-tibial groups and 2 mice injected with CFA. ROI: region of interest. Source data
Extended Data Fig. 12
Extended Data Fig. 12. Effects of pharmacological inhibition of classical mediators of sensitization on reinnervation neuropathic allodynia.
Mechanical hypersensitivity in the tibial territory 24-26 weeks post-SNI is shown as compared to control (a), using mice with CFA-induced paw inflammation as positive controls for mechanisms of peripheral sensitization (b). Shown are data with inhibition of prostaglandin synthesis via blockade of both Cox-1 and Cox-2 (Diclofenac), Cox2-selective inhibition (Celecoxib), blockade of TRPV1 or TRPA1 or sequestration of NGF using a neutralizing antibody. In both models, vehicle-treated mice were used as negative controls. Note that blockade of prostaglandin synthesis, TRPA1 inhibition and NGF sequestration led to significant decrease in inflammatory mechanical allodynia, but did not affect reinnervation mechanical allodynia. N = 7 mice for and SNI -vehicle group, 8 mice for Sham-drug group and 6 mice each for CFA–drug and CFA–vehicle groups. For group comparison in panel a, F (3,15) = 1.608, P = 0.223 (Diclofenac), F (3,15) = 0.541, P = 0.66 (celecoxib), F (3,15) = 0.279, P = 0.84 (AMG9810), F (3,15) = 0.649, P = 0.594 (AP18) and F (3,15) = 0.121, P = 0.947 (Tanezumab). For group comparison in panel b, F (3,15) = 29.222, P = 1.64E-06 (Diclofenac), F (3,15) = 11.842, P = 0.000308 (celecoxib), F (3,15) = 0.846, P = 0.49 (AMG9810), F (3,15) = 10.0, P = 0.00071 (AP18) and F (3,15) = 4.778, P = 0.0157 (Tanezumab). Two-way ANOVA of repeated measures followed by Bonferroni’s test for multiple comparisons was performed (* < p 0.05). Data are shown as mean ± S.E.M. Source data
Extended Data Fig. 13
Extended Data Fig. 13. Overview of gene expression analyses of DRG neurons innervating the sural territory or collaterally sprouting into the tibial territory at 24 weeks after SNI as compared to control mice.
(a, b) Volcano plots and summary of results (a) and putative functions ascribed to regulated genes or their families (b) in collaterally sprouting nociceptors in the tibial territory in SNI mice as compared to nociceptors innervating the tibial territory in control mice. Red and blue dots represent upregulated and downregulated genes, respectively. Unlabelled dots represent sequences lacking annotation. (c) Relative abundance of sub-populations of nociceptors was not significantly different between collaterally sprouting nociceptors in the tibial territory as compared to nociceptors innervating the tibial territory in control mice. ANOVA of random measures revealed lack of statistical significance. (d) Volcano plots and summary of results of genes regulated in nociceptors in the sural nerve territory of SNI mice as compared to control mice. Owing to space limits, not all regulated genes represented by blue and red dots are labelled in panel d. Further details are given in Supplementary Note 4 and sequencing reads are placed on the European Nucleotide Archive (https://www.ebi.ac.uk/ena) under the accession number PRJEB50184. Source data
Extended Data Fig. 14
Extended Data Fig. 14. Effects of caspase-3-mediated nociceptor ablation specifically in L3–L4 DRGs on reinnervation neuropathic allodynia.
Shown is the behavioural effect of adeno-associated virus injection-mediated Cre-dependent caspase-3 expression in L3-L4 DRGs at 24-26 wks post-sham treatment or SNI on withdrawal responses to graded von Frey mechanical stimuli in the latter-most digit (sural territory, panel a) (n = 4 per group; F(1,6) = 33.0, P = 0.01) or the middle digit (tibial territory, panel b) (n = 4 per group; F(1,6) = 15.0, P = 0.030). Panel c represents mechanical sensitivity in mice receiving AAV-GFP (control) (n = 4 per group; for tibial, F(1,6) = 1.417, P = 0.312 and for sural, F(1,6) = 3.0, P = 0.182) injections. In all panels, * represents p < 0.05 compared to baseline, †p < 0.05 compared to control group (sham), two-way repeated measures ANOVA with Bonferroni multiple comparison. Data shown as mean ± S.E.M. Source data
Extended Data Fig. 15
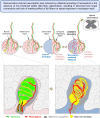
Extended Data Fig. 15. Schematic model.
The scheme depicts the proposed differential roles of nociceptors and Aβ-LTMRs in mediating two distinct types of neuropathic allodynia, both of which come about when areas undergoing denervation and intact nerve territories are intermingled, as is clinically the most frequent scenario with nerve trauma-associated neuropathic pain. In the novel reinnervation neuropathic allodynia described in this study, in the absence of Aβ reinnervation, collaterally sprouting C-fibres show abnormal pattern of connectivity in tactile-sensing Meissner corpuscles.

Comment in

  • Nerve regrowth can be painful.
    Cranfill SL, Luo W. Cranfill SL, et al. Nature. 2022 Jun;606(7912):32-33. doi: 10.1038/d41586-022-01243-8. Nature. 2022. PMID: 35614254 No abstract available.

References

    1. Devor, M. in Wall and Melzack’s Textbook of Pain 5th edn (eds McMahon, S. B. & Koltzenburg, M.) 905–927 (Churchill Livingstone, 2006).
    1. Campbell JN, Meyer RA. Mechanisms of neuropathic pain. Neuron. 2006;52:77–92. - PMC - PubMed
    1. Finnerup NB, Kuner R, Jensen TS. Neuropathic pain: from mechanisms to treatment. Physiol. Rev. 2021;101:259–301. - PubMed
    1. Campbell JN, Raja SN, Meyer RA, Mackinnon SE. Myelinated afferents signal the hyperalgesia associated with nerve injury. Pain. 1988;32:89–94. - PubMed
    1. Dhandapani R, et al. Control of mechanical pain hypersensitivity in mice through ligand-targeted photoablation of TrkB-positive sensory neurons. Nat. Commun. 2018;9:1640. - PMC - PubMed