. 2022 Jun;606(7912):146-152.
doi: 10.1038/s41586-022-04783-1. Epub 2022 May 25.

CCR5 closes the temporal window for memory linking

Affiliations

CCR5 closes the temporal window for memory linking

Yang Shen et al. Nature. 2022 Jun.

Abstract

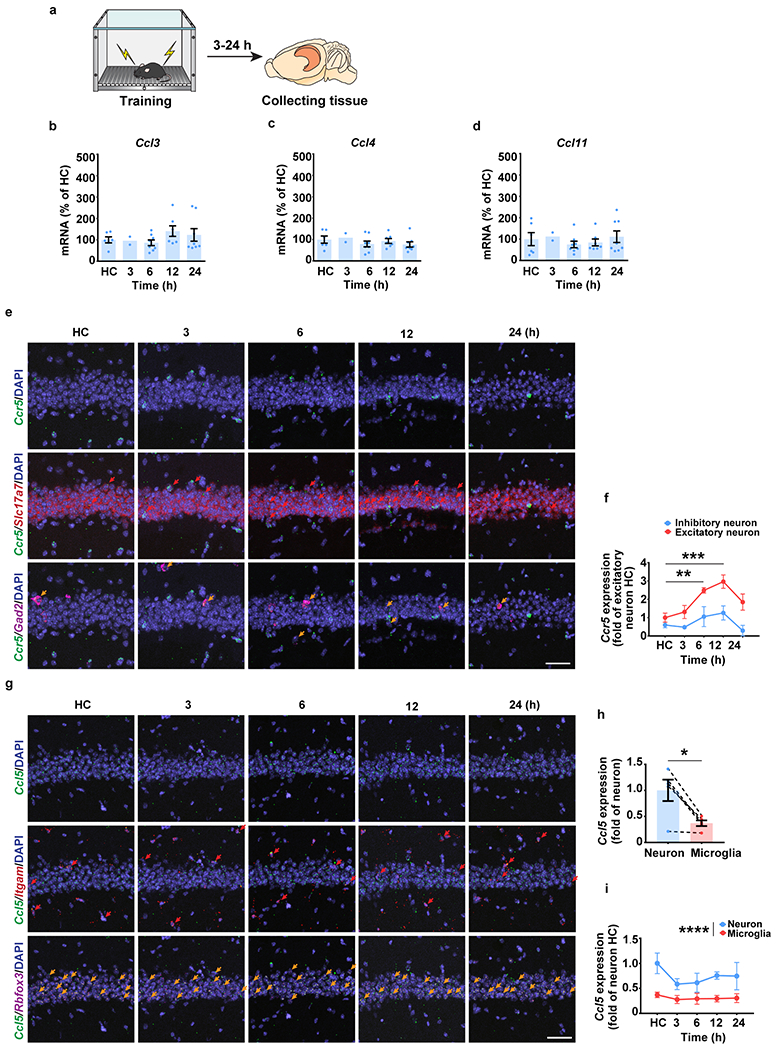
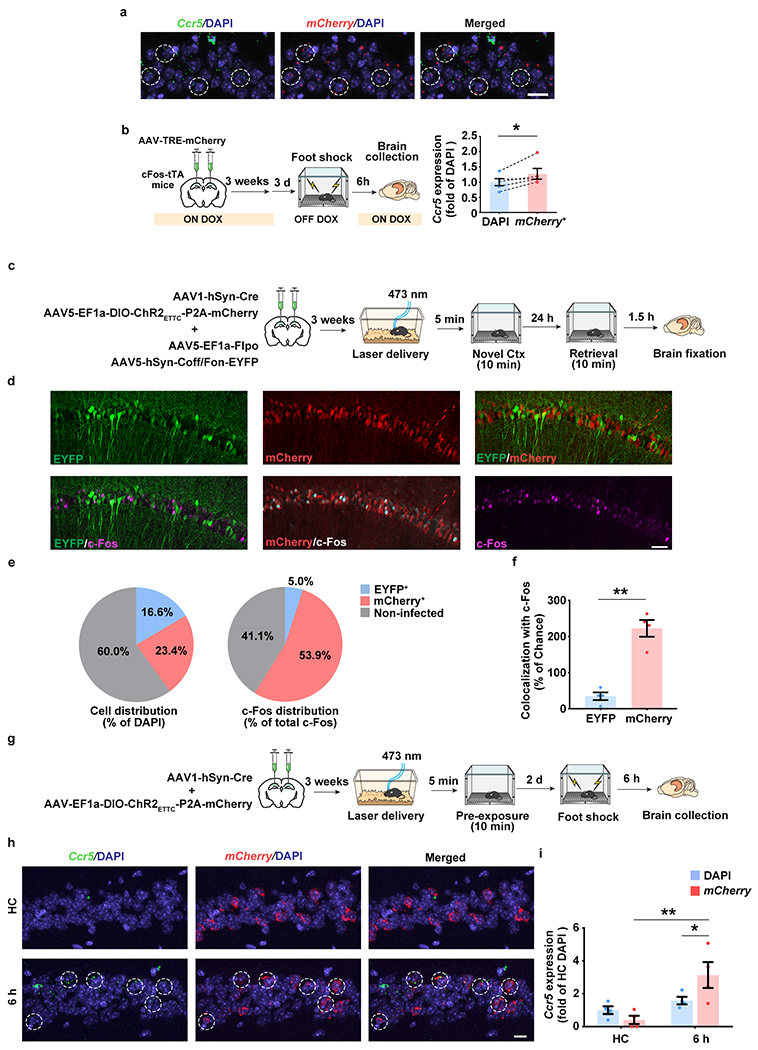
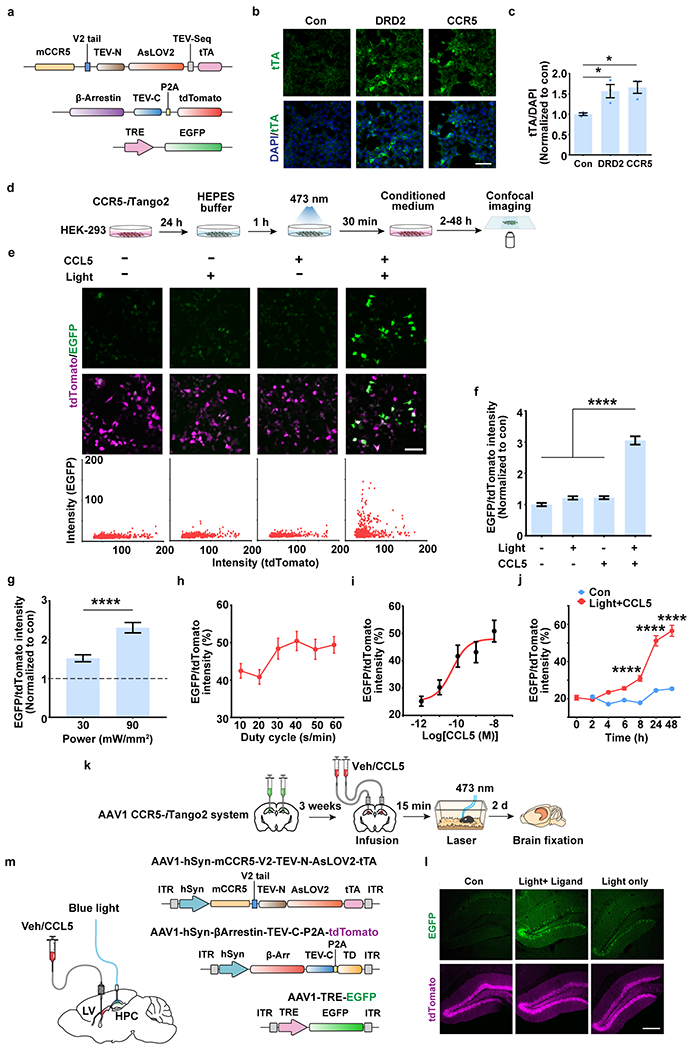
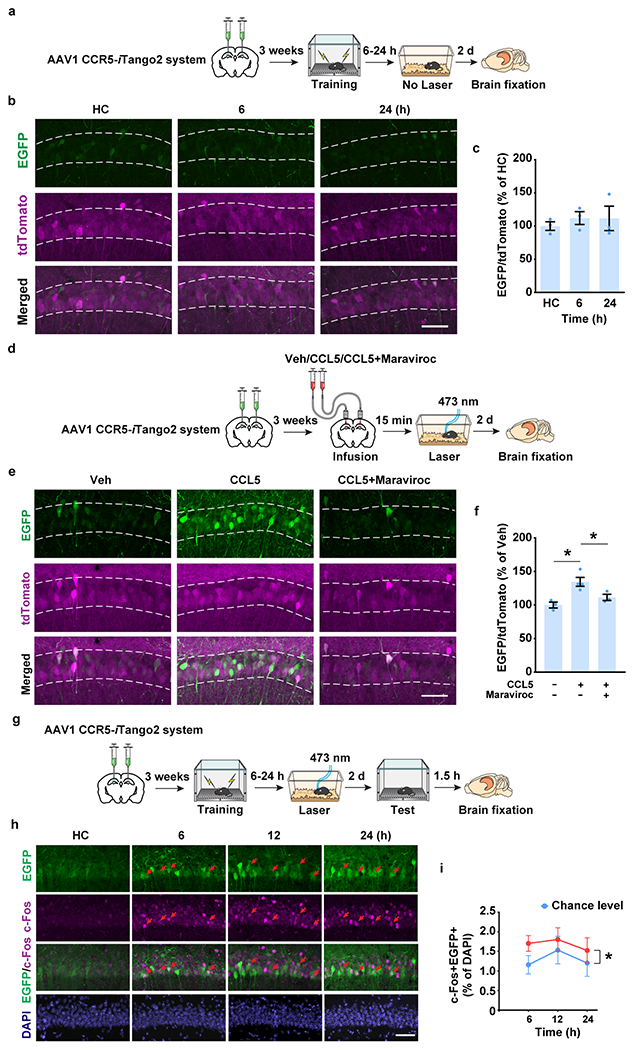
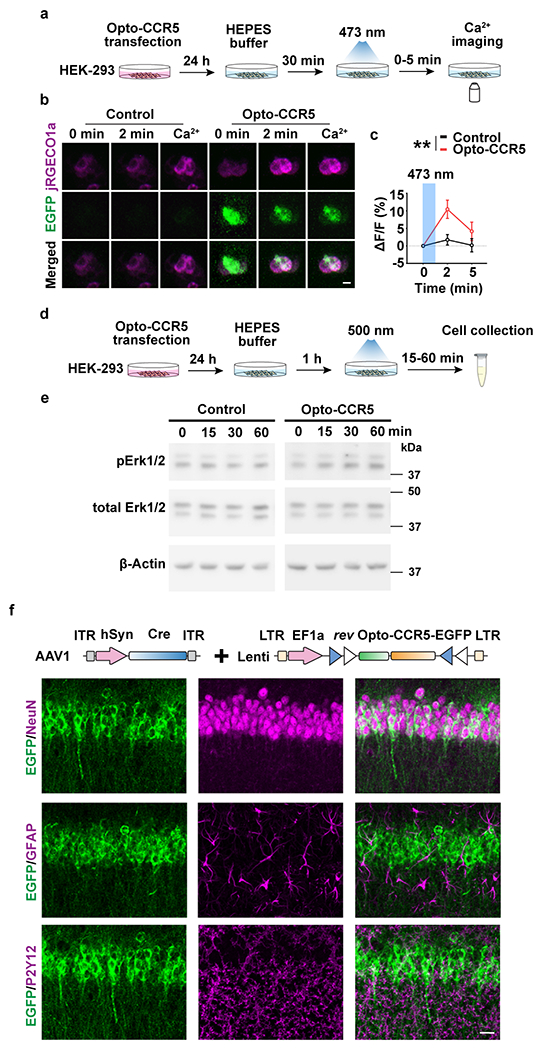
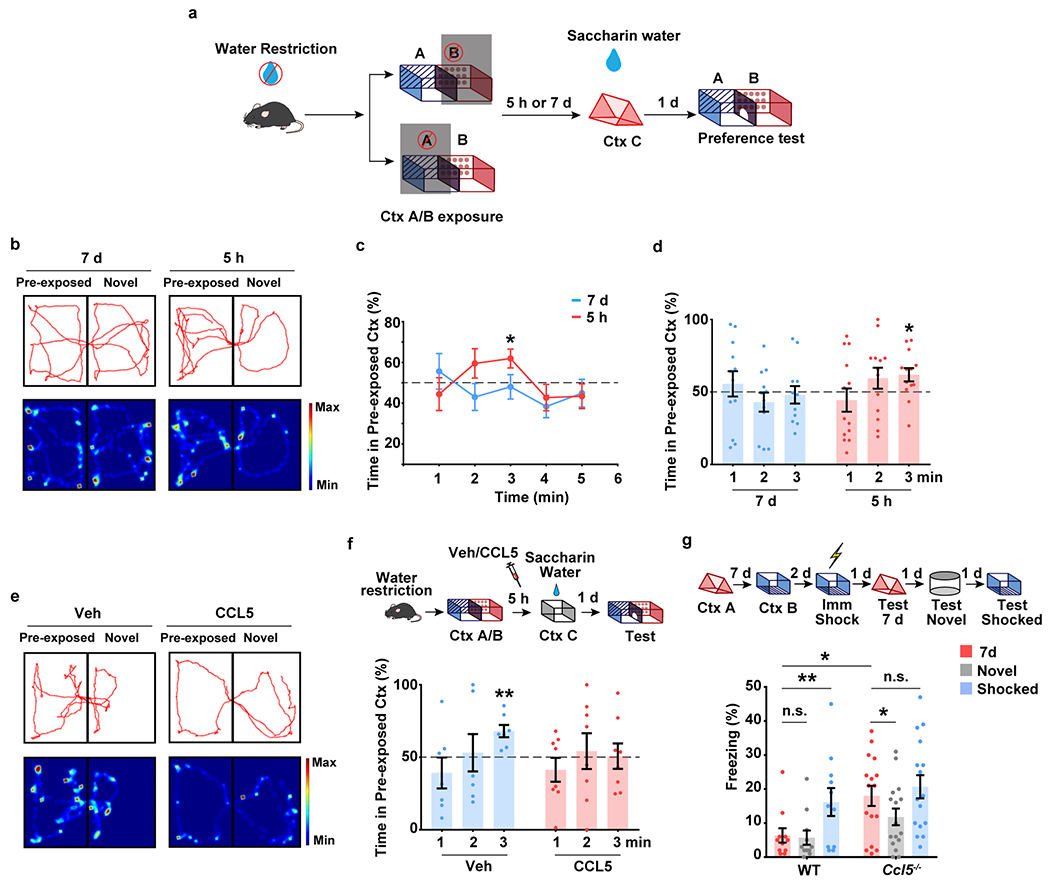
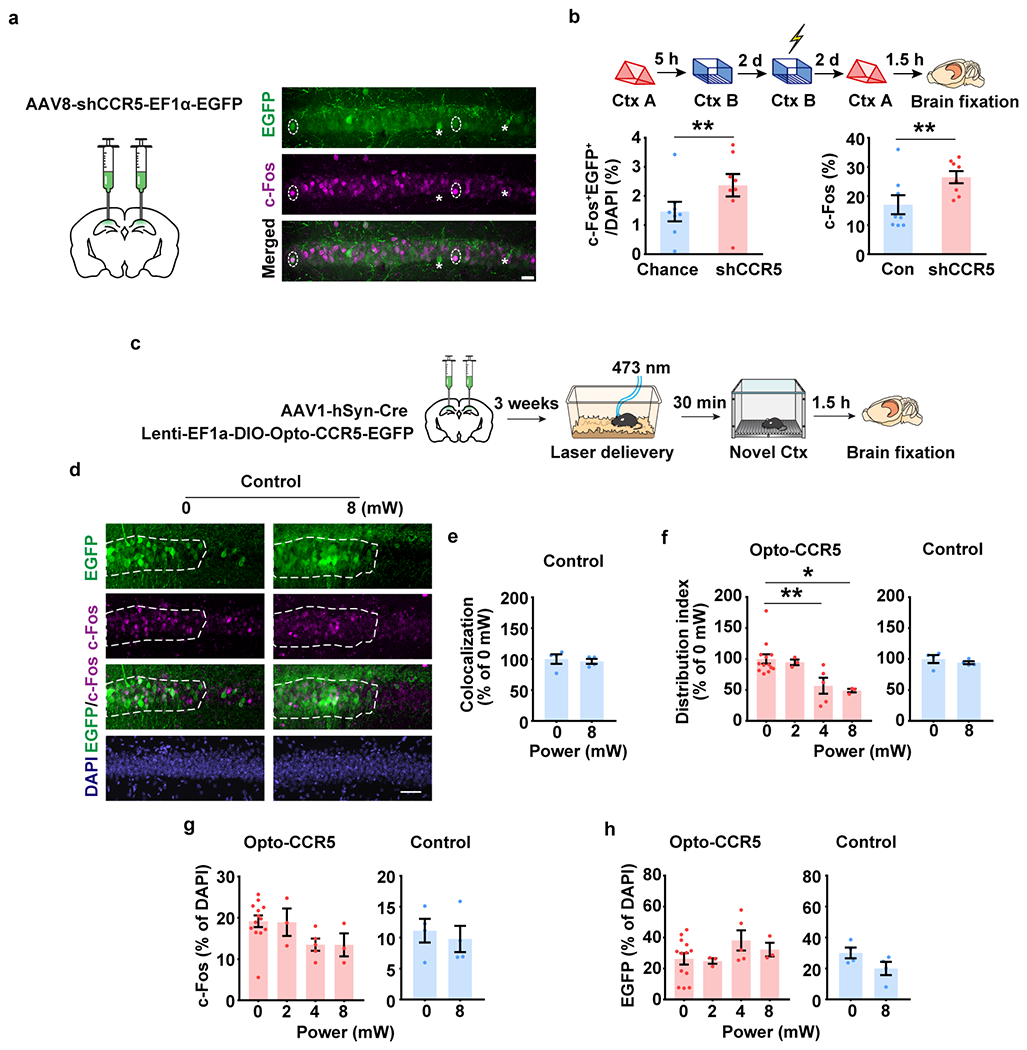
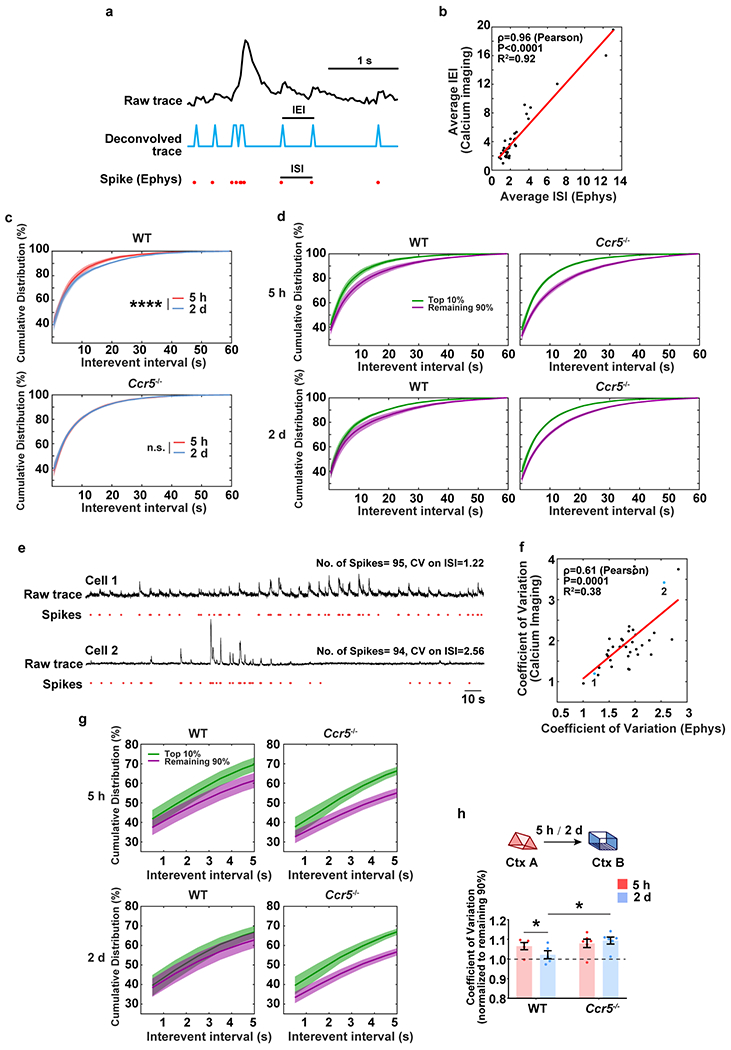
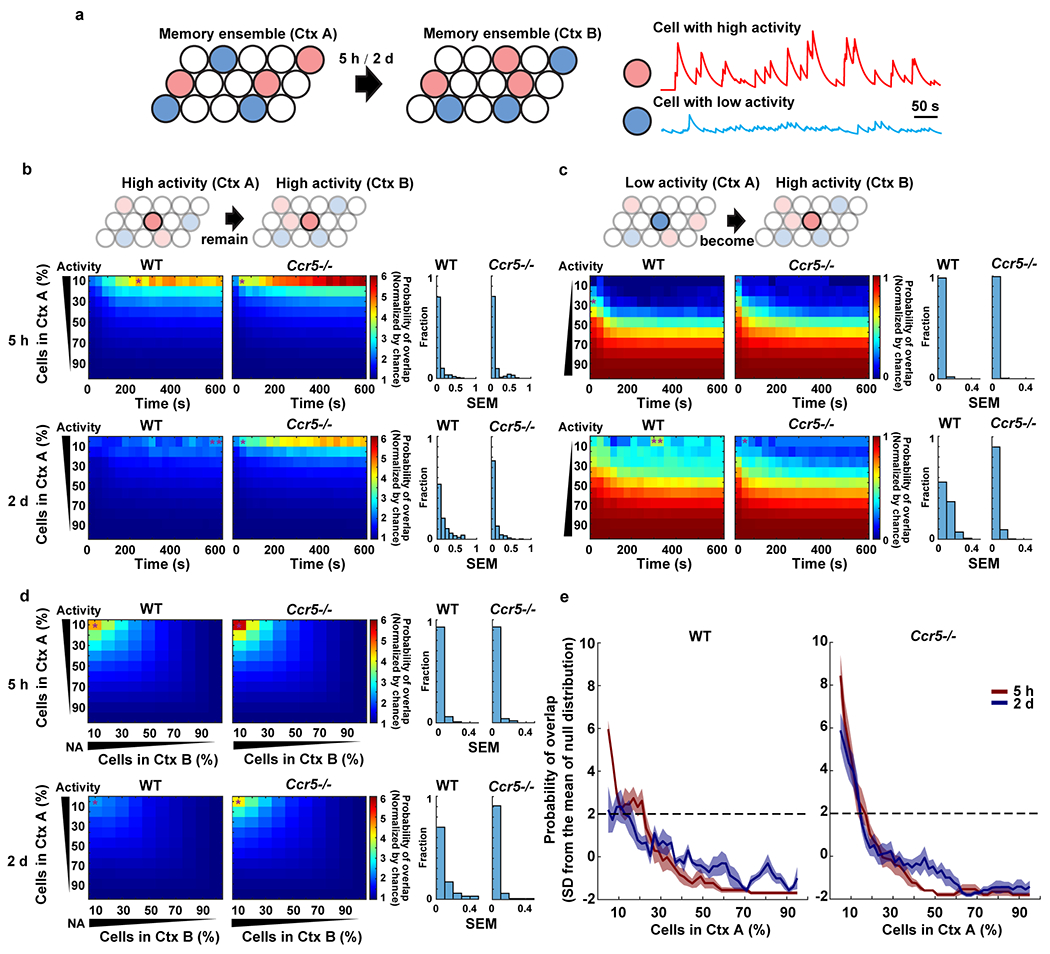
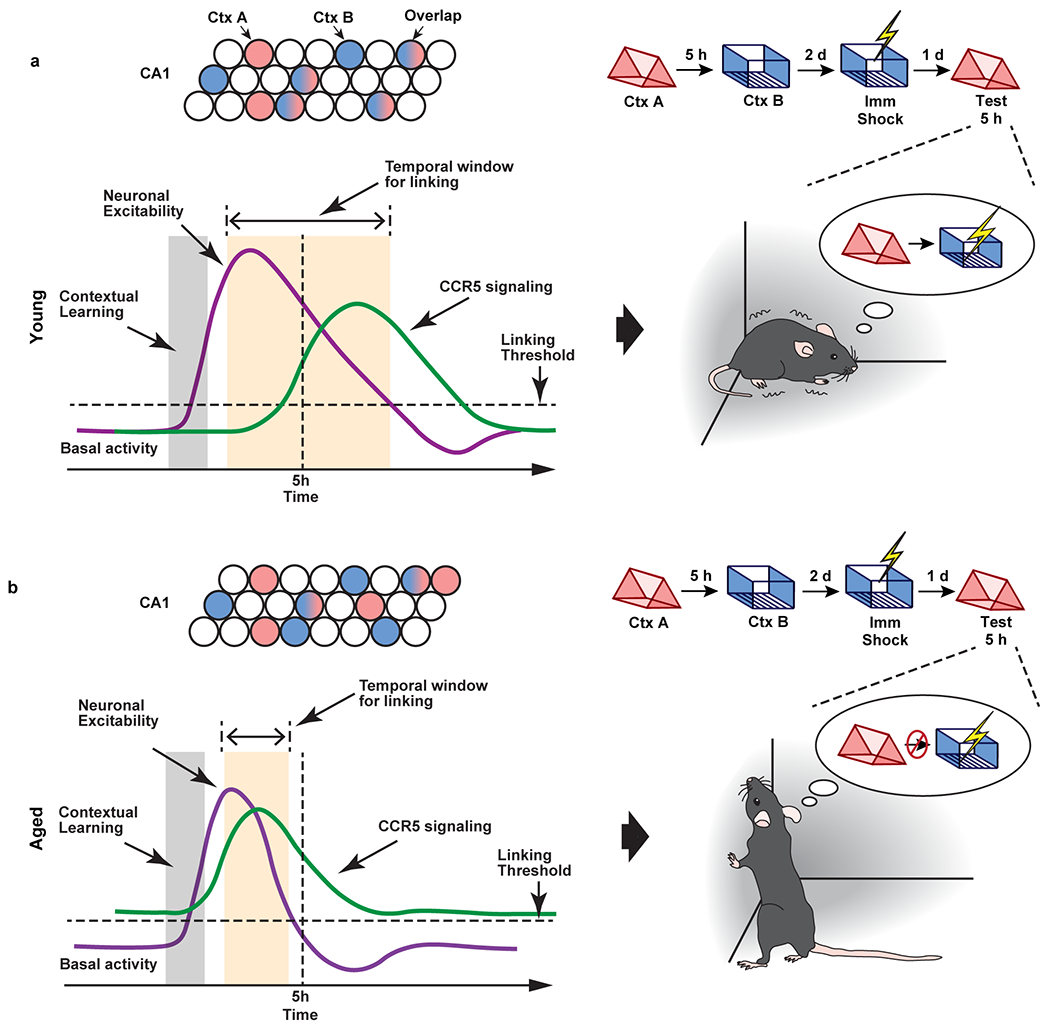
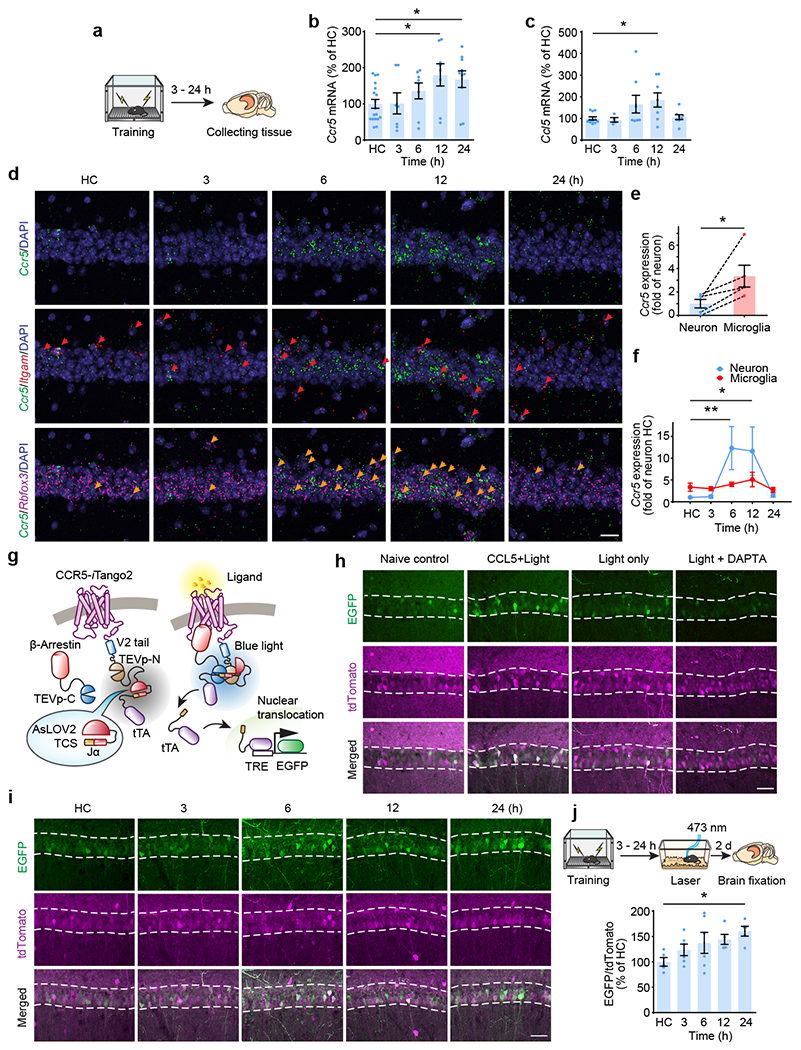
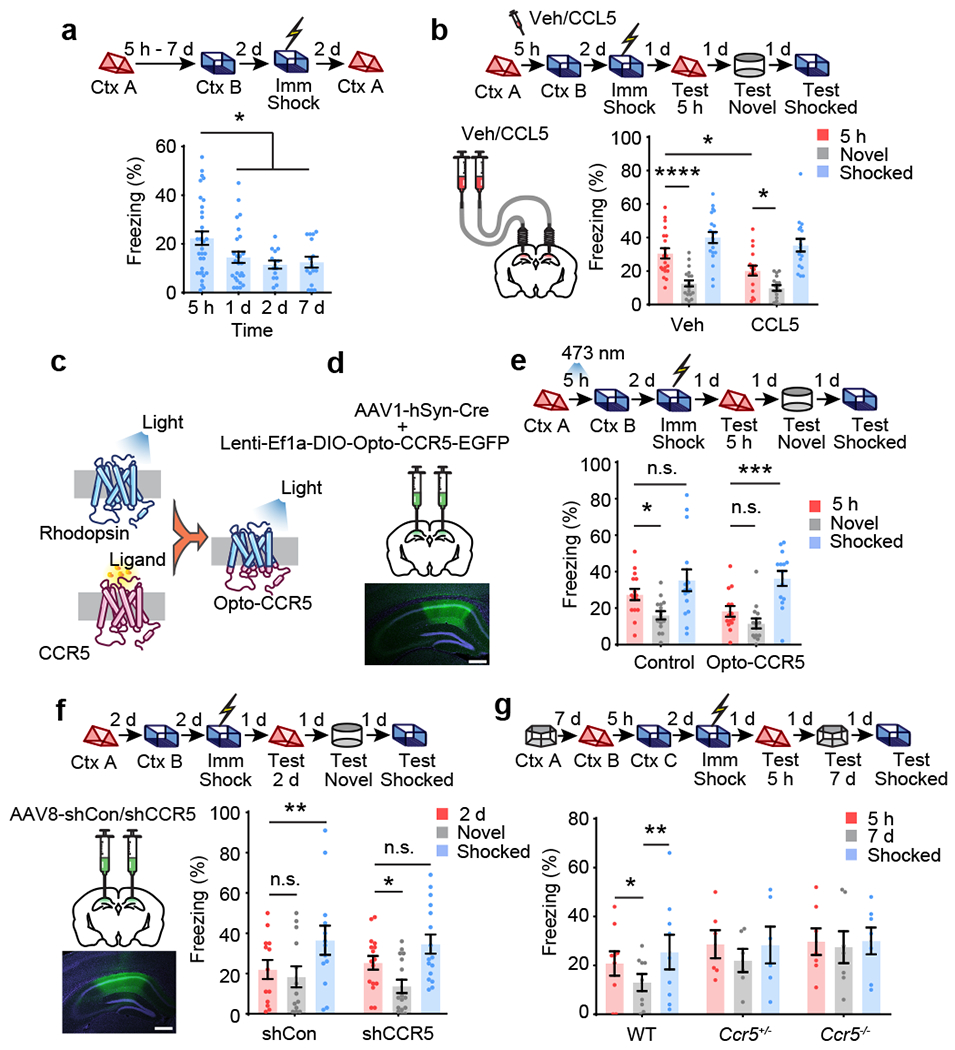
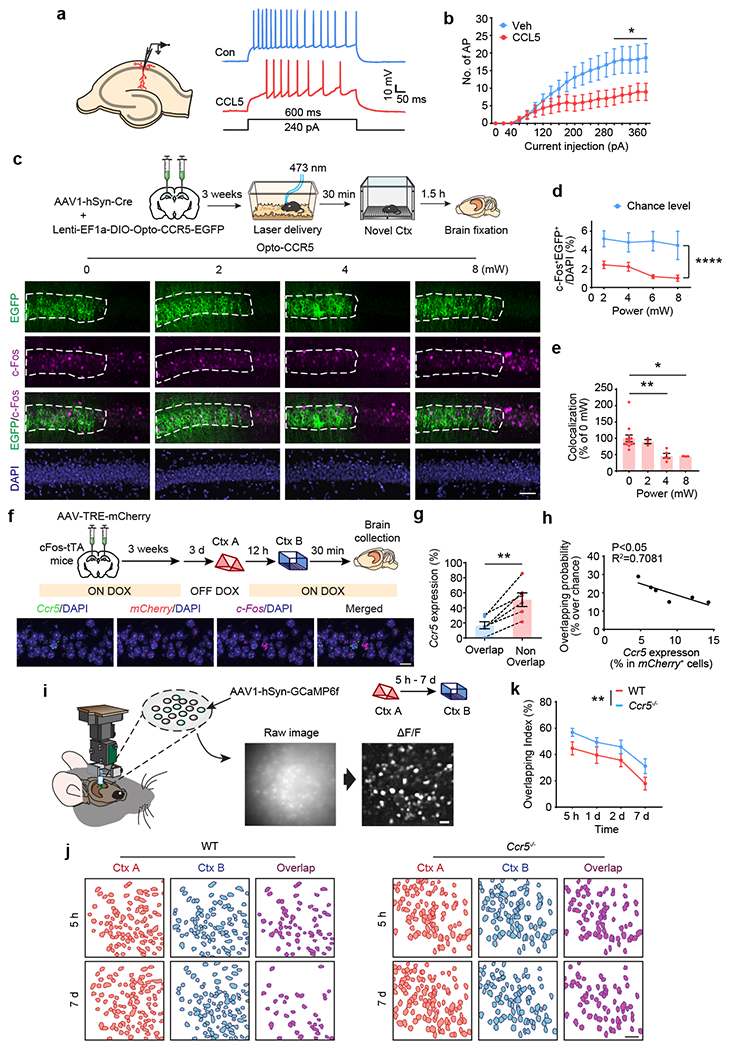
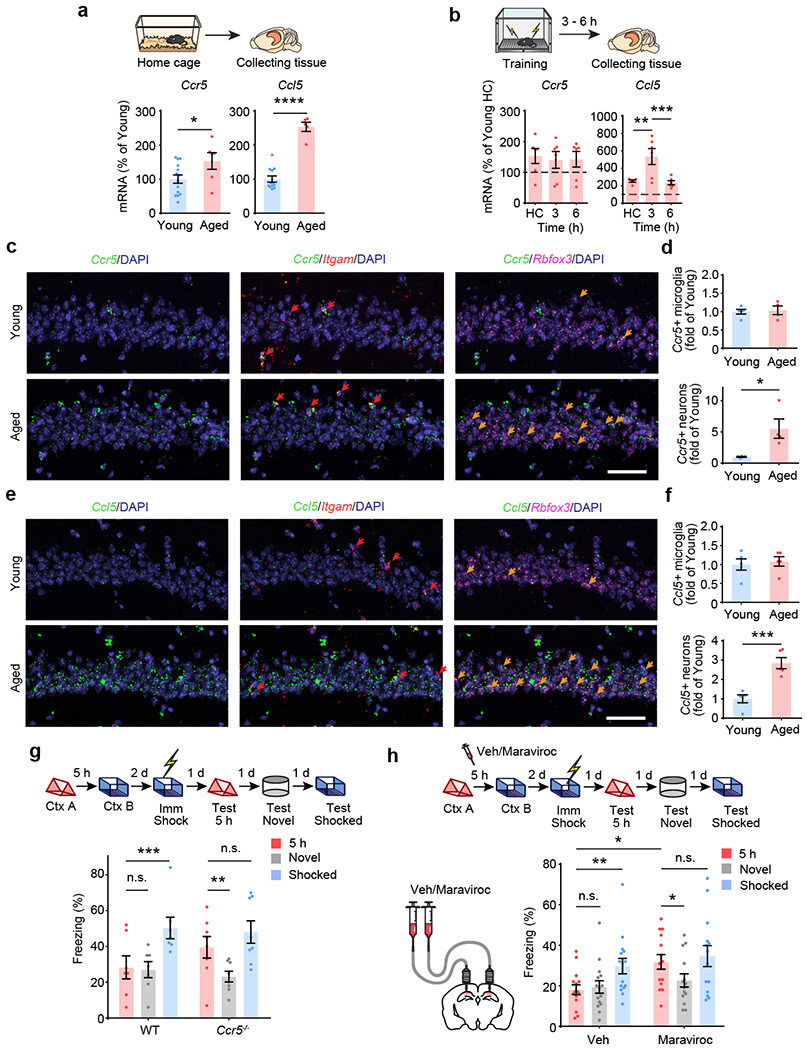
Real-world memories are formed in a particular context and are often not acquired or recalled in isolation1-5. Time is a key variable in the organization of memories, as events that are experienced close in time are more likely to be meaningfully associated, whereas those that are experienced with a longer interval are not1-4. How the brain segregates events that are temporally distinct is unclear. Here we show that a delayed (12-24 h) increase in the expression of C-C chemokine receptor type 5 (CCR5)-an immune receptor that is well known as a co-receptor for HIV infection6,7-after the formation of a contextual memory determines the duration of the temporal window for associating or linking that memory with subsequent memories. This delayed expression of CCR5 in mouse dorsal CA1 neurons results in a decrease in neuronal excitability, which in turn negatively regulates neuronal memory allocation, thus reducing the overlap between dorsal CA1 memory ensembles. Lowering this overlap affects the ability of one memory to trigger the recall of the other, and therefore closes the temporal window for memory linking. Our findings also show that an age-related increase in the neuronal expression of CCR5 and its ligand CCL5 leads to impairments in memory linking in aged mice, which could be reversed with a Ccr5 knockout and a drug approved by the US Food and Drug Administration (FDA) that inhibits this receptor, a result with clinical implications. Altogether, the findings reported here provide insights into the molecular and cellular mechanisms that shape the temporal window for memory linking.


Conflict of interest statement

Competing interests The authors declare no competing interests.

Figures

Extended Data Fig. 1|
Extended Data Fig. 1|. Dorsal hippocampal expression of CCR5 and its ligands after fear conditioning.
a, Schematics of hippocampal tissue collection. b-d, qPCR experiment to measure Ccl3 (b), Ccl4 (c), and Ccl11 (d) expression in naïve mice (HC) and in mice at different times after contextual fear conditioning. HC=home cage. HC n=6, 3 h n=2, 6 h n=8, 12 h n=7, 24 h n=8 mice. e, Representative images of Ccr5, Slc17a7 (excitatory neuronal marker), and Gad2 (inhibitory neuronal marker) mRNA expression in dCA1 from naïve mice or mice 3-24h after fear conditioning. Red arrows: cells expressing Ccr5 and Slc17a7. Orange arrows: cells expressing Ccr5 and Gad2. Scale bar, 50 μm. f, Number of Ccr5-expressing excitatory and inhibitory neurons 3-24h after fear conditioning (HC n=4, 3 h n=4, 6 h n=4, 12 h n=4, 24 h n=3 mice; **P < 0.01, ***P < 0.001, two-way repeated measures ANOVA). g, Representative images of Ccl5, Itgam, and Rbfox3 mRNA expression in dCA1 from naïve mice or mice 3-24h after fear conditioning. Red arrows: cells expressing Ccl5 and Itgam. Orange arrows: cells expressing Ccl5 and Rbfox3. Scale bar, 50 μm. h, Number of Ccl5-expressing microglia and neurons in naïve mice (n=5 mice; *P < 0.05, paired t-test). i, Number of Ccl5-expressing microglia and neurons in HC mice and 3-24h after fear conditioning (n=5 mice per group; ****P < 0.0001, two-way repeated measures ANOVA). All results shown as mean ± s.e.m.
Extended Data Fig. 2|
Extended Data Fig. 2|. The co-localization of Ccr5 expression and memory ensembles measured with cFos-tTA mice and the optogenetic (ChR2ETTC) pre-activation system.
a, Representative images of Ccr5 and mCherry (neuronal ensemble) mRNA expression in dCA1 from cFos-tTA mice 6h after fear conditioning. Co-localization was labeled with dashed circles. Scale bar, 20 μm. b, Quantification of Ccr5 expression in total cells (DAPI) and neuronal ensemble (mCherry+). (n=5 mice; *P < 0.05, paired t-test). c, Schematics to use blue light to activate ChR2ETTC-expressing neurons to be involved in neuronal ensemble by pre-activation. INTRSECT system (Cre-off/Flp-on) was used to label non-ChR2ETTC-expressing neurons as the control. d, Representative images of mCherry (pre-activated neurons), c-Fos (neuronal ensembles), and EYFP (non-preactivated neurons) in dCA1 24h after the novel context exposure. Scale bar, 50 μm. e, c-Fos distribution in mCherry+, EYFP+ or non-infected cells. f, Quantification of the colocalization between c-Fos and mCherry or EYFP. Colocalization (of c-Fos and mCherry) = (c-Fos+mCherry+/DAPI)/[(c-Fos+/DAPI)*(mCherry+/DAPI)] (n=4 mice per group; **P < 0.01, paired Student’s t-test). g, Schematics to detect the colocalization of Ccr5 expression in neuronal ensembles using pre-activation system. h, Representative images of Ccr5 and mCherry (pre-activated neuronal ensemble) mRNA expression in dCA1 6h after fear conditioning. Colocalization was labeled with dashed circles. Scale bar, 20 μm. i, Quantification of Ccr5 expression in total cells (DAPI) and pre-activated neuronal ensemble (mCherry+) (n=4 mice per group; *P < 0.05, **P < 0.01, two-way repeated measures ANOVA). All results shown as mean ± s.e.m.
Extended Data Fig. 3|
Extended Data Fig. 3|. Characterization of CCR5-iTango2.
a, Schematics of CCR5-iTango2 constructs. b, c, Expression validation of the CCR5-iTango system in HEK-293 cells. DRD2-iTango2 (for Dopamine 2 receptor) was used as a positive control. b, Representative images of tTA immunostaining. Scale bar, 50 μm. c, Quantification of tTA expression (intensity normalized to DAPI). n=3 slides per group; *P < 0.05, one-way ANOVA. d, HEK-293 cells were transfected with 3 plasmids (see methods) for 24h and then treated with 10 nM CCL5 and blue light to induce EGFP expression. e, Representative images of EGFP expression after different treatments. LightCCL5 n=558, Light+CCL5 n=507, LightCCL5+ n=521, Light+CCL5+ n= 500 cells. Scale bar, 50 μm. f, Quantification of EGFP and tdTomato ratio (intensity). Compared to control, light or CCL5 group, only the group with both light and CCL5 showed EGFP expression. LightCCL5 n=70, Light+CCL5 n=97, LightCCL5+ n=97, Light+CCL5+ n=282 cells; ****P < 0.0001, one-way ANOVA. g, Power-dependent EGFP expression. Results were normalized to no light control (30 mW/mm2 n=320, 90 mW/mm2 n=307 cells; ****P < 0.0001, student’s t-test). h, Duty cycle dependent EGFP expression. The light stimulation was delivered every minute (~0.017 Hz) to induce EGFP expression. Light was kept on for 10-60 s during each stimulation to induce EGFP expression (10 s/min n=407, 20 s/min n=377, 30 s/min n=307, 40 s/min n=383, 50 s/min n=353, 60 s/min n=524 cells). i, Dose curve of CCL5 to induced CCR5 activation (measured by EGFP/tdTomato fluorescence ratio) in cultured HEK-293 cells (10−12 M n=49, 10−11 M n=39, 10−10 M n=29, 10−9 M n=77, 10−8 M n=86 cells). j, Time course of EGFP expression. The green fluorescence increased monotonically during the different time intervals investigated. Compared to other time intervals (2, 4, 6, 8 and 24h), the 48h time interval showed the highest EGFP/tdTomato ratio (Light+CCL5+ 0 h n=58, 2 h n=194, 4 h n=282, 6 h n=310, 8 h n=316, 24 h n=396, 48 h n=345 cells; LightCCL5 2 h n=195, 4 h n=219, 6 h n=290, 8 h n=304, 24 h n=445, 48 h n=401 cells; ****P < 0.0001, two-way ANOVA). k, Schematics of CCR5-iTango2 AAVs injected into mouse hippocampus and validated through intra-hippocampal infusion of CCL5 and fiber-optic light stimulation. l, Representative images of CCR5-iTango2-expressing hippocampal dentate gyrus neurons in control condition (no light and CCL5), light only, and light with CCL5. Ligand and light were directly delivered into the hippocampus. Scale bar, 250 μm. m, Left: To test CCR5-iTango2 activation in dCA1 (Fig. 1h), CCL5 was infused into the lateral ventricle (LV) while light was delivered into dCA1 of hippocampus (HPC). Right: Schematics of CCR5-iTango2 AAVs. All results shown as mean ± s.e.m.
Extended Data Fig. 4|
Extended Data Fig. 4|. CCR5 activation measured with the CCR5-iTango2 system in vivo.
a-c, Validation of the leakage in CCR5-iTango2 system in vivo. a, Schematics to test the CCR5-iTango2 system without light activation. b, Representative images of EGFP and CCR5-iTango2-expressing dCA1 neurons after fear conditioning. Scale bar, 50 μm. c, Quantification of EGFP expression (intensity normalized to tdTomato, n=3 mice per group). d-f, Validation of the maraviroc mediated CCR5 inhibition in vivo. d, Maraviroc was co-infused with CCL5 into mouse dCA1. The CCR5-iTango2 was used to measure CCR5 activation in vivo. e, Representative images of CCR5-iTango2-expressing dCA1 neurons after fear conditioning. Scale bar, 50 μm. f, Quantification of EGFP expression in different treatment (CCL5Maraviroc n=3, CCL5+Maraviroc n=4, CCL5+Maraviroc+ n=3 mice; *P < 0.05, one-way ANOVA). g-i, Analyses of colocalization of c-Fos and CCR5 activation in vivo. g, Schematics to test c-Fos expression in EGFP+ cells after learning with the CCR5-iTango2 system. h, Representative images of colocalization between EGFP and c-Fos in dCA1. Red arrows: c-Fos+EGFP+ cells. Scale bar, 50 μm. i, Percentage of c-Fos+EGFP+ cells in total cells (6 h n=6, 12 h n=4, 24 h n=5 mice; *P < 0.05, two-way repeated measures ANOVA). All results shown as mean ± s.e.m.
Extended Data Fig. 5|
Extended Data Fig. 5|. Characterization of Opto-CCR5.
a, HEK-293 cells were transfected with Opto-CCR5 and jRGECO1a (Calcium sensor with red florescence) for 24h and then stimulated with blue light to induce a calcium response. b, Representative images at 0 min or 2 min after stimulation, or in the medium with high calcium concentration. Scale bar, 20 μm. c, Quantification of florescence change after light stimulation. In HEK-293 cells, Opto-CCR5-EGFP activation by light significantly increased intracellular Ca2+ concentration reflected by jRGECO1a (Control 2 min n=95, Control 5 min n=96, Opto-CCR5 2 min n=86, Opto-CCR5 5 min n=89 cells; **P < 0.01, two-way ANOVA). d, e, Opto-CCR5 activation increased pErk1/2 in HEK-293 cells. d, HEK-293 cells were transfected with the Opto-CCR5 construct. After 24h expression, the cells were starved in HEPES buffer for 1h before a 2 min light stimulation to reduce basal pErk1/2 levels. Cells were collected at 0 (no light stimulation), 15, 30 or 60 min after light stimulation and subjected to Western blot analysis to investigate the phosphorylation level of Erk1/2 (e). f, Expression of Opto-CCR5 in dCA1 neurons. To express Opto-CCR5 in dCA1 neurons, AAV1-hSyn-Cre was co-injected with Lenti-DIO-Opto-CCR5. NeuN (neuron marker), GFAP (astrocyte marker) and P2Y12 (microglia marker) were co-stained with EGFP in dCA1. Scale bar, 20 μm. All results shown as mean ± s.e.m.
Extended Data Fig. 6|
Extended Data Fig. 6|. CCR5/CCL5 signaling regulates memory linking in an appetitive place preference task.
a-f, Place preference-based behavior model to test the linking of contextual memories. a, Schematics of place preference-based linking behavior. b, Representative trajectory plot (in the 3rd minute) of mice in the pre-exposed context and a novel context with a 5h and 7d interval. c, d, Mice showed a significant preference for pre-exposed context during the 3rd minute in the 5h group compared to the 7d group (5h, n=13, 7d n=12 mice; *P < 0.05, one sample paired t-test compared to 50%) e, Representative trajectory plot (in the 3rd minute) of mice in the pre-exposed context and a novel context with Vehicle or CCL5 infusion. f, CCL5 infusion in dCA1 impaired contextual memory linking with a 5h interval (Veh n=7, CCL5 n=8; **P < 0.01, one sample paired t-test compared to 50%). g, Ccl5 knockout extended the temporal window of contextual memory linking (WT n=11, Ccl5−/− n=16; *P < 0.05, **P < 0.01, two-way repeated measures ANOVA). All results shown as mean ± s.e.m.
Extended Data Fig. 7|
Extended Data Fig. 7|. CCR5 regulate memory allocation.
a, b, Ccr5 knockdown enhanced memory allocation. a, Schematics of AAV8-shRNA-CCR5-Ef1α-EGFP injection, and representative images of c-Fos and EGFP staining. Two EGFP+c-Fos+ cells were labelled by dotted line circle and two EGFP+c-Fos cells were labelled by asterisk. Scale bar, 20 μm. b, dCA1 neurons with Ccr5 knockdown had a higher probability of expressing c-Fos after a memory test in context A. Left: The percentage of c-Fos+EGFP+ cells in total (DAPI). Right: percentage of c-Fos+ cells in EGFP cells (Con) or in EGFP+ cells with Ccr5 knockdown (shCCR5) (n=8 mice, **P < 0.01, paired t-test). c-h, Expression of c-Fos and Opto-CCR5 or EGFP control in dCA1 (Opto-CCR5 0 mW n=13, 2 mW n=3, 4 mW n=5, 8 mW n=3 mice; EGFP control n=4 mice per group). d, Representative images of colocalization between c-Fos and EGFP control after light stimulation and novel context exposure. Scale bar, 50 μm. e, Colocalization between c-Fos+ cells and EGFP+ cells after normalization to chance level. f, Quantification of c-Fos distribution in EGFP+ and EGFP cells in the Opto-CCR5-EGFP or EGFP control group (*P < 0.05, **P < 0.01, one-way ANOVA). g, Percentage of c-Fos positive cells (normalized to cells with DAPI staining) in dCA1 with light stimulation of different power levels. h, Percentage of EGFP expression cells (normalized to cells with DAPI staining) in dCA1with light stimulation of different power levels. All results shown as mean ± s.e.m.
Extended Data Fig. 8|
Extended Data Fig. 8|. Analysis of the cumulative distribution of inter-event intervals recorded with miniscopes in WT and Ccr5 KO mice.
a, Schematics used to extract spike information from raw traces of calcium imaging. Plot shows a 3s chunk of data from a single neuron using GCaMP6f calcium imaging and loose-seal cell-attached electrophysiological (Ephys) recordings. b, The average inter-event interval (IEI, from miniscope recordings) is highly correlated with the average inter-spike interval (ISI, by Ephys) (n=36 cells; R2=0.92, P < 0.0001, ρ=0.96, Pearson’s correlation coefficient). c, Cumulative distribution of IEI of the top 10% most active neurons (in Ctx A). The top 10% most active neurons from WT mice showed a significantly different distribution of IEI 5h compared to 2d after the context A exposure. In contrast, this subset of cells showed a similar pattern for both time intervals in Ccr5−/− mice (WT n=5, Ccr5−/− n=6 mice; ****P < 0.0001, Kolmogorov–Smirnov test). d, Cumulative distribution of IEIs of the top 10% most active neurons and the remaining 90% neurons (in Ctx A) at 5h or 2d after the context A exposure (WT n=5, Ccr5−/− n=6 mice). e, Although neurons may have similar number of spikes during a certain time period of recording, the difference of their coefficient of variation unveils different firing patterns ranging from regular firing (Cell 1) to bursty firing (Cell 2). f, The coefficient of variation of IEI (by calcium imaging) highly correlates with the coefficient of variation of ISI (by Ephys) (n=36 cells; R2=0.38, P=0.0001, ρ=0.61, Pearson’s correlation coefficient). g, Cumulative distribution of IEI (the first 5s, zoom-in from d) of the top 10% highly active neurons and the remaining 90% neurons (in Ctx A) at 5h or 2d after the context A exposure. The difference between the top 10% most active and the remaining 90% neurons in Ctx A was strongly reduced from 5h to 2d in WT mice but not in Ccr5−/− mice (WT n=5, Ccr5−/− n=6 mice). h, Coefficient of variation from the top 10% most active neurons (normalized to the remaining 90%). WT or Ccr5−/− mice were exposed to Ctx B 5h or 2d after Ctx A. WT mice showed a significant decrease in the coefficient of variation of IEI comparing the data for the 2d and 5h intervals, while Ccr5−/− mice had similar coefficient of variation of IEI in both intervals (WT n=5, Ccr5−/− n=6 mice; *P < 0.05, two-way repeated measures ANOVA). All results shown as mean ± s.e.m.
Extended Data Fig. 9|
Extended Data Fig. 9|. Analysis of neuronal activity and overlap probability in WT and Ccr5 KO mice.
a, Schematics showing that cells in neuronal ensembles can be sorted into cells with high neuronal activity (red) and low activity (blue), based on their average activity during the exploration of Ctx A and Ctx B which were separated by either a 5h or 2d interval. b, c, Left: Probability of overlap (averaged across mice) between subsets of cells with different levels of activity (y axis) during exploration of Ctx A and Ctx B, in WT and Ccr5−/− mice across time in Ctx B (x axis). Color bars refer to normalized probabilities (chance=1). Cumulative values were used for x and y axis (e.g., for x axis, 200s means 0-200s; for y axis, 30 refers to the neurons within the top 30% of high (b) or low (c) activity). Right: the distribution of SEM across mice for the figures on the left. Asterisks (in the probability of overlap figures) represent the maximum SEM from each plot (WT n=5, Ccr5−/− n=6 mice). b, Probability of overlap between high activity cells in Ctx A and high activity cells in Ctx B in WT and Ccr5−/− mice. Note that the top 10% high activity cells in Ctx A are very likely to remain within the top 10% high activity cells in Ctx B 5h later for both WT and Ccr5−/− mice. In contrast, this subset of cells was reactivated around chance levels 2d later in Ctx B in WT mice, but not in Ccr5−/− mice. In the Ccr5−/− mice this subset of cells was still very likely to remain within the top 10% high activity cells in Ctx B. c, Probability of overlap between low activity cells in Ctx A and high activity cells in Ctx B in WT and Ccr5−/− mice. In contrast to high activity cells in Ctx A, the low activity cells in Ctx A were less likely (compared to chance) to be within the high activity cells in Ctx B. d, The probability of overlap between different ensembles (Ctx A and Ctx B) was sorted by neuronal activity in Ctx A and Ctx B, with a 5h or 2d interval between the two contextual exposures. Cells were sorted in percentages from top to bottom mean neuronal activity in the first context (Ctx A, y axis) and from left to right in the second context (Ctx B, x axis). With a 5h interval between Ctx A and B, the likelihood that neurons with high activity in Ctx A remained with high activity in Ctx B was higher than chance for both WT and Ccr5 KO mice. With a 2d interval, the likelihood that neurons with high activity in Ctx A remained high activity in Ctx B was at chance levels in WT mice. In contrast, Ccr5 KO mice showed a pattern similar to that observed with the 5h interval (WT n=5, Ccr5−/− n=6 mice). e, Cells were again sorted from high to low activity in Ctx A with a 10% sliding window and 2% steps. The probability of overlap between subsets of cells (10% ensemble size) from Ctx A and the ensemble cells with top 10% high activity in Ctx B was plotted. The probability values were z-scored with respect to a null distribution created by randomly subsampling 10% of cells from Ctx A 10,000 times (i.e., results are represented as standard deviation (SD) from the mean of the null distribution). The 2SD threshold is labeled with a dashed line (WT n=5, Ccr5−/− n=6 mice).
Extended Data Fig. 10|
Extended Data Fig. 10|. Graphic abstract.
a, In young mice, CCR5 signaling increases at a time point more than 5h after learning, and neuronal excitability and memory ensemble overlap remain high at 5h after learning. As a result, memories for context A (neutral context) and context B (shocked context) are linked together, and mice show high freezing during the test in context A. b, In aged mice, CCR5 signaling is higher than young mice at baseline and there is a further increase before 5h after learning, which lead to a reduction of neuronal excitability and memory ensemble overlap at 5h after learning. As a result, memories for context A (neutral context) and context B (shocked context) are not linked, and mice show low freezing during the test in context A.
Fig. 1|
Fig. 1|. CCR5 expression and activation in the dorsal hippocampus after contextual fear conditioning.
a-c, mRNA levels of Ccr5 (b) and Ccl5 (c) in mouse dCA1 at 3-24h after fear conditioning (a). Tissue (dCA1) from home cage (HC) mice was collected at the same time points (3-24h) and pooled together as the control HC group. Results were normalized to HC (Ccr5: HC n=18, 3 h n=7, 6 h n=8, 12 h n=8, 24 h n=10 mice; Ccl5: HC n=11, 3 h n=4, 6 h n=8, 12 h n=8, 24 h n=8 mice; *P < 0.05, one-way ANOVA). d, Representative images of Ccr5, Itgam (microglial marker), and Rbfox3 (neuronal marker) mRNA expression in dCA1 from naïve mice or mice 3-24h after fear conditioning. Red arrows: cells expressing Ccr5 and Itgam. Orange arrows: cells expressing Ccr5 and Rbfox3. Scale bar, 20 μm. e, Number of Ccr5-expressing microglia and neurons in naïve mice (n=5 mice per group; *P < 0.05, paired t-test). f, Number of Ccr5-expressing microglia and neurons 3-24h after fear conditioning (HC n=5, 3 h n=4, 6 h n=5, 12 h n=4, 24 h n=4 mice; *P < 0.05, **P < 0.01, two-way repeated measures ANOVA). g, Schematics for CCR5-iTango2. h, Representative images of CCR5-iTango2-expressing dCA1 neurons after treatment with CCL5, DAPTA (CCR5 antagonist) and light stimulation. Scale bar, 50 μm. i, Representative images of CCR5-iTango2-expressing dCA1 neurons after fear conditioning. Scale bar, 50 μm. j, Quantification of EGFP expression (intensity normalized to tdTomato which is tagged to β-Arrestin through P2A, reflecting expression of the iTango system. HC n=5, 3 h n=6, 6 h n=6, 12 h n=5, 24 h n=5 mice; *P < 0.05, one-way ANOVA). All results shown as mean ± s.e.m.
Fig. 2|
Fig. 2|. CCR5 regulates the temporal window of memory linking.
a, Characterization of the temporal window for contextual memory linking (Ctx A, Context A; Ctx B, Context B; 5h n=32, 1d n=26, 2d n=14, 7d n=16 mice; *P < 0.05, one-way ANOVA). b, CCL5 infusion in dCA1 attenuated 5h contextual memory linking (Veh n=20, CCL5 n=17 mice; *P < 0.05, ****P <0.0001, two-way repeated measures ANOVA). c, Schematics of the Opto-CCR5 construct. d, Schematics of viral constructs injection. Scale bar, 500 μm. e, Optogenetic activation of neuronal CCR5 impaired 5h contextual memory linking (Control n=15, Opto-CCR5 n=14 mice; *P < 0.05, ***P < 0.001, two-way repeated measures ANOVA). f, Left: Schematics of AAV8-shCon or AAV8-shCCR5 intrahippocampal injection. Scale bar, 500 μm. Right: Ccr5 knockdown in dCA1 neurons extended the temporal window of contextual memory linking (shRNA-Con n=13, shRNA-CCR5 n=16 mice; *P < 0.05, **P < 0.01, two-way repeated measures ANOVA). g, Ccr5 knockout extended the temporal window of contextual memory linking (WT n=9, Ccr5+/− n=6, Ccr5−/− n=7 mice; *P < 0.05, **P < 0.01, two-way repeated measures ANOVA). All results shown as mean ± s.e.m.
Fig. 3|
Fig. 3|. CCR5/CCL5 modulate neuronal excitability, memory allocation and the overlap of memory ensembles.
a, Schematics of neuronal recordings and representative traces. b, dCA1 neurons treated with CCL5 for 1h showed a significant decrease in firing rate (Veh control n=10 cells, CCL5 n=9 cells, *P < 0.05, two-way repeated measures ANOVA). c, Representative images of colocalization between c-Fos and Opto-CCR5-EGFP after light stimulation and novel context exposure. Scale bar, 50 μm. d, Percentage of c-Fos+EGFP+ cells at different power levels (0 mW n=13, 2 mW n=3, 4 mW n=5, 8 mW n=3 mice; ****P < 0.0001, two-way repeated measures ANOVA). e, Colocalization between c-Fos+ cells and EGFP+ cells after normalization to chance level. (0 mW n=13, 2 mW n=3, 4 mW n=5, 8 mW n=3 mice; *P < 0.05, ** P < 0.01, one-way ANOVA). f, Schematics & representative images of Ccr5 expression and the overlap between memory ensembles of context A (mCherry) and context B (c-Fos) with a 12h interval between the two contextual exposures. Scale bar, 20 μm. g, The probability of Ccr5 expression in the overlapping cells is lower than that in the non-overlapping cells (n=6 mice; **P < 0.01, paired t-test). h, Probability of ensemble overlap (between context A and context B) and Ccr5 expression in mCherry+ cells (ensemble for context A) are negatively corelated (n=6 mice; R=0.7081, P < 0.05). i, Schematics for miniscope setup and calcium signal identification. Images were collected from mice exploring different contexts separated by either 5h, 1d, 2d, or 7d. Scale bar, 50 μm. j, Neuronal overlap between different contexts. Scale bar, 50 μm. k, Overlapping index for WT and Ccr5−/− mice (WT 5 h–7 d n = 7 mice; Ccr5 5 h n = 7, 1 d–7 d n = 6 mice; **P < 0.01, two-way ANOVA). All results shown as mean ± s.e.m.
Fig. 4|
Fig. 4|. Enhanced CCL5/CCR5 signaling contributes to age-related memory linking deficits.
a, Middle-aged HC mice had higher Ccr5 and Ccl5 mRNA levels in dCA1 than young HC mice (Ccr5: young n=14, aged n=6, Ccl5: young n=12, aged n=5; *P < 0.05, ****P < 0.0001, Student’s t-test). b, Ccr5 and Ccl5 expression after fear conditioning in dCA1 of middle-aged mice (Ccr5: n=6 for all groups, Ccl5: HC n=5, 3h n=6, 6h n=6; **P < 0.01, ***P < 0.001, one-way ANOVA). c, Representative images of Ccr5, Itgam and Rbfox3 mRNA expression in dCA1 from naïve young or middle-aged mice. Red arrows: cells expressing Ccr5 and Itgam. Orange arrows: cells expressing Ccr5 and Rbfox3. Scale bar, 50 μm. d, Number of Ccr5-expressing microglia and neurons in young or middle-aged mice (young n=5, aged n=4 mice; *P < 0.05, Student’s t-test). e, Representative images of Ccl5, Itgam and Rbfox3 mRNA expression in dCA1 from naïve young or middle-aged mice. Red arrows: cells expressing Ccr5 and Itgam. Orange arrows: cells expressing Ccr5 and Rbfox3. Scale bar, 50 μm. f, Number of Ccl5-expressing microglia and neurons in young or middle-aged mice (n=5 mice; ***P < 0.001, Student’s t-test). g, Ccr5 knockout rescued 5h memory linking deficits in middle-aged mice (WT n=7, Ccr5−/− n=8; **P < 0.01, ***P < 0.001, two-way repeated measures ANOVA). h, Maraviroc, a CCR5 antagonist, rescued 5h memory linking deficits in middle-aged mice (Veh n=15, maraviroc n=14; *P < 0.05, **P < 0.01, two-way repeated measures ANOVA). All results shown as mean ± s.e.m.

Comment in

References

    1. Cai DJ et al. A shared neural ensemble links distinct contextual memories encoded close in time. Nature 534, 115–118 (2016). - PMC - PubMed
    1. Rashid AJ et al. Competition between engrams influences fear memory formation and recall. Science 353, 383–387 (2016). - PMC - PubMed
    1. Abdou K et al. Synapse-specific representation of the identity of overlapping memory engrams. Science 360, 1227–1231, doi:10.1126/science.aat3810 (2018). - DOI - PubMed
    1. Yetton BD, Cai DJ, Spoormaker VI, Silva AJ & Mednick SC Human Memories Can Be Linked by Temporal Proximity. Front Hum Neurosci 13, 315, doi:10.3389/fnhum.2019.00315 (2019). - DOI - PMC - PubMed
    1. Mack ML, Love BC & Preston AR Building concepts one episode at a time: The hippocampus and concept formation. Neurosci Lett 680, 31–38, doi:10.1016/j.neulet.2017.07.061 (2018). - DOI - PMC - PubMed