. 2022 Jun;606(7913):382-388.
doi: 10.1038/s41586-022-04765-3. Epub 2022 May 25.

Defining mitochondrial protein functions through deep multiomic profiling

Affiliations

Defining mitochondrial protein functions through deep multiomic profiling

Jarred W Rensvold et al. Nature. 2022 Jun.

Abstract

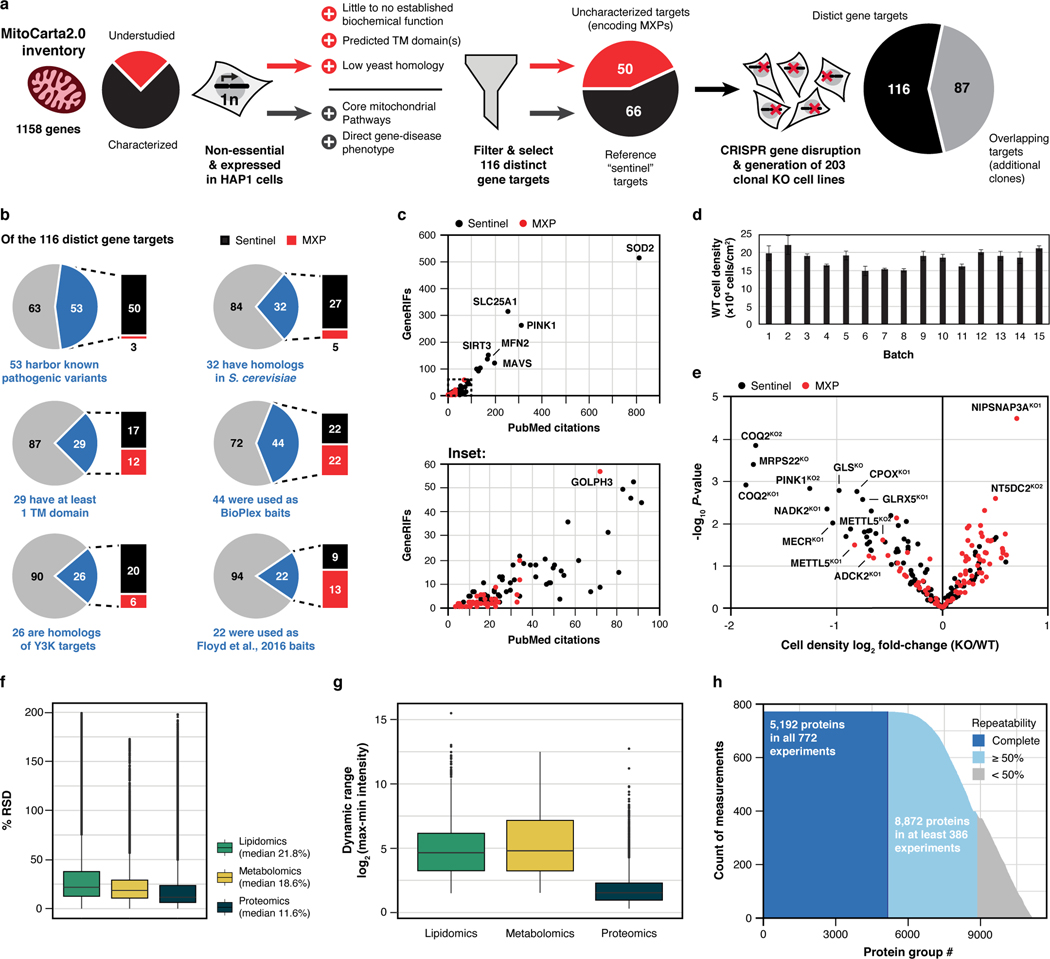
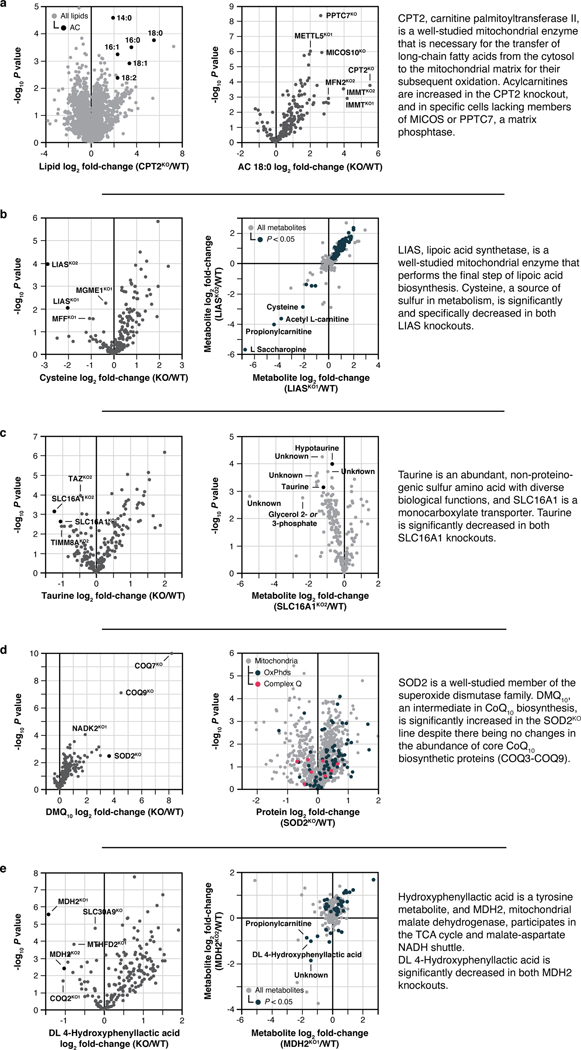
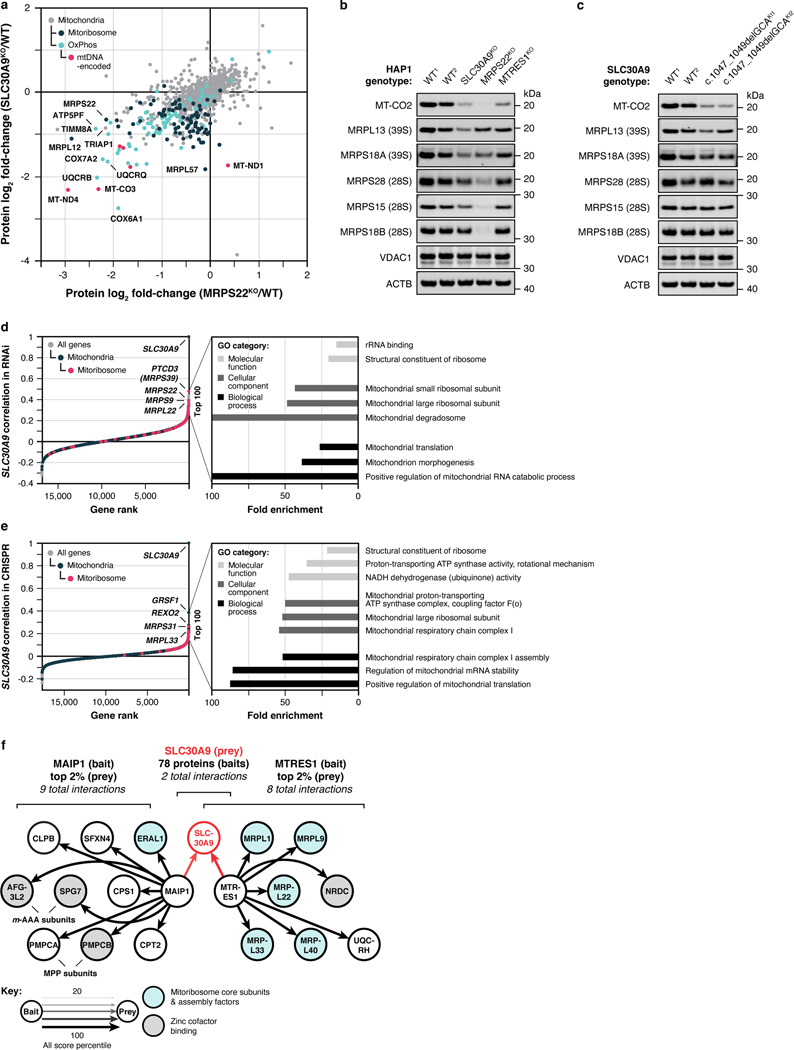
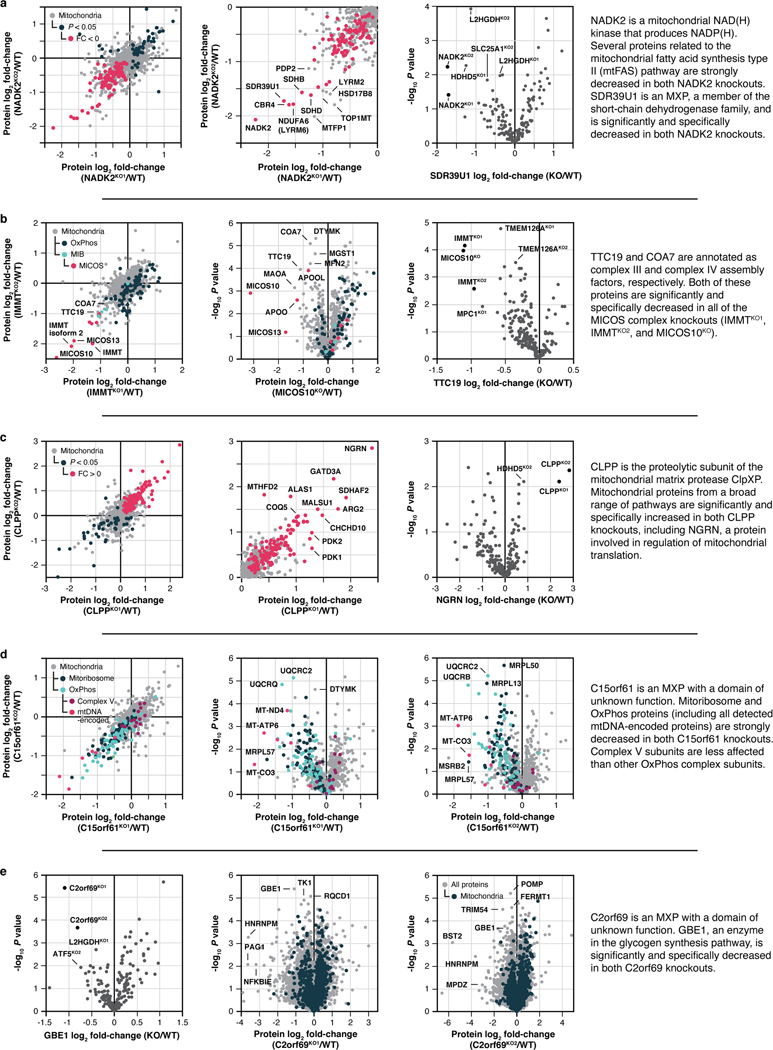
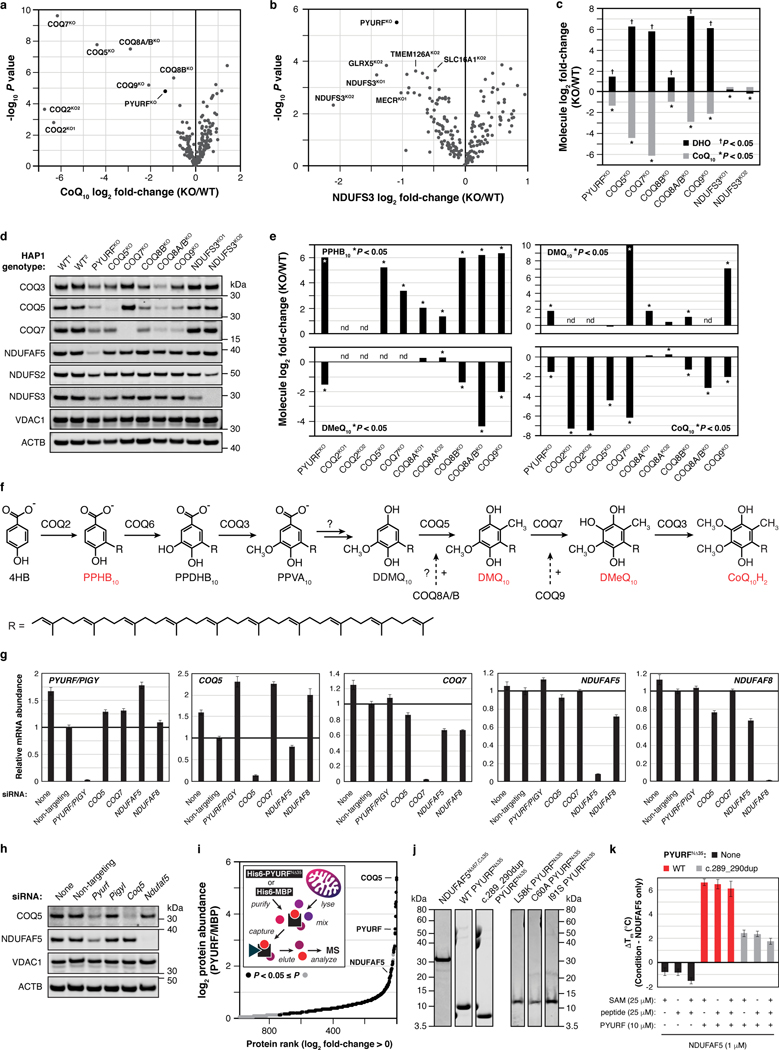
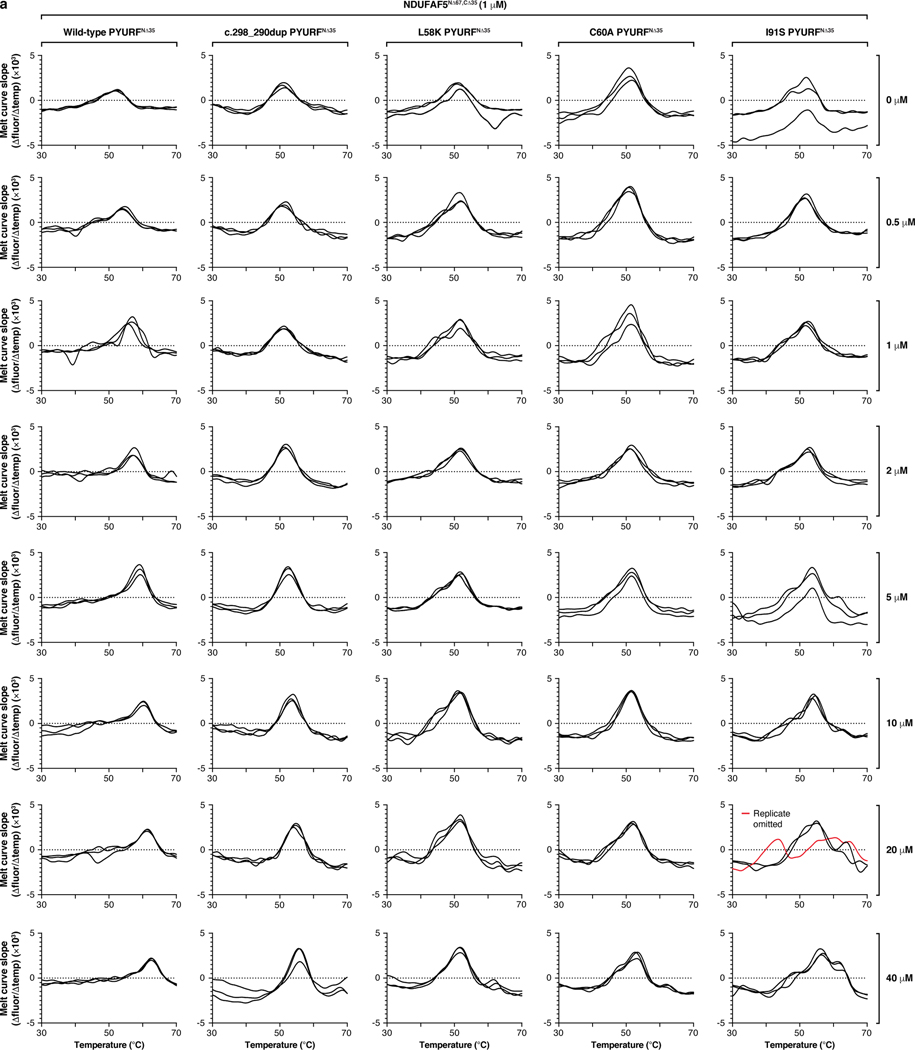
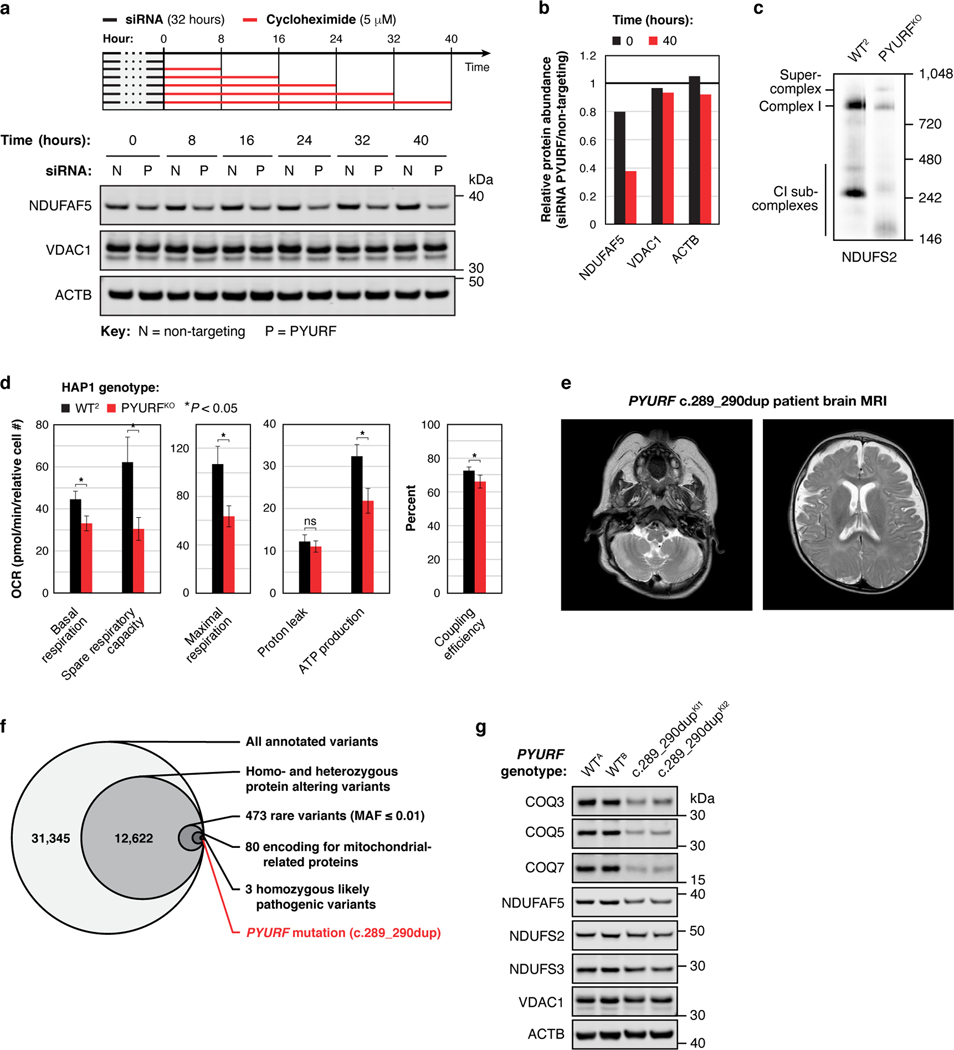
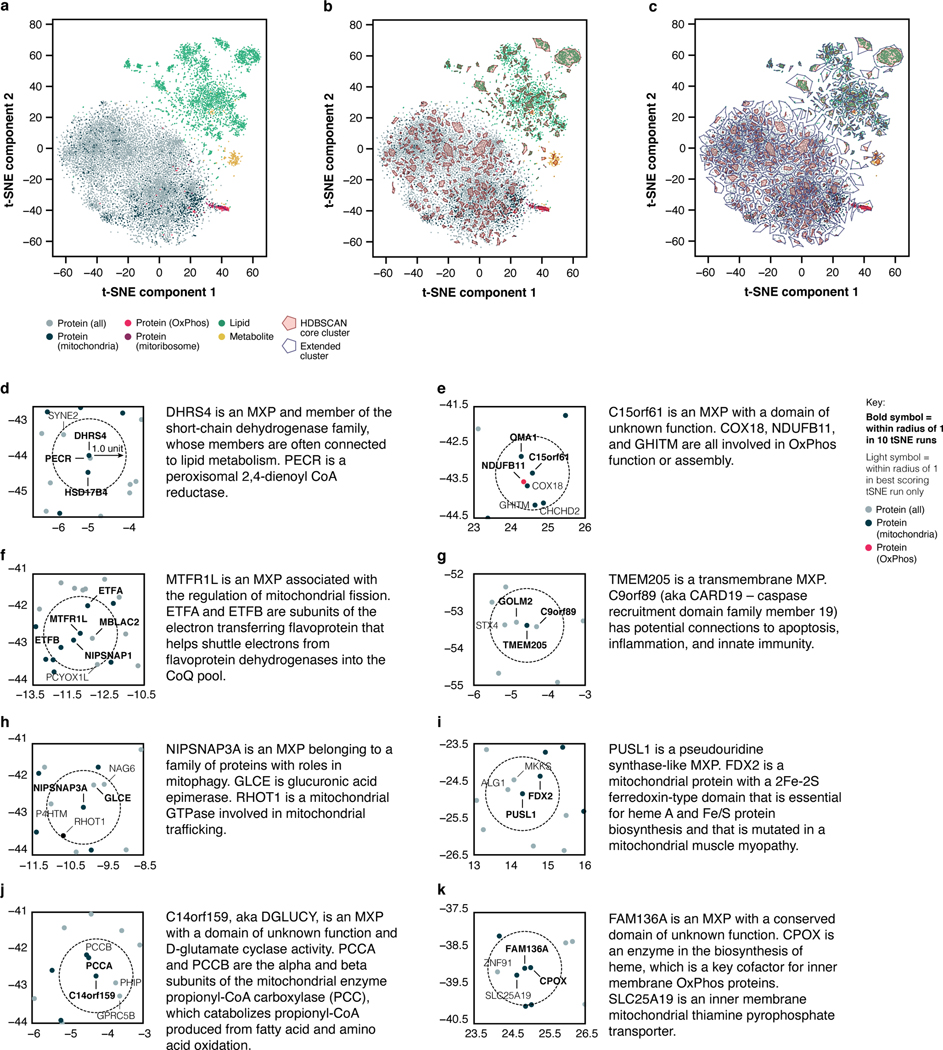
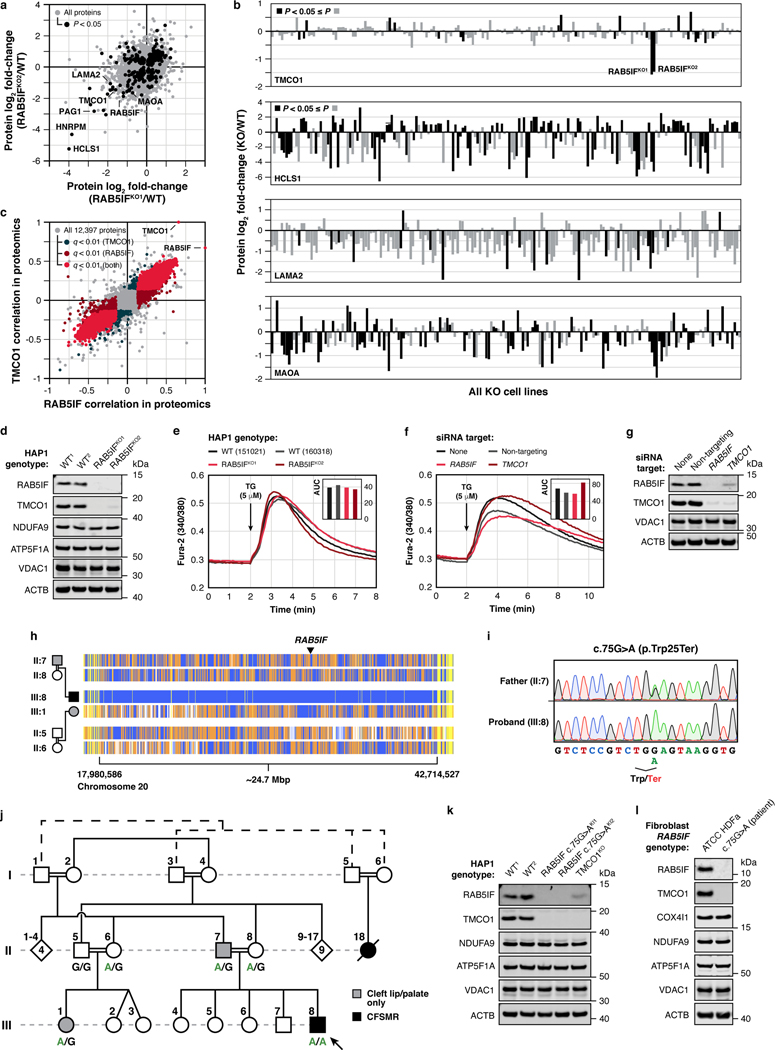
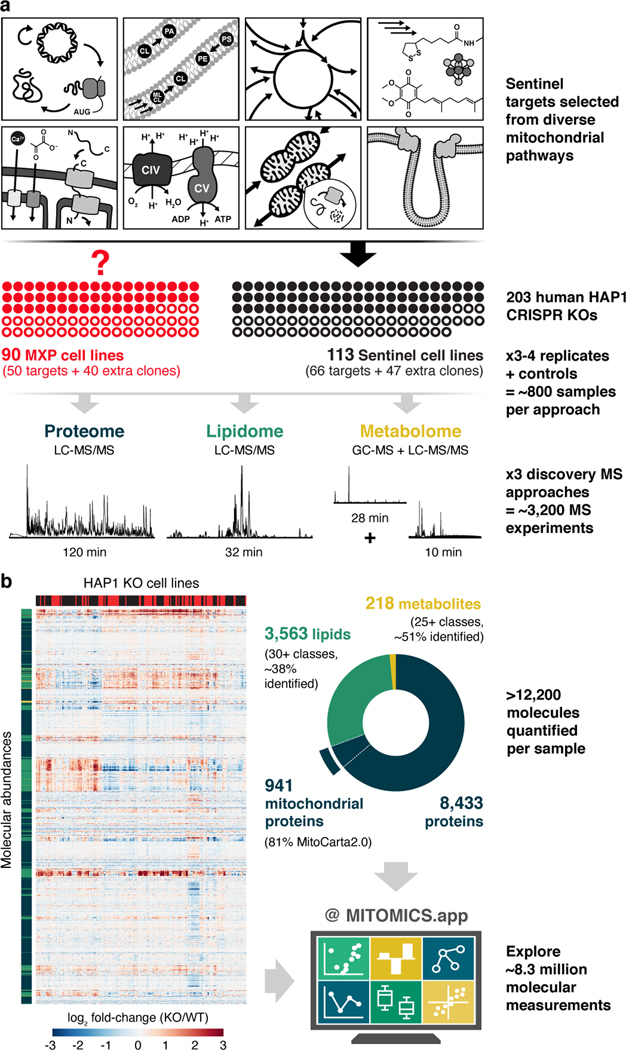
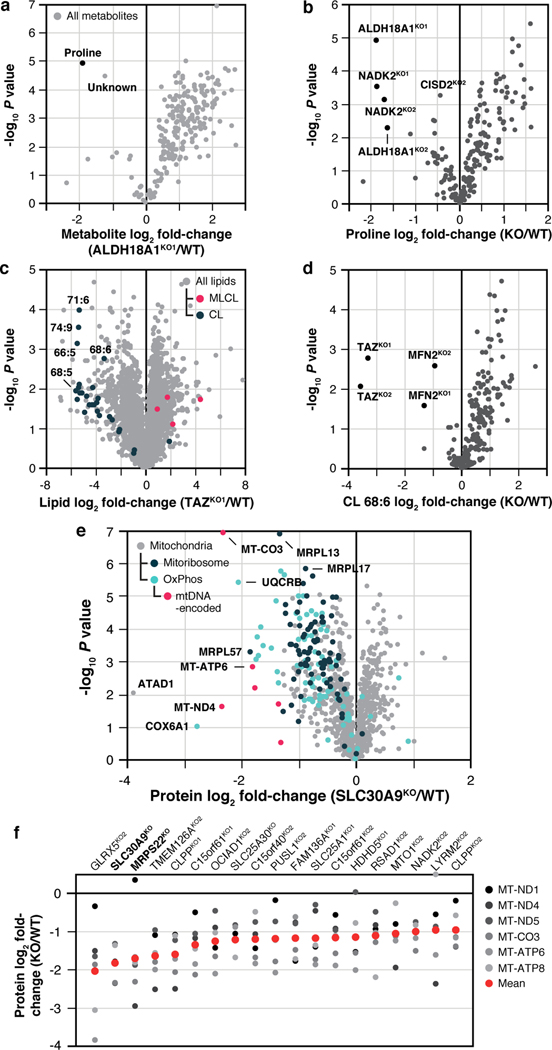
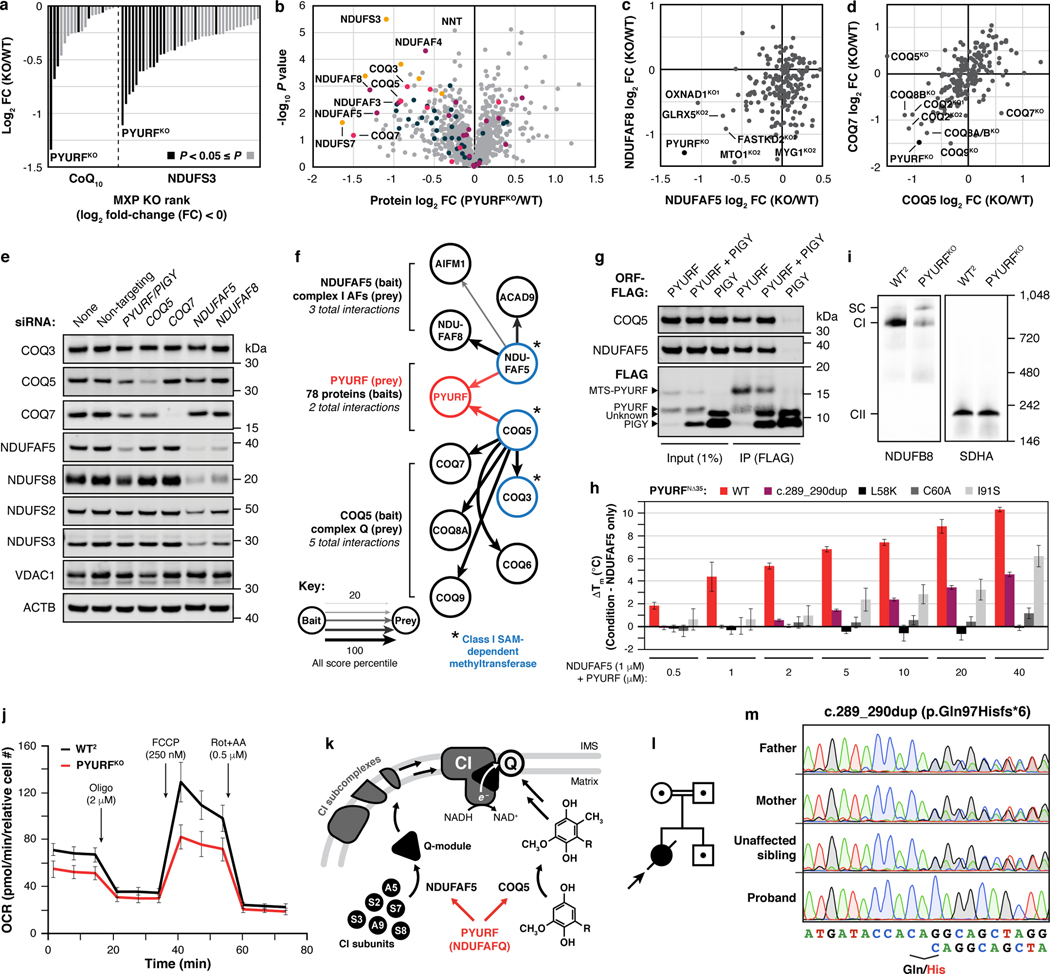
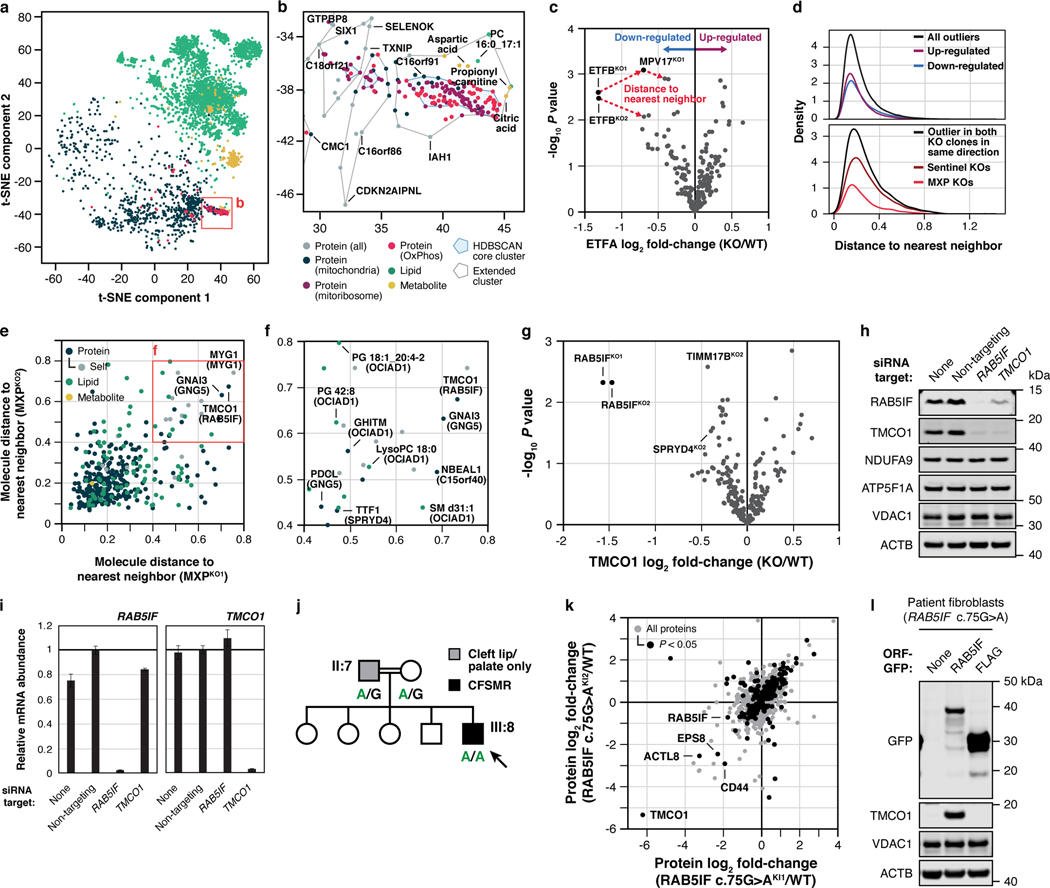
Mitochondria are epicentres of eukaryotic metabolism and bioenergetics. Pioneering efforts in recent decades have established the core protein componentry of these organelles1 and have linked their dysfunction to more than 150 distinct disorders2,3. Still, hundreds of mitochondrial proteins lack clear functions4, and the underlying genetic basis for approximately 40% of mitochondrial disorders remains unresolved5. Here, to establish a more complete functional compendium of human mitochondrial proteins, we profiled more than 200 CRISPR-mediated HAP1 cell knockout lines using mass spectrometry-based multiomics analyses. This effort generated approximately 8.3 million distinct biomolecule measurements, providing a deep survey of the cellular responses to mitochondrial perturbations and laying a foundation for mechanistic investigations into protein function. Guided by these data, we discovered that PIGY upstream open reading frame (PYURF) is an S-adenosylmethionine-dependent methyltransferase chaperone that supports both complex I assembly and coenzyme Q biosynthesis and is disrupted in a previously unresolved multisystemic mitochondrial disorder. We further linked the putative zinc transporter SLC30A9 to mitochondrial ribosomes and OxPhos integrity and established RAB5IF as the second gene harbouring pathogenic variants that cause cerebrofaciothoracic dysplasia. Our data, which can be explored through the interactive online MITOMICS.app resource, suggest biological roles for many other orphan mitochondrial proteins that still lack robust functional characterization and define a rich cell signature of mitochondrial dysfunction that can support the genetic diagnosis of mitochondrial diseases.


Conflict of interest statement

Competing interest declaration

J.J.C. is a consultant for Thermo Fisher Scientific.

Figures

Extended Data Fig. 1 |
Extended Data Fig. 1 |. MITOMICS design, target selection, and quality control.
a, Criteria and filtering approach for knockout (KO) target selection. b, Features of each gene target and their representation in other select large-scale analyses at the time of selection. Metrics were taken from OMIM (omim.org), NCBI HomoloGene (ncbi.nlm.nih.gov/homologene), TMHMM (PMID: 11152613), The BioPlex Interactome (PMID: 28514442), The Y3K Project (PMID: 27669165), and Floyd et al., 2016 (PMID: 27499296). c, PubMed citations versus NCBI GeneRIFs (References Into Function) for each gene target at the time of selection. d, Cell density of wild-type (WT) reference cells across each analysis batch that were used to normalize cell growth measurements (mean ± s.d., n = 3–4). e, Relative cell density of each KO cell line compared to WT cells versus statistical significance (mean, n = 3–4, two-sided Welch’s t-test). f, Distribution of % relative standard deviation (% RSD) of molecular abundance measurements made in 3–4 replicates of the KO cell lines. g, Distribution of log2 range in measured molecular abundances of all analytes calculated by subtracting the minimum observed intensity from the maximum observed intensity of each molecule across all cell lines. h, Histogram illustrating the count of quantitative measurements made per protein group across all analyzed samples.
Extended Data Fig. 2 |
Extended Data Fig. 2 |. MITOMICS profiles suggest new mitochondrial protein functions.
a-e, Relative molecule abundance (protein, lipid, or metabolite) in the indicated KO compared to WT versus statistical significance, relative molecule abundance in KO versus KO compared to WT, or relative abundance of an individual molecule versus statistical significance across all KO lines with an accompanying summary of our observations. Data displayed as mean, n = 3–4, and two-sided Welch’s t-test for all panels.
Extended Data Fig. 3 |
Extended Data Fig. 3 |. SLC30A9 is necessary for mitochondrial ribosome and OxPhos protein integrity.
a, Relative protein abundance in HAP1 MRPS22KO cells versus SLC30A9KO cells compared to WT cells with mitoribosome, OxPhos, and mtDNA-encoded proteins highlighted. Data displayed as mean, n = 3–4, and two-sided Welch’s t-test. b, Level of mtDNA-encoded MT-CO2 and mitoribosome proteins in the indicated KO cell lines as assessed by immunoblotting. c, Level of the indicated proteins in HAP1 WT and SLC30A9 c.1047_1049delGCA knock-in cells (two clones) as assessed by immunoblotting. d, e, Gene correlations with SLC30A9 in DepMap project RNAi (d) and CRISPR (e) datasets with genes encoding mitochondrial and mitoribosome proteins highlighted and the top three GO annotations (most specific subclass term within a functional class) in each category for the 100 highest-ranking genes. f, Meta-analysis of protein-protein interaction data from Floyd et al., 2016 (PMID: 27499296) (Ref. #26) displaying the two bait proteins (out of 78) that interacted with SLC30A9 and the top 2% of their interactors with mitoribosome core subunits, mitoribosome assembly factors, and zinc cofactor binding proteins (based on UniProt annotations) highlighted. For western source data, see Supplementary Figure 1.
Extended Data Fig. 4 |
Extended Data Fig. 4 |. Additional molecule-centric analyses suggest mitochondrial protein functions.
a-e, Relative protein abundance in the indicated KO compared to WT versus statistical significance, relative protein abundance in KO versus KO compared to WT, or relative abundance of an individual protein versus statistical significance across all KO lines with an accompanying summary of our observations. Data displayed as mean, n = 3–4, and two-sided Welch’s t-test for all panels.
Extended Data Fig. 5 |
Extended Data Fig. 5 |. PYURF (NDUFAFQ) is a CoQ- and CI-related chaperone.
a, b, Relative abundance of CoQ10 (a) and NDUFS3 (b) versus statistical significance across all KO lines. c, Relative abundance of dihydroorotate (DHO) and CoQ10 in the indicated KO cell lines compared to WT cells. (a-c) Data displayed as mean, n = 3–4, and two-sided Welch’s t-test. d, Level of complex I (CI), CI-assembly factor, and CoQ biosynthetic proteins in the indicated KO cell lines as assessed by immunoblotting. e, Relative abundance of CoQ10 and biosynthetic pathway intermediates analyzed via targeted LC-MS (mean, n = 3–4, two-sided Welch’s t-test). PPHB, polyprenyl-hydroxybenzoate; DMQ, demethoxy-coenzyme Q; DMeQ, demethyl-coenzyme Q. f, CoQ biosynthesis pathway following polyisoprenoid tail attachment. Molecules quantified in (e) are indicated in red. 4-HB, 4-hydroxybenzoate; PPDHB, polyprenyl-dihydroxybenzoate; PPVA, polyprenyl-vanillic acid; DDMQ, demethoxy-demethyl-coenzyme Q. Supportive role for reactions is indicated by ‘+’ symbol next to arrows. g, Level of the indicated transcripts in 293 cells treated with siRNA for five days as assessed by qPCR (mean ± s.d., n = 3). h, Level of COQ5 and NDUFAF5 in mouse C2C12 cells treated with the indicated siRNAs for five days as assessed by immunoblotting. i, Relative abundance of protein interactors for WT PYURF compared to maltose-binding protein (MBP) captured from a HAP1 mitochondrial lysate detected via immunoprecipitation (IP)-LC-MS/MS analysis (mean, n = 3, two-sided Student’s t-test). j, Purity of NDUFAF5, WT PYURF, c.289_290dup patient variant, and point mutants analyzed via SDS-PAGE and Coomassie stain. k, Melting temperature of NDUFAF5 with combinations of WT PYURF or c.289_290dup mutant PYURF, peptide, and S-adenosylmethionine (SAM) compared to NDUFAF5 only as measured by differential scanning fluorimetry (mean ± s.d., n = 3). For western and gel source data, see Supplementary Figure 1.
Extended Data Fig. 6 |
Extended Data Fig. 6 |. Mutations to PYURF disrupt binding and stability of NDUFAF5.
a, First-derivative plots of the differential scanning fluorimetry analysis in Fig. 3h (n = 3).
Extended Data Fig. 7 |
Extended Data Fig. 7 |. PYURF (NDUFAFQ) is important for mitochondrial function and is disrupted in human disease.
a, b, Level of the indicated proteins in 293 cells during a cyclohexamide chase experiment following PYURF knockdown (a), and quantification of the immunoblot data (b). c, Level of assembled complex I in HAP1 WT and PYURFKO cells as assessed by BN-PAGE and immunoblotting. d, Parameters of mitochondrial function for WT and PYURFKO cells calculated from the mitochondrial stress test assay in Fig. 3j (mean ± s.d., n = 10–14, two-sided Student’s t-test). e, Brian MRI of the PYURF case demonstrating increased extra axial CSF spaces, cystic high signal cerebellar white-matter, cerebellar atrophy, and decreased myelination in the internal capsule. f, Whole exome sequencing analysis and filtering for rare, autosomal recessive variants in nuclear genes encoding mitochondrial proteins. MAF, minor allele frequency. g, Level of the indicated proteins in HAP1 unedited PYURF WT cells and PYURF c.289_290dup knock-in cells (two clones each) as assessed by immunoblotting. For western source data, see Supplementary Figure 1.
Extended Data Fig. 8 |
Extended Data Fig. 8 |. t-SNE analyses suggest functions for MXPs.
a-c, t-SNE analysis of the MITOMICS data (mean log2 fold-changes and associated multi-ome q-values from 191 conditions) displaying all molecules (a), core clusters (b), and extended clusters (c). d-k, Analysis of the MXP KO targets in the t-SNE plot to identify proteins that fall within their close proximity (one unit radius) with accompanying summaries of our observations.
Extended Data Fig. 9 |
Extended Data Fig. 9 |. RAB5IF is mutated in CFSMR.
a, Relative protein abundance in RAB5IFKO1 cells versus RAB5IFKO2 cells compared to WT. b, Relative abundance of indicated proteins across all KO lines. (a, b) Data displayed as mean, n = 3–4, and two-sided Welch’s t-test. c, Protein correlations with RAB5IF versus protein correlations with TMCO1 in the DepMap proteomics dataset. d, Level of the indicated proteins in HAP1 WT and RAB5IF KO cells assessed by immunoblotting. e, f, Fura-2 fluorescence (mean, n = 3) following thapsigargin (TG) treatment in WT and RAB5IF KO cells (e), and HeLa cells treated with indicated siRNAs for three days (f) with area under the curve (AUC) measurements. g, RAB5IF and TMCO1 levels in HeLa cells treated with indicated siRNAs for three days assessed by immunoblotting. h, Homozygosity mapping of a 24.7 Mbp candidate region in chromosome 20p11.23-q13.12. Homozygous genotypes in the index (III:8) shown in blue. In other individuals, identical homozygous genotypes are also in blue, whereas contrasting homozygous genotypes are in white. Heterozygous genotypes are orange, while non-informative genotypes resulting from heterozygous SNPs in parent-child trios are yellow. Note that the index is homozygous for the candidate region, while the cousin (III:1) is heterozygous for the entire region. i, Sanger sequencing showing the c.75G>A (p.Trp25*) mutation as homozygous in the index (III:8) and heterozygous in his father (II:7). j, Pedigree of affected family with genotypes and associated phenotypes. Note that individuals II:7 and III:1 only have cleft lip and/or palate without other clinical features of CFSMR and are heterozygous for the RAB5IF variant. k, l, Indicated protein levels in HAP1 WT and RAB5IF c.75G>A knock-in cells (2 clones) (k), and normal adult human primary dermal fibroblasts (HDFa) and primary patient fibroblasts with the RAB5IF c.75G>A mutation (l) assessed by immunoblotting. For western source data, see Supplementary Figure 1.
Fig. 1 |
Fig. 1 |. MITOMICS experimental design and data resource summary.
a, Overview of the experimental workflow, including knockout (KO) target selection, analysis strategy, and data collection. KO targets were selected to include genes coding for MXPs and for sentinel proteins known to be involved in diverse mitochondrial processes. Each cell line was analyzed using three distinct mass spectrometric approaches: proteins via LC-MS/MS shotgun proteomics, lipids via LC-MS/MS discovery lipidomics, and metabolites via GC-MS and LC-MS/MS untargeted metabolomics. MXP, Mitochondrial uncharacterized (X) protein (P). b, Hierarchical clustering of biomolecule abundances (proteins, lipids, and metabolites) in 203 knockout cell lines compared to wild-type (WT) cells (mean, n = 3–4), and breakdown of >12,200 biomolecules quantified in each cell line by class, explorable via interactive visualizations at MITOMICS.app.
Fig. 2 |
Fig. 2 |. Molecule-centric analyses suggest new mitochondrial protein functions.
a, Relative metabolite abundance in ALDH18A1KO1 cells compared to WT cells versus statistical significance. b, Relative abundance of proline versus statistical significance across all KO lines. c, Relative lipid abundance in TAZKO1 cells compared to WT cells versus statistical significance with all CL and MLCL species highlighted. CL, cardiolipin; MLCL, Monolysocardiolipin. d, Relative abundance of CL 68:6 versus statistical significance across all KO lines. e, Relative protein abundance in SLC30A9KO cells compared to WT cells versus statistical significance with mitoribosome, OxPhos, and mtDNA-encoded proteins highlighted. f, Relative abundance of all six mtDNA-encoded proteins detected in our analyses across KO lines with ≥ 3 proteins having P < 0.05 (mean rank ordered). Data displayed as mean, n = 3–4, and two-sided Welch’s t-test for all panels.
Fig. 3 |
Fig. 3 |. PYURF (NDUFAFQ) is a CoQ- and CI-related chaperone disrupted in human disease.
a, Relative abundance of CoQ10 and NDUFS3 across MXP KOs with log2 fold-changes < 0. b, Relative protein abundance in PYURFKO cells compared to WT versus statistical significance with CoQ-related proteins (COQ3-COQ9), complex I (CI), CI Q-module, and CI-assembly factor (AF) proteins highlighted. c, d, Relative abundance of NDUFAF5 versus NDUFAF8 (c), and COQ5 versus COQ7 (d) compared to WT across all KO lines, respectively. (a-d) Data displayed as mean, n = 3–4, and two-sided Welch’s t-test. e, CI, CI-AF, and CoQ biosynthetic protein levels in 293 cells treated with indicated siRNAs for five days assessed by immunoblotting. f, Meta-analysis of protein-protein interaction data displaying the 2/78 bait proteins, NDUFAF5 and COQ5, that interact with PYURF, and related CI-AF and complex Q proteins. g, COQ5 and NDUFAF5 levels in immunoprecipitates from 293 cells transfected with PYURF-FLAG, PYURF-FLAG-PIGY-FLAG, and PIGY-FLAG constructs. h, Melting temperature of NDUFAF5 with increasing concentrations of WT PYURF, c.289_290dup patient variant, or point mutants compared to NDUFAF5 only measured by differential scanning fluorimetry (mean ± s.d., n = 3). i, Level of assembled complex I (left) and complex II (right) in HAP1 WT and PYURFKO cells assessed by BN-PAGE and immunoblotting. SC, respiratory supercomplex. j, Mitochondrial stress test profile showing cellular oxygen consumption rate normalized to relative cell number versus time for WT and PYURFKO cells (mean ± s.d., n = 10–14). k, Model of PYURF function in coordinating the CI assembly and CoQ biosynthesis pathways. l, Pedigree of consanguineous kindred and their offspring. Arrow indicates the deceased index case. Dots indicate carriers of the c.289_290dup PYURF variant. m, Sanger sequencing traces displaying heterozygous carrier status in the father, mother, and unaffected sibling, and the homozygous PYURF variant in the proband. For western source data, see Supplementary Figure 1.
Fig. 4 |
Fig. 4 |. t-SNE and KO-specific phenotype analyses connect MXPs to mitochondrial functions.
a, b, t-SNE analysis of the MITOMICS data (a) (mean log2 fold-changes and associated multi-ome q-values from 191 conditions) and inset (b) showing clusters of known OxPhos and mitoribosome proteins and other biomolecules clustering with these pathways. c, Example of the KO-specific phenotype detection approach showing ETFBKO1 and ETFBKO2 as outlier KOs for ETFA (relative abundance versus statistical significance across all KO lines) (mean, n = 3–4, two-sided Welch’s t-test). d, Normalized density plot of nearest neighbor distances showing the number of KO-specific phenotypes identified as up- or down-regulated, and identified in both KO clones and in the same direction of regulation for sentinel KOs and MXP KOs. e, f, Molecule distance to nearest neighbor in MXP KO clone 1 versus KO clone 2 (e) and inset (f) showing molecules with large nearest neighbor distances detected for both MXP KO clones (KO target indicated in parentheses). g, Relative abundance of TMCO1 versus statistical significance across all KO lines (mean, n = 3–4, two-sided Welch’s t-test). h, i, Level of the indicated proteins (h) and transcripts (i) in 293 cells treated with siRNA for two days as assessed by immunoblotting and qPCR (mean ± s.d., n = 3), respectively. j, Abbreviated pedigree of affected family and associated phenotypes. Arrow indicates proband. k, Relative protein abundance in HAP1 RAB5IF c.75G>A knock-in cells (clone 1 versus clone 2) compared to WT cells (mean, n = 3, two-sided Student’s t-test). l, Level of TMCO1 in primary patient fibroblasts with the RAB5IF c.75G>A mutation transfected with RAB5IF-GFP or FLAG-GFP constructs as assessed by immunoblotting. For western source data, see Supplementary Figure 1.

Comment in

References

    1. Calvo SE & Mootha VK The mitochondrial proteome and human disease. Annu Rev Genomics Hum Genet 11, 25–44, doi: 10.1146/annurev-genom-082509-141720 (2010). - DOI - PMC - PubMed
    1. Vafai SB & Mootha VK Mitochondrial disorders as windows into an ancient organelle. Nature 491, 374–383, doi: 10.1038/nature11707 (2012). - DOI - PubMed
    1. Nunnari J.& Suomalainen A.Mitochondria: in sickness and in health. Cell 148, 1145–1159, doi: 10.1016/j.cell.2012.02.035 (2012). - DOI - PMC - PubMed
    1. Pagliarini D.et al. A mitochondrial protein compendium elucidates complex I disease biology. Cell 134, 112–123, doi: 10.1016/j.cell.2008.06.016 (2008). - DOI - PMC - PubMed
    1. Frazier AE, Thorburn DR & Compton AG Mitochondrial energy generation disorders: genes, mechanisms, and clues to pathology. J Biol Chem 294, 5386–5395, doi: 10.1074/jbc.R117.809194 (2019). - DOI - PMC - PubMed