. 2022 Jun;606(7916):992-998.
doi: 10.1038/s41586-022-04772-4. Epub 2022 May 25.

A vaccine targeting resistant tumours by dual T cell plus NK cell attack

Affiliations

A vaccine targeting resistant tumours by dual T cell plus NK cell attack

Soumya Badrinath et al. Nature. 2022 Jun.

Abstract

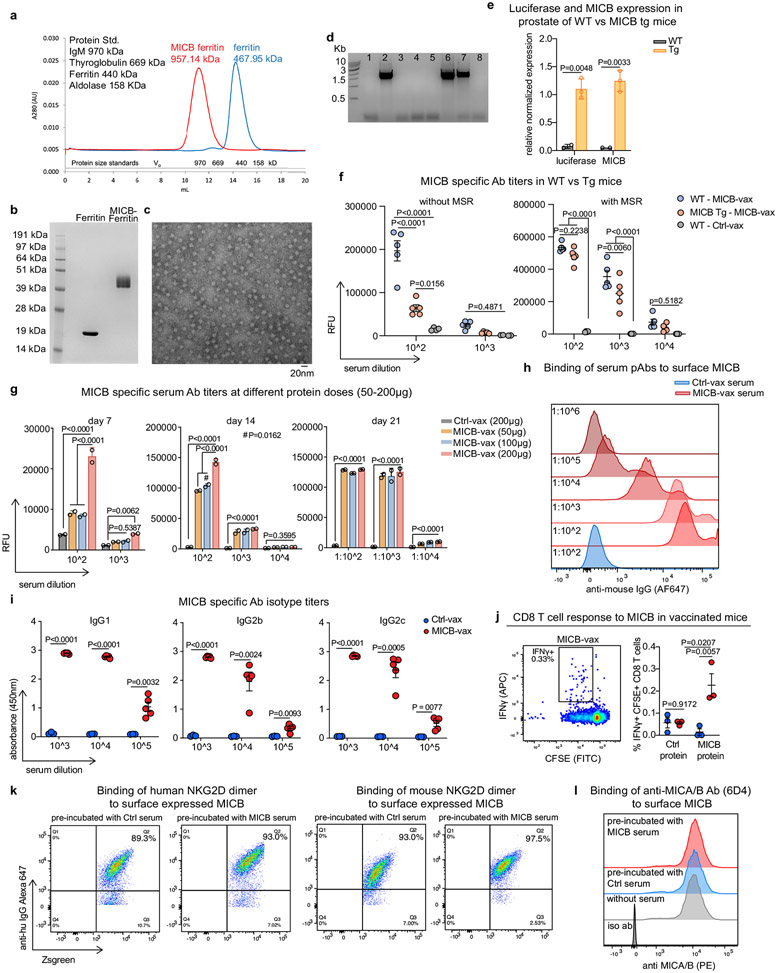
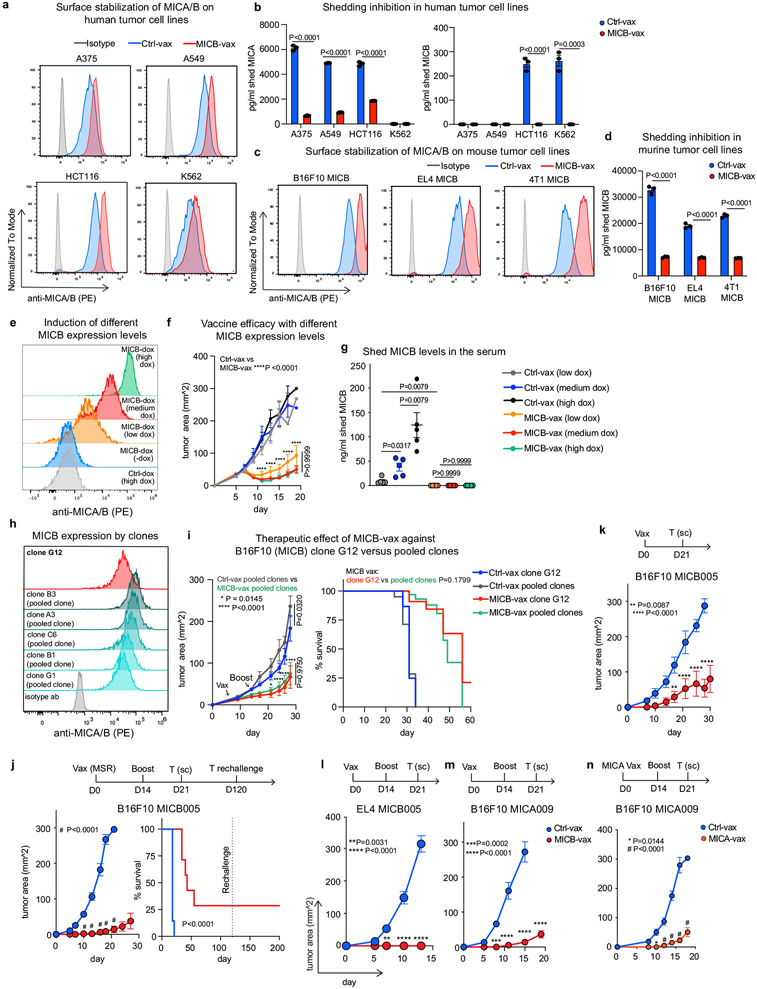
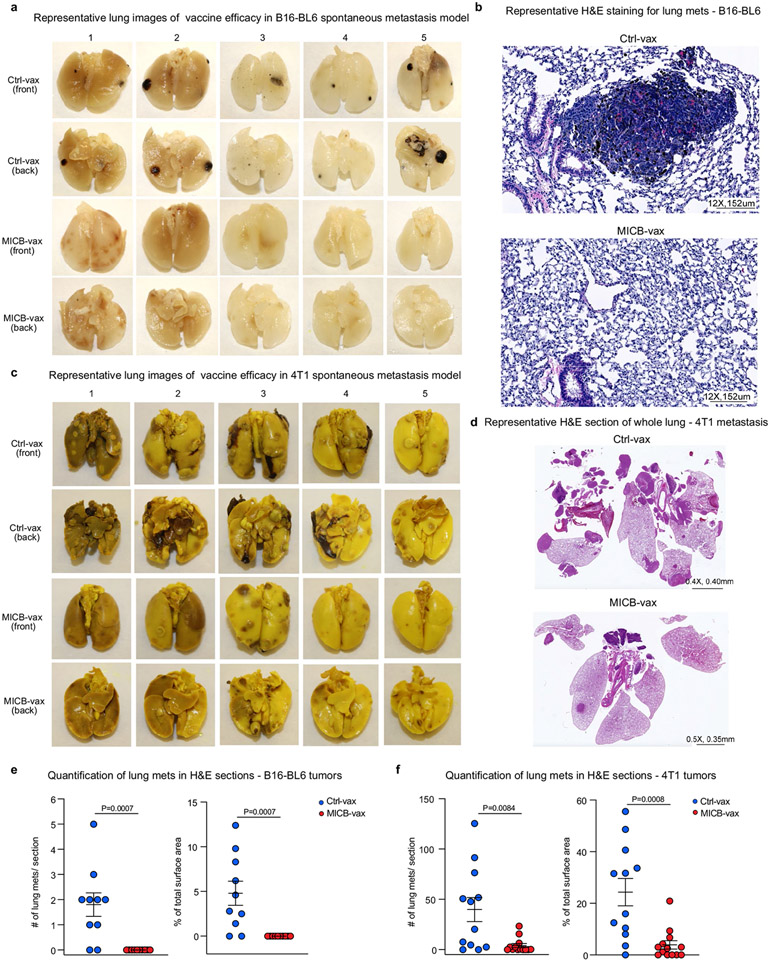
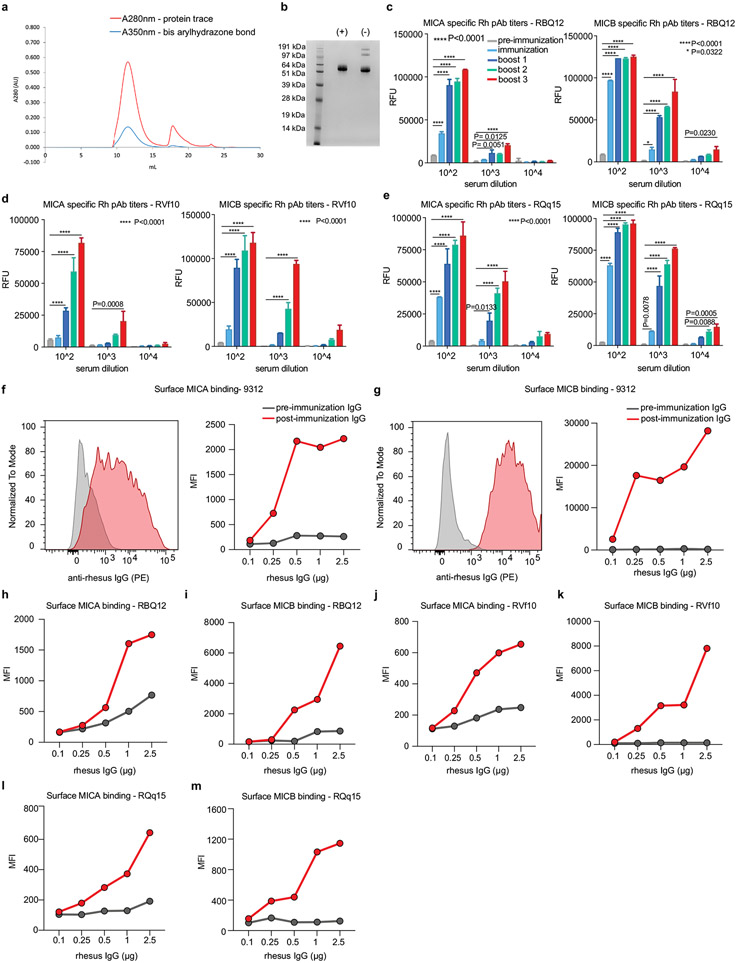
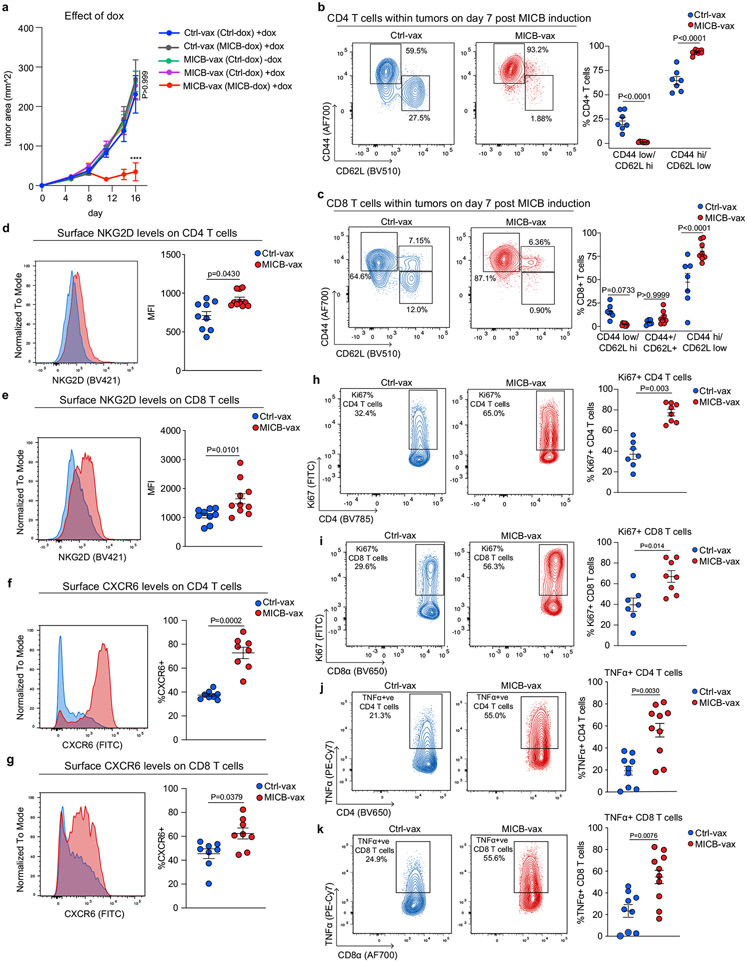
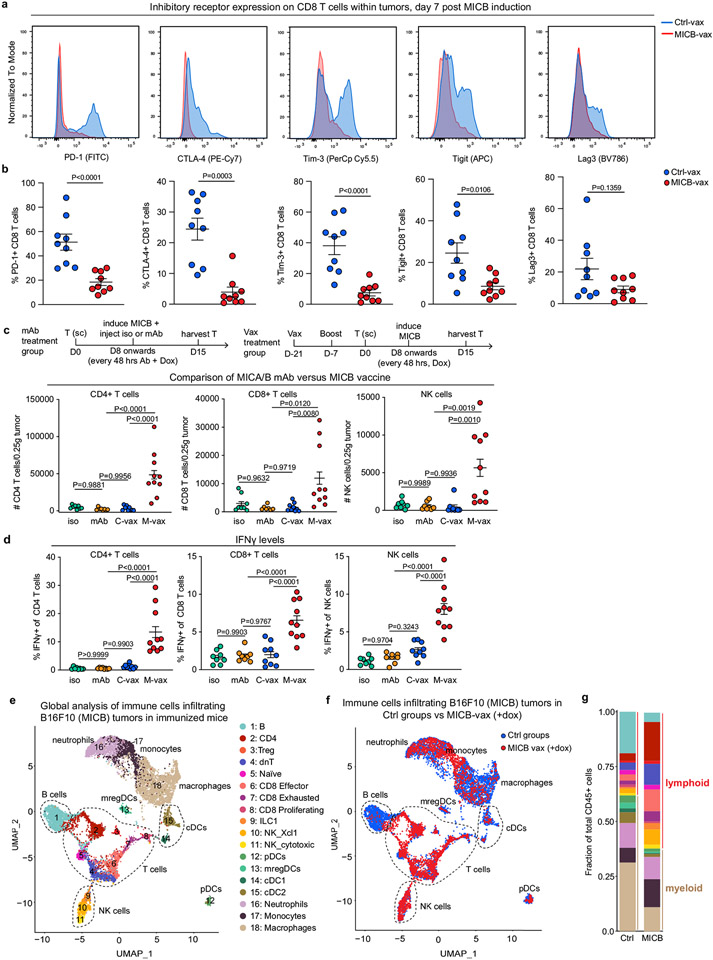
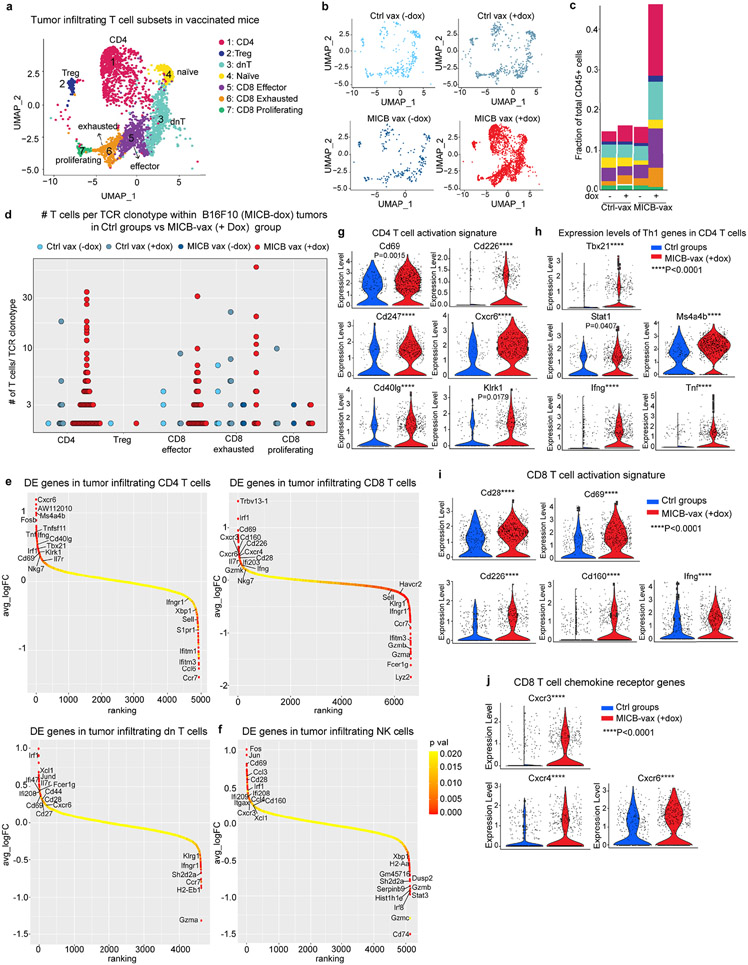
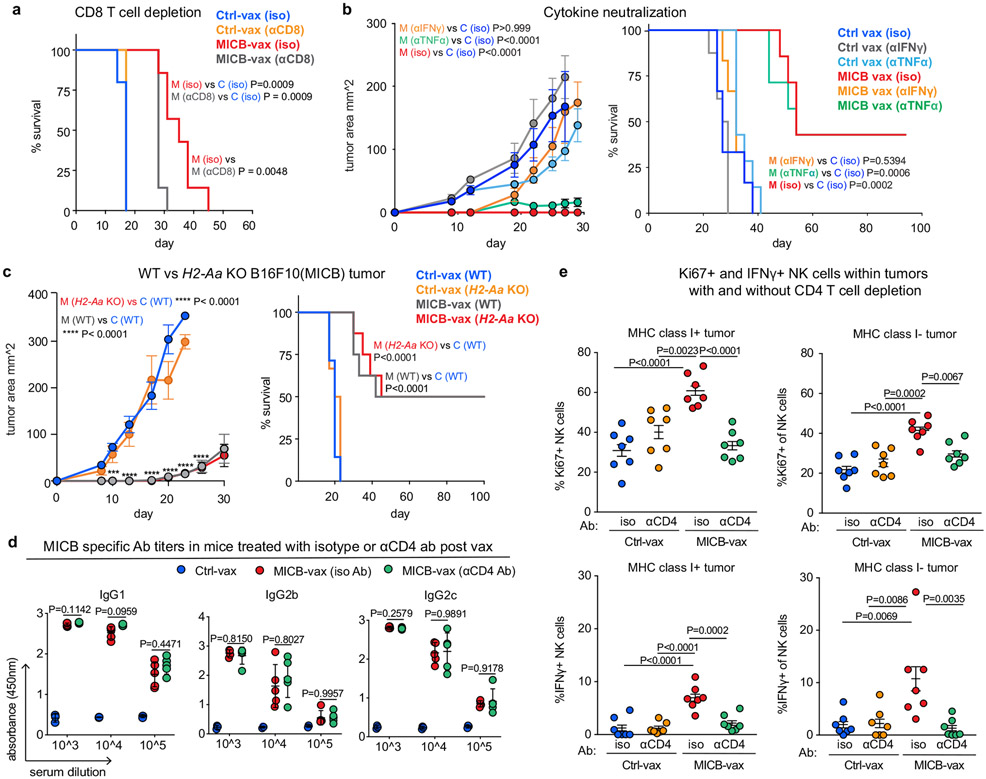
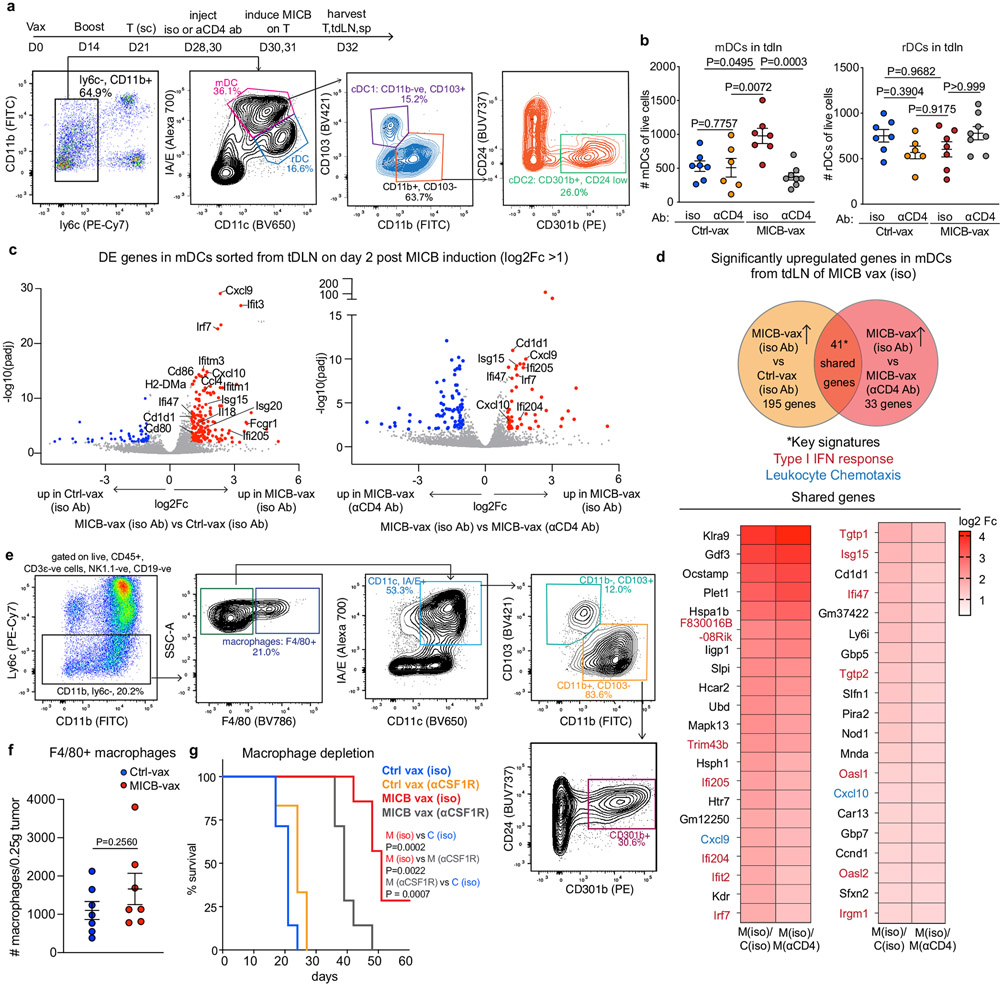
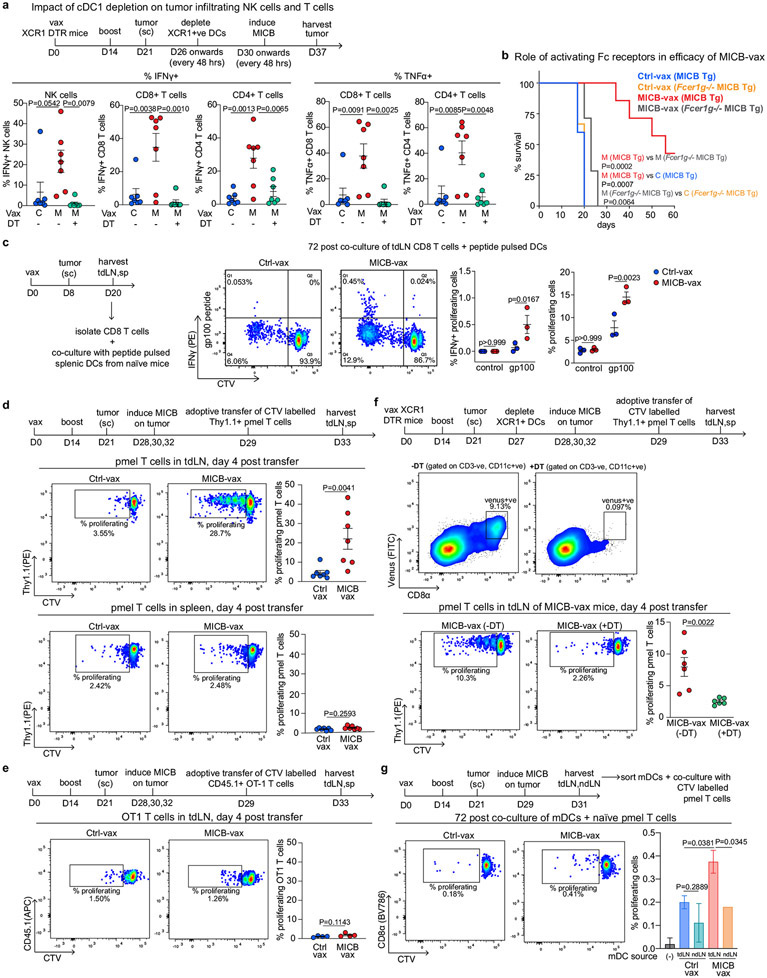
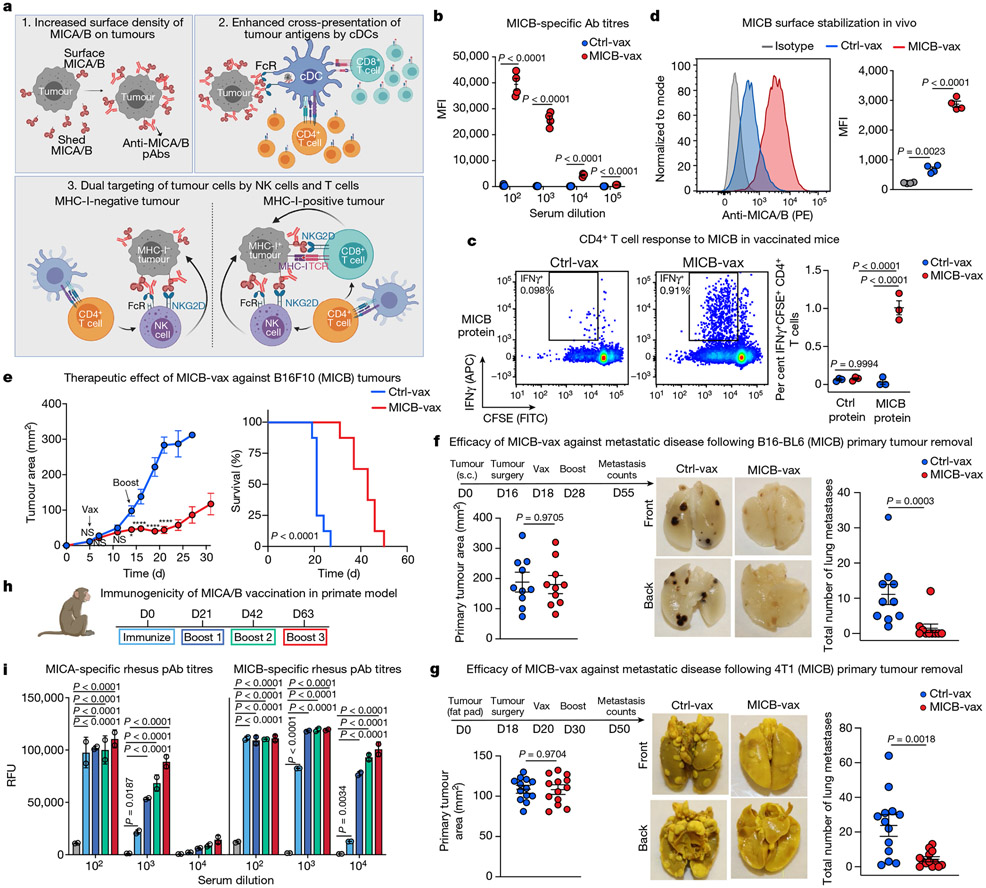
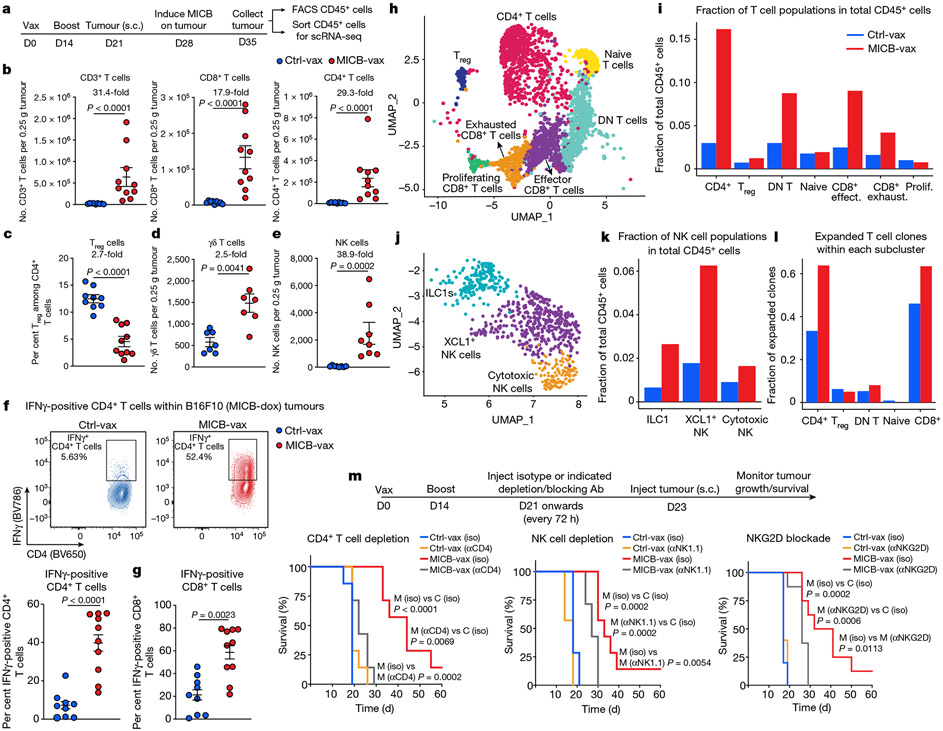
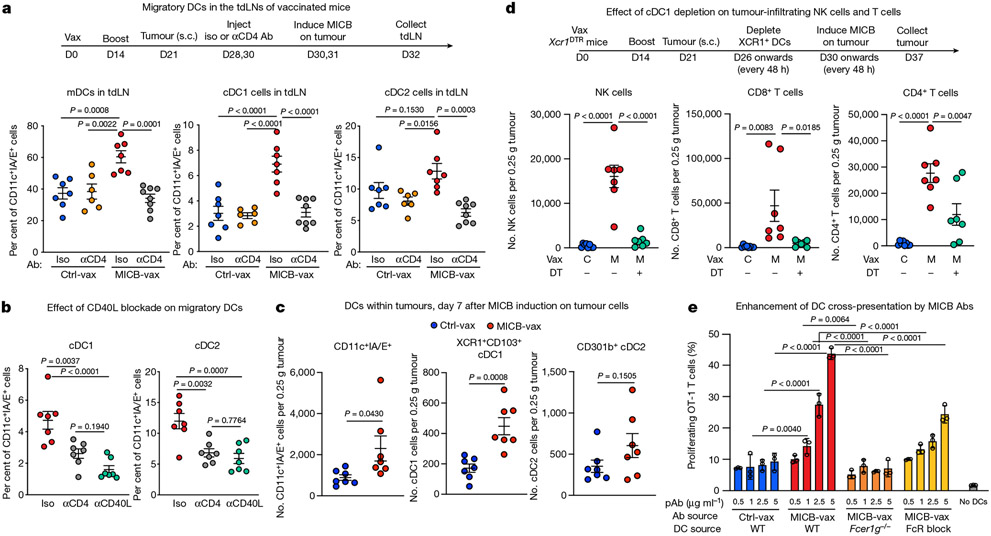
Most cancer vaccines target peptide antigens, necessitating personalization owing to the vast inter-individual diversity in major histocompatibility complex (MHC) molecules that present peptides to T cells. Furthermore, tumours frequently escape T cell-mediated immunity through mechanisms that interfere with peptide presentation1. Here we report a cancer vaccine that induces a coordinated attack by diverse T cell and natural killer (NK) cell populations. The vaccine targets the MICA and MICB (MICA/B) stress proteins expressed by many human cancers as a result of DNA damage2. MICA/B serve as ligands for the activating NKG2D receptor on T cells and NK cells, but tumours evade immune recognition by proteolytic MICA/B cleavage3,4. Vaccine-induced antibodies increase the density of MICA/B proteins on the surface of tumour cells by inhibiting proteolytic shedding, enhance presentation of tumour antigens by dendritic cells to T cells and augment the cytotoxic function of NK cells. Notably, this vaccine maintains efficacy against MHC class I-deficient tumours resistant to cytotoxic T cells through the coordinated action of NK cells and CD4+ T cells. The vaccine is also efficacious in a clinically important setting: immunization following surgical removal of primary, highly metastatic tumours inhibits the later outgrowth of metastases. This vaccine design enables protective immunity even against tumours with common escape mutations.


Figures

Extended Data Fig. 1 ∣
Extended Data Fig. 1 ∣. Characterization of vaccine targeting MICA/B vaccine α3 domain.
a, HPLC gel filtration analysis of affinity-purified ferritin (immunogen for Ctrl-vax) and MICB-ferritin (immunogen for MICB-vax) proteins. The proteins formed nanoparticles of ~957 kDa (MICB-ferritin) and ~468 kDa (ferritin); molecular weight standards are indicated. b, SDS-PAGE analysis of purified ferritin and MICB-ferritin proteins under reducing conditions. c, Electron microscopy image showing MICB-ferritin protein assembled into nanoparticles (98,000x magnification). d, Identification of MICB transgenic (Tg) mice by PCR amplification using genomic DNA extracted from tail biopsies (lanes 2,6, MICB Tg; lane 7, positive control amplification from plasmid with the transgene cassette; lane 8, negative control reaction). e, Quantitative RT-PCR analysis of luciferase and MICB mRNA in the prostate of WT (grey) and MICB-tg (orange) mice (n = 2 WT, n = 3 MICB-Tg mice) normalized to mouse Hprt mRNA. f, Quantification of day 14 MICB-specific serum Ab titers (fluorescence-based immunoassay, DELFIA) in WT and MICB-tg mice immunized with Ctrl-vax (n = 4 mice/group) (grey) (120μg ferritin protein, 100μg CpG, 1μg GM-CSF) or MICB-vax (n = 5 mice/group) (200μg MICB-ferritin, 100μg CpG, 1μg GM-CSF) without MSR (left) or with MSR (right) scaffold. g, Quantification of MICB-specific serum Ab titers (fluorescence-based immunoassay, DELFIA) in mice immunized with Ctrl-vax (grey) or MICB-vax using differing protein doses, 50μg (yellow), 100μg (blue) or 200μg (red) (n = 2 mice/group). h, Representative flow cytometry plots showing binding of polyclonal serum Abs from mice immunized with Ctrl-vax (blue) or MICB-vax (red) to cell surface MICB on B16F10 (MICB) tumor cells; serum dilutions are indicated for each condition. i, Titers of MICB Ab isotypes assessed by ELISA (n = 5 mice/group) in MICB transgenic mice immunized with Ctrl-vax (blue) or MICB-vax (red). j, Analysis of MICB-specific CD8 T-cell responses in the spleen of mice immunized with Ctrl-vax (blue) or MICB-vax (red). Intracellular cytokine staining (IFNγ) and CFSE dilution is shown in representative flow cytometry plots (left); data are quantified for T-cells from both vaccine groups (3 mice/group, right). k, Analysis of human NKG2D dimer (left) and mouse NKG2D dimer (right) binding to cell surface MICB on B16F10 (MICB-ZsGreen) tumor cells pre-incubated with sera (5μl) from Ctrl-vax or MICB-vax mice. l, Representative flow cytometry plots showing binding of anti-human MICA/B antibody (6D4, specific for MICA/B α1-α2 domains) to cell surface MICB on B16F10 (MICB) tumor cells pre-incubated with sera from mice immunized with Ctrl-vax (blue) or MICB-vax (red). Representative data from >3 independent experiments (a, b). Data from a single experiment with technical replicates (c). Representative data from three experiments (d, e, g, h, i). Representative data from two experiments (j, k, l). Two-tailed unpaired Student’s t-test (e); Two-way ANOVA with Tukey’s multiple comparison test (f, g); Two-way ANOVA with Sidak’s multiple comparison test (i, j). Data depict mean +/− SD (e,g) or mean +/− SEM (f, i,j).
Extended Data Fig. 2 ∣
Extended Data Fig. 2 ∣. Characterization of vaccine-induced immune responses.
a, b, Inhibition of MICA/B shedding and surface stabilization by vaccine-induced Abs. Flow cytometric analysis of cell surface MICA/B levels (a) and shed MICA/B in supernatants (b) for human A375 melanoma, A549 lung carcinoma, HCT116 colon carcinoma and K562 myelogenous leukemia cell lines 24 h following incubation with 10 μl of sera from Ctrl-vax (blue) or MICB-vax (red) immunized mice; isotype control Ab staining shown in grey (a). c, d, Inhibition of MICB shedding and surface stabilization by vaccine-induced Abs on mouse tumor cell lines. Flow cytometric analysis of cell surface MICB levels (c) and shed MICB in supernatants (d) for mouse B16F10 (MICB) melanoma, EL4 (MICB) lymphoma and 4T1 (MICB) triple negative breast cancer cell lines 24 h following incubation with 10 μl of sera from Ctrl-vax (blue) or MICB-vax (red) immunized mice. Isotype control Ab staining shown in grey (c). e–g. Vaccine efficacy at different MICB expression levels induced in tumor cells using a doxycycline (dox) inducible promoter. Representative flow cytometry histograms showing MICB surface expression levels on B16F10 (MICB-dox) tumors in vivo in mice treated with PBS (blue histogram) or different concentrations of doxycycline (dox): low dox (2.5mg/kg, orange), medium dox (5mg/kg, red) or high dox (10mg/kg, green) or control B16F10 (Ctrl-dox) tumors treated with high dox (10mg/kg, grey) (e). Analysis of B16F10 (MICB-dox) tumor growth kinetics at different MICB expression levels by tumor cells. Mice received Ctrl-vax (grey, blue, black) or MICB-vax (orange, red, green) on day 0 and a boost on day 14. B16F10 (MICB-dox) tumor cells were implanted on day 21, and MICB expression was induced on tumor cells on day 25 when tumors were palpable by treating mice with different concentrations of doxycycline as indicated (f) (n=7 mice/group). Quantification of serum levels of shed MICB in mice immunized with Ctrl-vax (grey, blue, black) or MICB-vax (orange, red, green) 96 h post dox-mediated induction of MICB on B16F10 (MICB-dox) tumor cells. Serum levels of shed MICB were analyzed in 5 randomly selected mice in each group (g). h–i, Representative flow cytometry histogram showing surface MICB levels on B16F10 (MICB) clone G12 (red) or indicated pooled clones (gradient of turquoise). Grey histogram represents isotype antibody staining of B16F10 (MICB) clone G12 (h). Assessment of therapeutic efficacy of MICB-vax (red, green) or Ctrl-vax (blue, grey) in mice with tumors established with B16F10 (MICB) clone G12 or pooled clones (B3, A3, C6, B1, G1) (n=8 mice/group) (i). j–n, Assessment of vaccine efficacy targeting MICA or MICB α3 domains. The MSR scaffold was formulated with antigens, GM-CSF and CpG. Mice received one or two doses of Ctrl-vax, MICB-vax (j–m) or MICA-vax (n) and were then challenged with B16F10 tumor cells expressing MICB (allele 005) (j, k) or MICA (allele 009) (m, n) or EL4 tumor cells expressing MICB (allele 005) (l). Vaccination and tumor challenge schedule is illustrated above each experiment; n = 7 mice/group (j–l), n = 6 mice in Ctrl-vax, n = 8 mice in MICB-vax (m) and n = 6 mice/group (n). For experiments shown in (j), tumor-free mice were rechallenged on day 120 using the same dose of B16F10 (MICB) tumor cells as in the initial inoculation. Representative data from two experiments (a–d, j–n). Data from single experiment (e–g, h–i). Two-tailed unpaired Student’s t-test (b, d); one-way ANOVA with Tukey’s multiple comparison test (g); two-way ANOVA with Bonferroni’s post hoc test (f, i (left), j (left), k. l, m, n); log-rank (Mantel-Cox) test (i (right), j (right). Data depict mean +/− SD (b, d) or mean +/− SEM (f, g, i–n).
Extended Data Fig. 3 ∣
Extended Data Fig. 3 ∣. Protection from metastatic disease by vaccination following surgical removal of primary tumors.
a, c, Images of lung metastases from five representative mice per group immunized with Ctrl-vax (top two rows) or MICB-vax (bottom two rows). Mice were immunized following surgical removal of primary B16-BL6 (MICB) (n = 10 mice/group) (a) and 4T1 (MICB) (c) tumors (n = 13 mice/group), as described in Fig. 1f, g. b, d, Representative bright field images of H&E stained histological sections of lung metastases from mice with B16-BL6 (MICB) (b) or 4T1 (MICB) (d) tumors. e–f, Quantification of the number of metastases per H&E stained section (left) and percentage of area of lung section occupied by metastases (right) for mice immunized with Ctrl-vax (blue) or MICB-vax (red) following surgical removal of primary B16-BL6 (MICB) tumors (e) or 4T1 (MICB) tumors (f). Representative data from two experiments (a-f). Representative images of 5 histological lung sections per mouse (b, d), Two-tailed Mann Whitney test (e, f). Data depict mean+/− SEM.
Extended Data Fig. 4 ∣
Extended Data Fig. 4 ∣. Immunogenicity of MICA/B α3 domain vaccine in non-human primates.
a, Characterization of the MICA/B α3 immunogen used in the primate study. The α3 domains of rhesus macaque MICA and MICB were expressed as a fusion protein with ferritin to generate nanoparticles that displayed both α3 domains on the surface. Nanoparticles formed by this fusion protein were conjugated using click chemistry to CpG ODN 2935 as the adjuvant and characterized by HPLC gel filtration chromatography. Shown are HPLC traces of the protein following conjugation to the CpG oligonucleotide (red: 280 nm trace for detection of protein; blue: 350 nm trace for detection of bis-aryl hydrazone bond). b, SDS-PAGE analysis of purified macaque MICA/B α3–ferritin protein under reducing (+) and non-reducing (−) conditions following CpG conjugation and final purification using a HPLC gel filtration column. c–e, Characterization of serum antibody responses to rhesus macaque MICA (left) and MICB (right) proteins (full-length extracellular domains without ferritin fusion partner) at different steps in the immunization process. Antibody responses were investigated in three animals (RBQ12, RVf10 and RQq15) at multiple timepoints (pre-immunization; three weeks following initial immunization and boosts 1-3, as illustrated in Fig. 1h) using a fluorescence-based ELISA (RFU, relative fluorescence units) at multiple serum dilutions (1:102 to 1:104). fm, Binding of purified polyclonal serum IgG to cell surface MICA (left) and MICB (right) using HEK293T transfectants that displayed rhesus macaque MICA (Mamu-A*01) or MICB (Mamu-B*01) proteins. Preimmune sera were used as a control (grey) for sera obtained following immunization (red). Representative histograms (left in f, g) and graphical summaries of flow cytometry data (right in f, g, hm) are shown for the four immunized macaques (9312, RBQ12, RVf10 and RQq15). Representative data from two experiments (a–b). Data from a single macaque immunization experiment with technical replicates for each macaque analyzed (c–m). Two-way ANOVA with Tukey’s multiple comparison test (c-e). Data depict mean+/− SD.
Extended Data Fig. 5 ∣
Extended Data Fig. 5 ∣. Impact of vaccine on functional programs of tumor-infiltrating CD4 and CD8 T-cells.
a, Effect of doxycycline on tumor growth in vaccinated mice. Mice received Ctrl-vax (blue, grey) or MICB-vax (green, magenta, red) on day 0 and a boost on day 14. B16F10 cells transduced with Ctrl-dox or MICB-dox lentiviral vectors as indicated were implanted on day 21, and mice were treated with doxycycline (or PBS as control) starting on day 25 to induce MICB expression on tumor cells (n=5 mice/group). b–k, Analysis of tumor-infiltrating T-cell populations. Tumor-infiltrating T-cells were analyzed 7 days following induction of MICB expression by tumor cells (n = 7 mice/group). b–c, Analysis of CD62L and CD44 expression by tumor-infiltrating CD4 (b) and CD8 (c) T-cells. d–e, Representative flow plots (left) and quantification (right) of NKG2D receptor expression by CD4 (d) and CD8 (e) T-cells. f–g, Representative flow plots and quantification of CXCR6 receptor expression by CD4 (f) and CD8 (g) T-cells. h–i, Quantification of proliferating Ki67+ CD4 (h) and CD8 (i) T-cells. j–k, Quantification of TNFα positive CD4 (j) and CD8 (k) T-cells. Two-way ANOVA with Bonferroni’s post hoc test (a); two-way ANOVA with Tukey’s multiple comparison test (b–c); two-tailed Mann Whitney test (d–k). Representative data from two independent experiments (b–i); representative data from three independent experiments (j–k). Data depict mean+/− SEM.
Extended Data Fig. 6 ∣
Extended Data Fig. 6 ∣. Flow cytometric and scRNA-seq analysis of changes in tumor-infiltrating immune cells induced by the vaccine.
a–b, Representative histograms (a) and quantification (b) of PD-1, CTLA-4, Tim-3, Tigit and Lag3 expression by tumor-infiltrating CD8 T-cells from Ctrl-vax (blue) or MICB-vax (red) mice (n = 9 mice/group). c–d, Comparison of T-cell and NK cell populations in B16F10 (MICB) tumors following treatment with a MICA/B mAb or the MICB vaccine. In the vaccine arm, mice received Ctrl-vax (C-vax) (n = 9 mice) or MICB-vax (M-vax) (n = 10 mice) on days 0 and 14, while mice in the mAb treatment group (n = 8 mice/ group) received two buffer injections. Mice were implanted with B16F10 (MICB-dox) tumor cells on day 21. MICB expression was induced on tumor cells by doxycycline treatment starting on day 28, and mice in the mAb treatment group received either mouse IgG2a isotype control mAb (iso) or MICA/B mAb (mAb) treatment every 48 h starting on day 28. Tumor-infiltrating immune cells were analyzed in all groups on day 35. Total numbers of tumor-infiltrating CD4+ T-cells, CD8+ T-cells and NK cells were quantified by flow cytometry (c), and intracellular staining was performed for IFNγ (d) in all four treatment groups. e–g, scRNA-seq analysis of changes in tumor-infiltrating immune cells induced by the vaccine. CD45+ immune cells in B16F10 (MICB-dox) tumors were investigated by scRNA-seq under four experimental conditions: the MICB-vax (+dox) experimental group and the three control groups, Ctrl-vax (−dox), Ctrl-vax (+dox) and MICB-vax (−dox). Doxycycline was administered to mice for seven days prior to scRNA-seq analysis to induce MICB expression on tumor cells in two of these groups (+dox). For each of the four groups, CD45+ immune cells were pooled from five mice to reduce variation from individual tumors. e, UMAP projection of CD45+ immune cells combined from all experimental groups. Major immune cell populations are annotated based on differentially expressed genes. f, Comparison of immune subpopulations across all clusters for the experimental MICB-vax (+dox) group (red) versus the three combined control groups (blue). g, Distribution of CD45+ cells across individual clusters (color-coded as in e) for the experimental MICB-vax (+dox) group (MICB) and the three combined control groups (Ctrl). Representative data of two experimental repeats (a–b). Data from a single experiment (c–d). ScRNA-seq data from a single experiment with sorted CD45+ cells pooled from 5 mice/group (e–g). Two-tailed Mann Whitney test (b); one-way ANOVA with Tukey’s multiple comparison test (c–d). Data depict mean+/− SEM.
Extended Data Fig. 7 ∣
Extended Data Fig. 7 ∣. Gene expression programs of tumor-infiltrating T-cell and NK cell populations.
a–d, scRNA-seq analysis of T-cell clusters among CD45+ tumor-infiltrating cells in B16F10 (MICB-dox) tumors. UMAP representation of T-cell subclusters (a) and visualization of T-cell populations for the experimental MICB-vax (+dox) group (MICB) and the three control groups (b). c, Contribution of each T-cell subcluster to the total CD45+ immune population for each of the four treatment groups. d, Quantification of expanded TCR clonotypes for CD4, Treg, CD8 effector, CD8 exhausted and CD8 proliferating clusters shown for all four treatment groups. e, f, Ranking of differentially expressed genes in scRNA-seq data from the indicated T-cell subpopulations (e) and NK cells (f) comparing cells from the experimental MICB-vax (+dox) group to cells from the three combined control groups, Ctrl-vax (−dox), Ctrl-vax (+dox) and MICB-vax (−dox). g–j, Violin plots showing expression levels of activation-related genes (g) and Th1-related genes (h) in CD4 T-cells as well as activation-related genes (i) and chemokine receptor genes (j) in CD8 T-cells from the experimental MICB-vax (+dox) group compared to cells from the three combined control groups (Ctrl). ScRNA-seq data from a single experiment with sorted CD45+ cells pooled from 5 mice/group (a–j). Pairwise Wilcoxon rank sum test (g–j).
Extended Data Fig. 8 ∣
Extended Data Fig. 8 ∣. T cell and NK cell responses in MHC-I expressing and MHC-I deficient tumors.
a, Contribution of CD8 T cells to vaccine efficacy. Mice were first immunized with MICB-vax or Ctrl-vax (d0, d14), treated with either isotype control mAb, depleting mAb targeting CD8 T-cells starting on day 21, followed by implantation of B16F10 (MICB) tumor cells (n = 7 mice/group). b, Impact of IFNγ versus TNFα neutralization on the efficacy of the MICB α3 domain vaccine. MICB-transgenic mice received IFNγ or TNFα neutralizing mAbs or an isotype control mAb every 48 h, starting two days prior to subcutaneous injection of B16F10 (MICB) tumor cells on day 21 following immunization (n = 7 mice/group). Tumor growth (left) and survival analysis (right) are shown. c, Comparison of vaccine efficacy against B16F10 (MICB) wild-type tumors and tumors with resistance mutation in H2-Aa gene. Mice received MICB-vax (n=8 mice/ group) or Ctrl-vax (n = 7 mice/ group) and were then challenged with tumors of the indicated genotypes. d, Quantification of MICB-specific serum Ab titers in mice immunized with Ctrl-vax (blue) or MICB-vax followed by treatment with CD4 T-cell depletion (green) or control (red) mAbs for 3 weeks, starting on day 28 following immunization (n=5 mice/group). e, Impact of CD4 T-cell depletion on vaccine-induced NK cell infiltration into tumors. Flow cytometric quantification of the percentage of Ki67+ NK cells (top) and IFNγ+ NK cells (bottom) in WT (left) and B2m-KO (right) tumors for the following treatment groups: Ctrl-vax + isotype mAb (blue), Ctrl-vax + anti-CD4 (orange), MICB-vax + isotype mAb (red) and MICB-vax+anti-CD4 (green); (n = 7 mice/group). Representative data from two independent experiments (a-c, e). Data from a single experiment with technical triplicates (d). Log-rank (Mantel-Cox) test (a); two-way ANOVA with Bonferroni’s post hoc test (b left, c left) and Log-rank (Mantel-Cox) test (b right, c right); two-way ANOVA with Tukey’s multiple comparison test (d); one-way ANOVA with Tukey’s multiple comparison test (e).
Extended Data Fig. 9 ∣
Extended Data Fig. 9 ∣. Characterization of dendritic cells in the tumor draining lymph nodes of vaccinated mice.
a, Experimental outline and gating strategy for identification of migratory DC (mDC) subsets within the tumor draining lymph node (tdLN) of immunized mice by flow cytometry. b, Impact of CD4 T-cell depletion on mDC and resident (rDC) populations in tdLN of vaccinated mice. DC populations were analyzed in tdLN on day 32, two days following induction of MICB expression on tumor cells with dox (n = 7 mice per group, except in control-αCD4 ab (n = 6 mice). c, Differentially expressed genes of mDCs (bulk RNA-seq) sorted from tdLN of MICB-vax and Ctrl-vax mice treated with CD4 depleting (αCD4) or isotype control (iso) mAb. d, Upregulated genes in mDCs from the MICB-vax (isotype control mAb, iso) group compared to either MICB-vax plus CD4 T-cell depletion (αCD4) or the Ctrl-vax (isotype mAb) groups. Venn diagram and heatmap of genes with higher expression in MICB-vax (iso) compared to both other groups. e–g, Characterization of myeloid cells within the tumors of vaccinated mice. Mice were immunized (d0 and 14), B16F10 (MICB-dox) tumor cells were implanted on day 21 and MICB expression was induced on tumor cells on day 28 by doxycycline (dox) treatment. Tumor-infiltrating myeloid cells were analyzed 7 days later. e, Gating strategy used for identification of tumor-infiltrating CD103+ cDC1, CD301b+ cDC2 and F4/80+ macrophages in vaccinated mice by flow cytometry. f, Quantification of macrophage population within tumors of Ctrl-Vax (blue) and MICB-vax (red) mice on day 7 following MICB induction on tumors with dox (n = 7 mice/group). g, Impact of αCSF1R treatment on immunity to B16F10 (MICB) tumors. Mice were immunized with Ctrl-vax or MICB-vax; treatment with αCSF1R or isotype control Ab was started two days prior to subcutaneous injection of B16F10 (MICB) tumor cells; mAb treatment was continued every third day; n=7 mice/group. Data representative of two independent experiments (a–b, e–g). Data from one experiment with three biological replicates per sample. DCs from 3 mice were pooled for each biological replicate (n = 9 mice/group). Significance was determined using thresholds of −log10 >2 (adjusted P value), and log2 >1 (fold change) (c–d). One-way ANOVA with Tukey’s multiple comparison test (b); Two-tailed Mann Whitney test (f); log-rank (Mantel-Cox) test (g). Data represent mean +/− SEM.
Extended Data Fig. 10 ∣
Extended Data Fig. 10 ∣. Cross-presentation of endogenous melanoma antigen by dendritic cells from MICB-vax mice.
a, Impact of cDC1 depletion on MICB vaccine-induced T-cell and NK accumulation within tumors in Xcr1DTR mice. Mice were treated +/− diphtheria toxin (DT) starting on day 26 following immunization with Ctrl-vax (C) or MICB-vax (M) (days 0 and 14) and B16F10 (MICB-dox) tumor implantation (day 21). Immune cells were analyzed in tumors 7 days following MICB induction on tumors with dox (day 37) (n = 7 mice/group). b, Contribution of activating Fc receptors to efficacy of MICB-vax. Survival curves of FceR1g−/− MICB-Tg versus MICB-Tg mice immunized with Ctrl-vax (blue) and MICB-vax (red) (n = 7 mice/group). c, Analysis of endogenous gp100 specific CD8 T-cell responses. CD8 T-cells were isolated from tdLN of mice immunized with MICB-vax or Ctrl-vax, labeled with the CTV cell proliferation dye and then co-cultured for 72 h with DCs pulsed with control (Ova) or gp100 peptide (10μg/ml). Intracellular cytokine staining (IFNγ) and CTV dilution are shown in representative flow cytometry plots (left); data are quantified for T-cells from both vaccine groups (3 mice/group, right). d, Proliferation of transferred CD8 T-cells specific for the gp100 melanoma antigen (from Pmel-1 transgenic mice) in tumor-draining lymph nodes of mice immunized with MICB-vax compared to Ctrl-vax. Mice were vaccinated twice (days 0 and 14) and B16F10 (MICB-dox) tumor cells were implanted subcutaneously on day 21. Doxycycline treatment was initiated on day 28 to induce MICB expression on tumor cells, one day prior to transfer of Thy1.1+ Pmel-1 CD8 T-cells (2x10⁶ cells/mouse). Proliferation of CTV-labeled Pmel-1 T-cells was analyzed in tumor-draining LN (top) and spleen (bottom, control organ) four days following T-cell transfer. Cells were gated based on CD3, CD8 and Thy1.1 markers; shown is Thy1.1 marker of transferred Pmel-1 T-cells (Y-axis) and CTV dye dilution in proliferating T-cells (X-axis). Proliferating T-cell populations are indicated in representative flow plots (left) and quantification is shown (right) across the entire cohort of Ctrl-vax (blue) versus MICB-vax (red) mice (n = 7 mice/group). e, Control experiment for (d) with CD8 T-cells of irrelevant specificity (OT-1 T-cells, n = 4 mice/group). f, Role of XCR1+ DCs in the activation of transferred gp100-specific pmel-1 CD8 T-cells. Xcr1DTR mice were immunized with MICB-vax (days 0 and 14), and B16F10 (MICB-dox) melanoma cells were implanted on day 21. XCR1+ DCs were depleted by injection of diphtheria toxin (+DT, green) or solvent as a control (−DT, red) one day prior to induction of MICB expression by tumor cells with doxycycline. Thy1.1+ Pmel-1 CD8 T-cells were transferred and proliferation of these T-cells was analyzed in tdLN four days later by dilution of the CTV dye. Top flow cytometry plots show depletion of XCR1+ cells (Venus fluorescent reporter protein) in diphtheria toxin (+DT) treated mice (right) compared to control mice (−DT, left), six days following initiation of DT treatment. Bottom flow cytometry plots show proliferation of transferred pmel-1 CD8 T-cells based on dilution of the CTV dye (X-axis); data are quantified on the right (n=6 mice/group). g, Presentation of gp100 peptide by migratory DCs from MICB-vax mice. Naïve Pmel-1 CD8 T-cells were co-cultured for 72 h with migratory DCs (mDC, CD11c+, IA/E high) isolated from tdLN or non-tumor draining LN of Ctrl-vax or MICB-vax mice (pooled from 10 mice/group) implanted with B16F10 (MICB) tumor cells. CD8 T-cell proliferation was assessed based on CTV dilution. Data are representative of two independent experiments (a-d, f-g). Data from a single experiment (e). One-way ANOVA with Tukey’s multiple comparison test (a); log rank (Mantel-Cox) test (b); two-tailed Mann Whitney test (c-f); one-way ANOVA with Dunnett’s multiple comparison test (g). Data depict mean +/− SEM (a, c–f) or mean +/− SD (g).
Fig. 1 ∣
Fig. 1 ∣. Efficacy of the MICA/B α3 domain cancer vaccine.
a, Design of the MICA/B vaccine. pAbs, polyclonal serum IgG. b, MICB-specific serum antibody (Ab) titres quantified by flow cytometry (n = 4 mice per group) in MICB-transgenic mice immunized with Ctrl-vax (blue) or MICB-vax (red). MFI, median fluorescence intensity. c, MICB-specific CD4+ T cell responses following immunization with MICB-vax or Ctrl-vax; CFSE dilution of splenocytes stimulated with MICB or control protein (ovalbumin (OVA)); shown are representative flow cytometry plots (left) and quantification for three mice per group (right). d, Cell-surface levels of MICB on B16F10 (MICB) tumours from mice immunized with MICB-vax or Ctrl-vax (n = 4 mice per group); staining of tumour cells with isotype-control monoclonal antibody (grey) or anti-MICA/B monoclonal antibody (specific for the α1–α2 domains, monoclonal antibody not blocked by vaccine-induced antibodies). e, Therapeutic efficacy of MICB-vax (red) or Ctrl-vax (blue) in mice with established B16F10 (MICB) tumours immunized at the indicated time points (n = 7 mice per group). Vax, vaccination. *P = 0.0137, ****P <0.0001; NS (not significant), P > 0.999. f, g, Vaccine efficacy in two models of spontaneous metastasis. Mice were immunized with Ctrl-vax (blue) or MICB-vax (red) following surgical removal of primary tumours using the B16-B6 melanoma (f; 10 mice per group) or 4T1 breast cancer (g; 13 mice per group) models. Shown are the size of primary tumours at the time of surgery (left), representative images of lung metastases (middle) and quantification of the total number of lung surface metastases (right). D, day; s.c., subcutaneous. h, i, Immunogenicity of the rhesus MICA/B α3 domain vaccine in the rhesus macaque model. h, Timeline of vaccination; blood was drawn 24 h before indicated immunization or boost. i, Serum titres of antibody to rhesus MICA/B for animal ID 9312. Representative data are shown from at least three (b) or two (cg) independent experiments. Data from a single experiment with technical replicates for each time point are shown in i. Statistical significance was assessed by two-tailed unpaired Student’s t test (b), two-way ANOVA with Sidak’s multiple-comparison test (c), one-way ANOVA with Tukey’s multiple-comparison test (d), two-way ANOVA with Bonferroni’s post hoc test (left) and the log-rank (Mantel–Cox) test (right) (e), two-tailed Mann–Whitney test (f, g) and two-way ANOVA with Tukey’s multiple-comparison test (i). Data are depicted as the mean ± s.e.m. (bg) or mean±s.d. (i).
Fig. 2 ∣
Fig. 2 ∣. Vaccine induces T cell and NK cell recruitment into tumours.
a, Strategy for characterization of tumour-infiltrating immune cells by flow cytometry (FACS) and scRNA-seq. Mice received two immunizations (days 0 and 14), B16F10 (MICB-dox) tumour cells were implanted (day 21), MICB expression was induced on tumour cells by doxycycline treatment (day 28) and tumour-infiltrating immune cells were analysed 7 d later. b–d, Tumour-infiltrating T cell populations following immunization with Ctrl-vax (blue) or MICB-vax (red) (Ctrl-vax, n = 9 mice per group; MICB-vax, n = 10 mice per group; n = 7 mice per group for the γδ T cell panel). Treg cells, regulatory T cells. e, Tumour-infiltrating NK cells (n = 8 mice per group). f, g, Quantification of IFNγ-positive CD4+ and CD8+ T cells (Ctrl-vax, n = 9 mice per group; MICB-vax, n = 10 mice per group). h, i, UMAP representation of all T cell clusters from scRNA-seq data (h) and the fraction of each T cell subpopulation among total CD45+ cells from the experimental group (MICB-vax + doxycycline; red) and three combined control groups (Ctrl-vax±doxycycline and MICB-vax without doxycycline; blue) (i). DN, double negative. j, k, UMAP representation of NK and ILC1 cells from all experimental groups (j) and the fraction of these subpopulations among total CD45+ cells from experimental (red) and combined control (blue) groups (k). l, Fraction of T cells representing expanded clones based on TCR sequence analysis for the experimental group (red) and combined control groups (blue). m, Contribution of CD4+ T cells, NK cells and NKG2D receptor to vaccine efficacy. Mice were first immunized with MICB-vax (M) or Ctrl-vax (C) (days 0 and 14) and treated with isotype-control monoclonal antibody (iso), depleting monoclonal antibody (targeting CD4+ T cells or NK cells (αCD4 and αNK1.1, respectively)) or NKG2D receptor-blocking monoclonal antibody (αNKG2D) starting on day 21, followed by implantation of B16F10 (MICB) tumour cells (n = 7 mice per group). Representative data from three independent experiments are shown in bg. scRNA-seq data from a single experiment with sorted CD45+ cells pooled from five mice per group are shown in hl. Representative data from two independent experiments are shown in m. Statistical significance was assessed by two-tailed Mann–Whitney test (bg) or log-rank (Mantel–Cox) test (m). Data are depicted as the mean±s.e.m.
Fig. 3 ∣
Fig. 3 ∣. Vaccine retains efficacy against MHC-I-deficient tumours.
a, b, Comparison of vaccine efficacy against B16F10 (MICB) WT tumours and tumours with resistance mutations in the B2m (a) or Ifngr1 (b) gene. Mice received MICB-vax or Ctrl-vax and were then challenged with tumours of the indicated genotype (n = 7 mice per group). KO, knockout. c, Effect of CD4+ T cell and NK cell depletion on immunity to B2m-knockout tumours. Mice were immunized with MICB-vax or Ctrl-vax; treatment with depleting or isotype-control monoclonal antibody was started 2 d before injection of B2m-knockout B16F10 (MICB) tumour cells (n = 7 mice per group). d, Contribution of vaccine-induced anti-MICB antibodies to NK cell-mediated cytotoxicity against B2m-knockout B16F10 (MICB) tumour cells. CFSE-labelled B2m-knockout B16F10 (MICB) tumour cells were pre-incubated with 10 μg per well of purified serum IgG from mice immunized with MICB-vax or Ctrl-vax before the addition of NK cells at different effector to target (E:T) ratios as indicated. The percentage of dead target cells was assessed by flow cytometry. e, Effect of CD4+ T cell depletion on vaccine-induced NK cell infiltration into tumours. Flow cytometry quantification of total NK cell numbers is shown in WT (left) and B2m-knockout (right) tumours for the following treatment groups: Ctrl-vax+isotype-control monoclonal antibody (blue), Ctrl-vax + anti-CD4 (orange), MICB-vax+isotype-control monoclonal antibody (red) and MICB-vax + anti-CD4 (green) (n = 7 mice per group). Representative data from two independent experiments are shown in ae. Statistical significance was assessed by two-way ANOVA with Bonferroni’s post hoc test (left) and log-rank (Mantel–Cox) test (right) (ac), two-way ANOVA with Sidak’s multiple-comparison test (d) and one-way ANOVA with Tukey’s multiple-comparison test (e). Data are depicted as the mean±s.e.m.
Fig. 4 ∣
Fig. 4 ∣. Role of CD4+ T cells and cDC1 cells in NK cell recruitment to tumours.
a, Effect of CD4+ T cells on migratory DC populations in the tdLNs of mice immunized with MICB-vax versus Ctrl-vax. Total migratory DCs as well as cDC1 and cDC2 cells were quantified 2 d after induction of MICB expression in tumour cells by doxycycline treatment (n = 7 mice per group, except n = 6 for Ctrl-vax without anti-CD4). b, Migratory DC subsets within the tdLN of MICB-vax-immunized mice treated following immunization (days 28 + 30) with isotype-control, CD4-depleting or CD40L-blocking monoclonal antibody (n = 7 mice per group). c, Quantification of DC populations within the tumours of mice immunized with Ctrl-vax (blue) or MICB-vax (red) on day 7 following induction of MICB expression with doxycycline (n = 7 mice per group). d, Effect of cDC1 depletion on MICB vaccine-induced T cell and NK cell accumulation within tumours in Xcr1DTR mice. Mice were treated with DT or left untreated starting on day 26 following immunization with Ctrl-vax or MICB-vax (days 0 + 14) and B16F10 (MICB-dox) tumour implantation (day 21). Immune cells were analysed in tumours 7 d after induction of MICB expression on tumours with doxycycline (day 37) (n = 7 mice per group). e, Contribution of vaccine-induced anti-MICB antibodies to DC-mediated cross-presentation of tumour antigens to CD8+ T cells. Bone marrow-derived DCs (BMDCs) were pre-incubated with B2m-knockout B16F10 (MICB-OVA) tumour cells in the presence of affinity-purified serum IgG from mice immunized with Ctrl-vax or MICB-vax at the indicated concentrations. DCs were co-cultured with CFSE-labelled OT-1 CD8+ T cells with T cell proliferation as the readout. The role of activating Fc receptor (FcR) was assessed using BMDCs from Fcer1g−/− mice (orange) or pre-incubation of BMDCs with FcR-blocking antibody (yellow) before tumour cell addition. Representative data from two independent experiments are shown in ae. Statistical significance was assessed by one-way ANOVA with Tukey’s multiple-comparison test (a, b, d), two-tailed Mann–Whitney test (c) and two-way ANOVA with Tukey’s multiple-comparison test (e). Data are depicted as the mean ± s.e.m. (ad) or mean ± s.d. (e).

Comment in

References

    1. Sharma P, Hu-Lieskovan S, Wargo JA & Ribas A Primary, adaptive, and acquired resistance to cancer immunotherapy. Cell 168, 707–723 (2017). - PMC - PubMed
    1. Gasser S, Orsulic S, Brown EJ & Raulet DH The DNA damage pathway regulates innate immune system ligands of the NKG2D receptor. Nature 436, 1186–1190 (2005). - PMC - PubMed
    1. Lanier LL NKG2D receptor and its ligands in host defense. Cancer Immunol. Res 3, 575–582 (2015). - PMC - PubMed
    1. Kaiser BK et al. Disulphide-isomerase-enabled shedding of tumour-associated NKG2D ligands. Nature 447, 482–486 (2007). - PubMed
    1. Bahram S, Bresnahan M, Geraghty DE & Spies T A second lineage of mammalian major histocompatibility complex class I genes. Proc. Natl Acad. Sci. USA 91, 6259–6263 (1994). - PMC - PubMed

MeSH terms

Substances

Supplementary concepts