. 2022 Jun;606(7912):165-171.
doi: 10.1038/s41586-022-04752-8. Epub 2022 May 25.

Developmental dynamics of two bipotent thymic epithelial progenitor types

Affiliations

Developmental dynamics of two bipotent thymic epithelial progenitor types

Anja Nusser et al. Nature. 2022 Jun.

Erratum in

Abstract

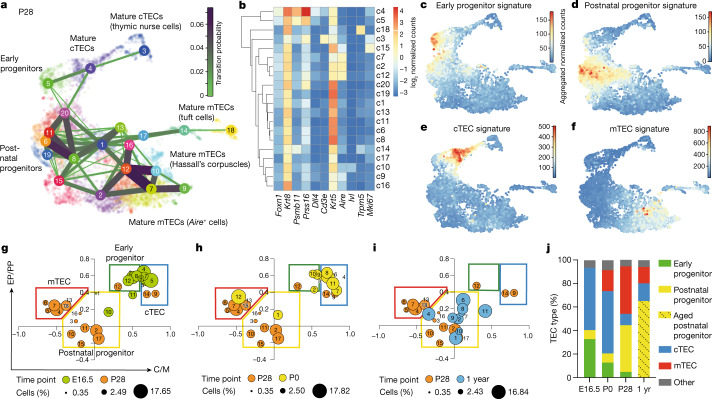
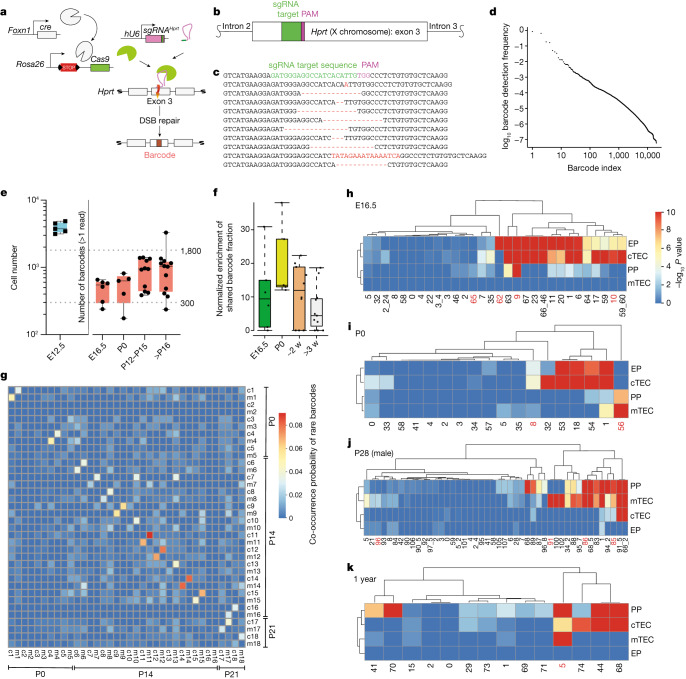
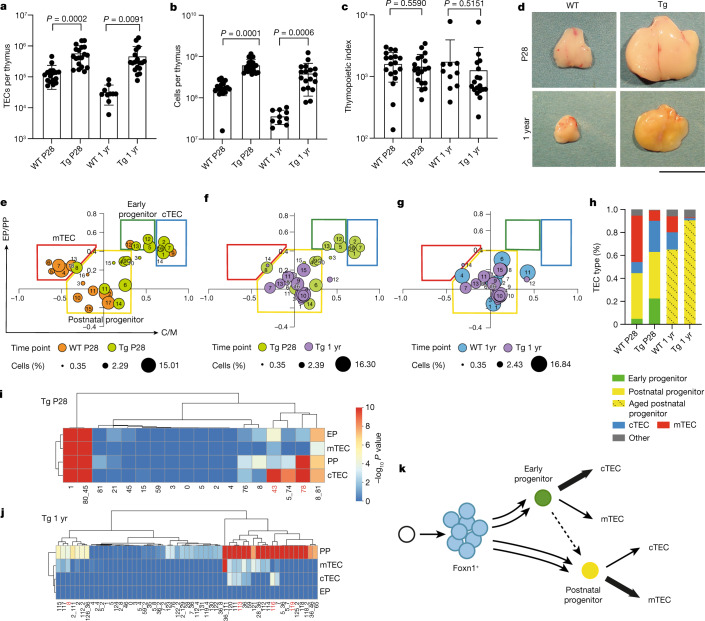
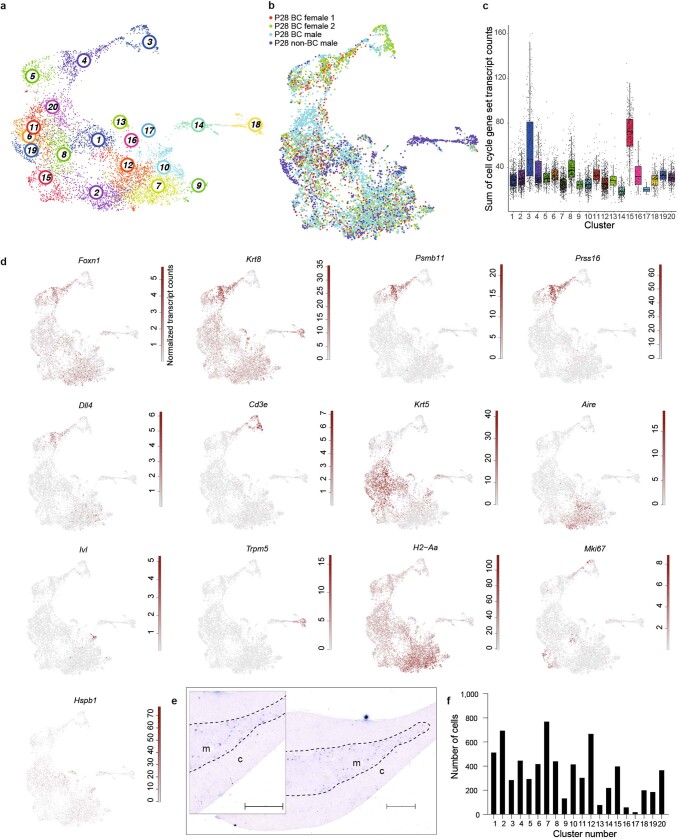
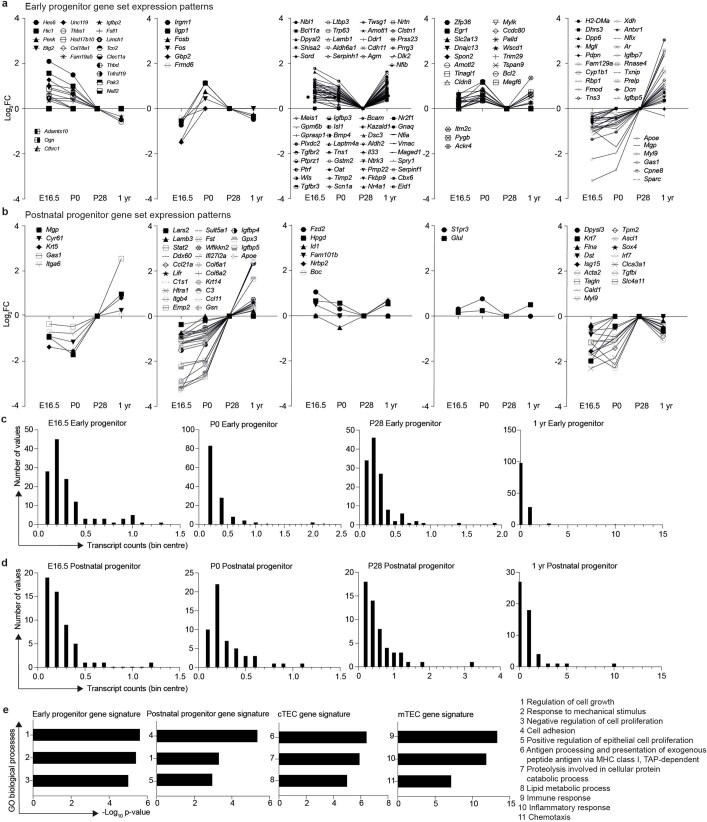
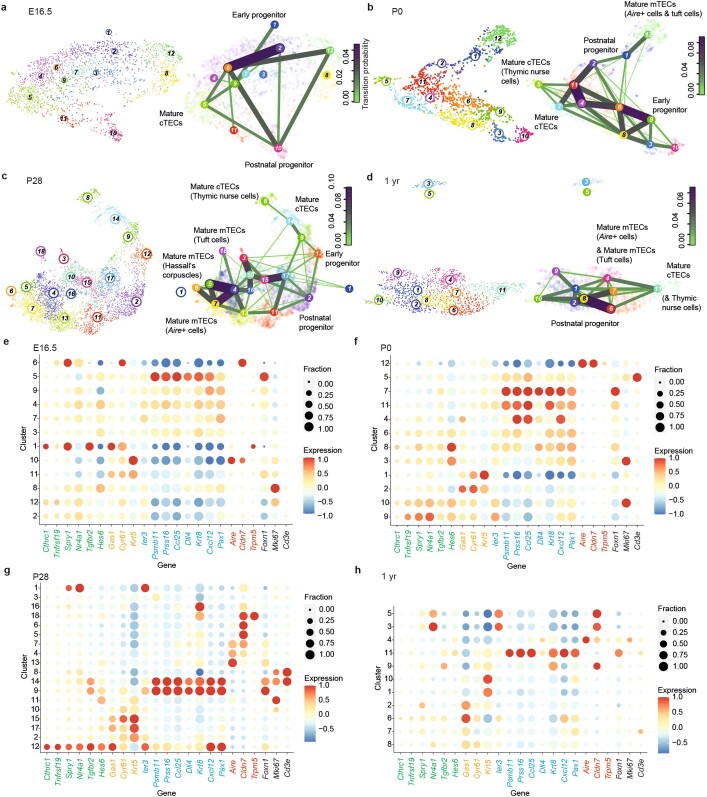
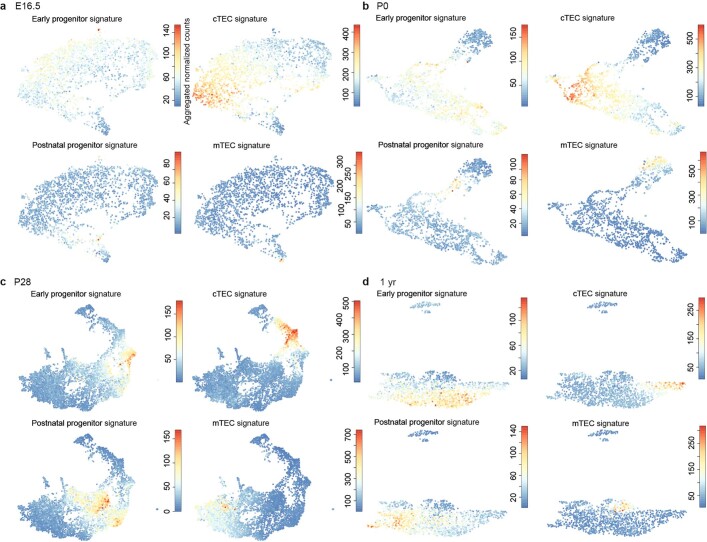
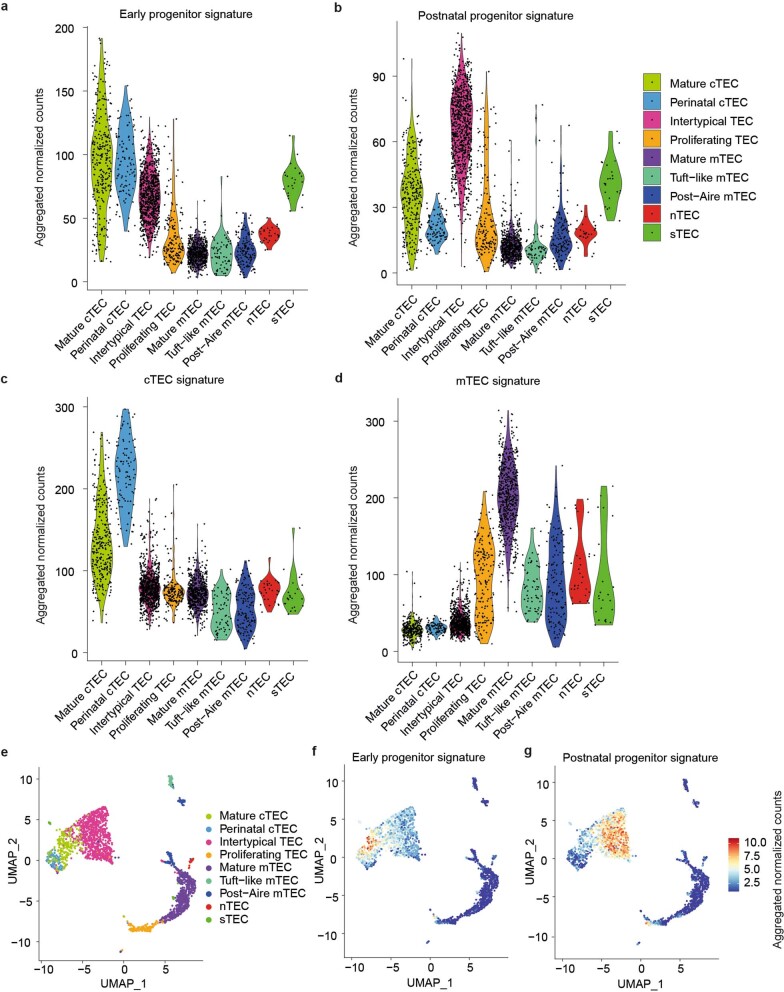
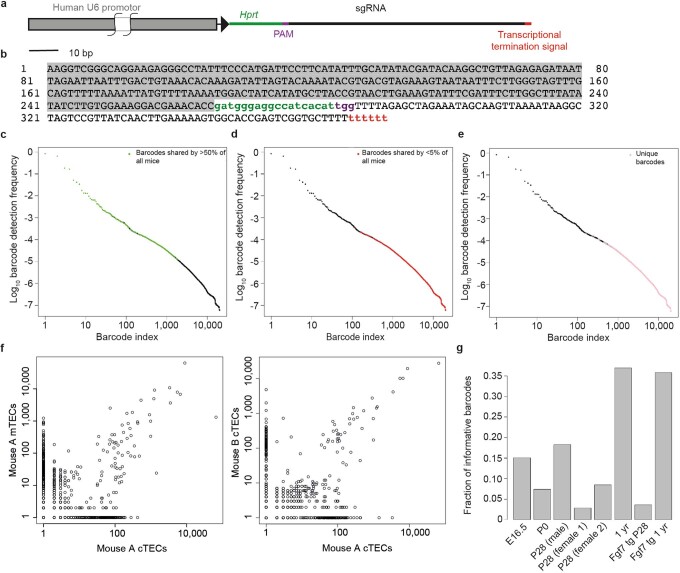
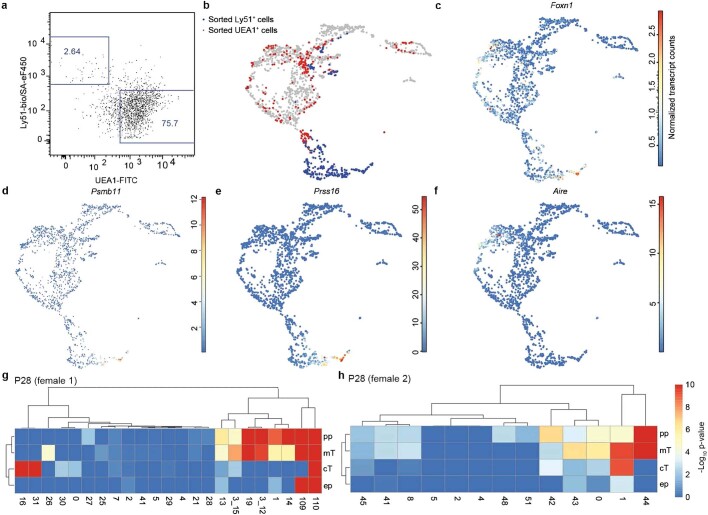
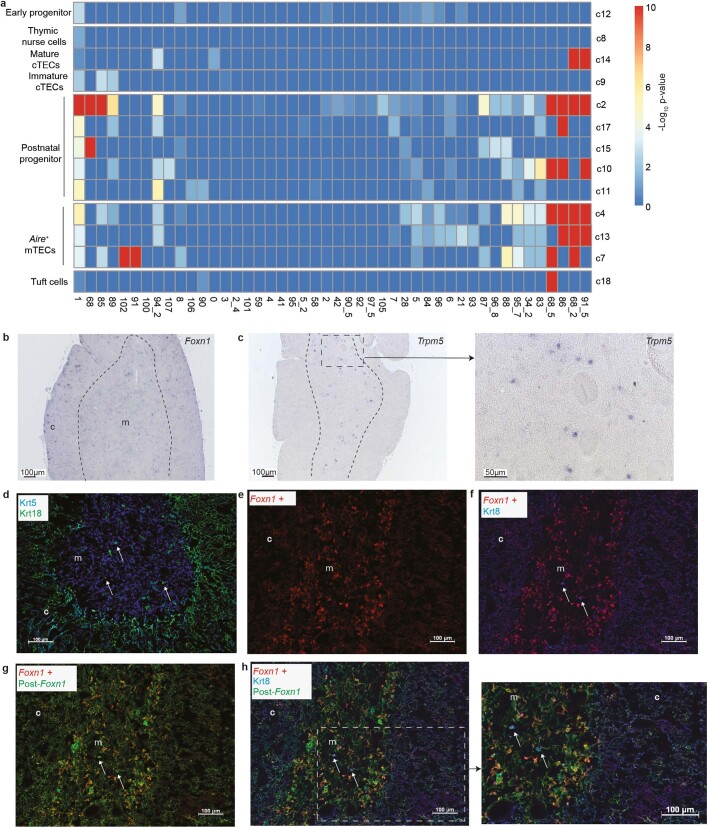
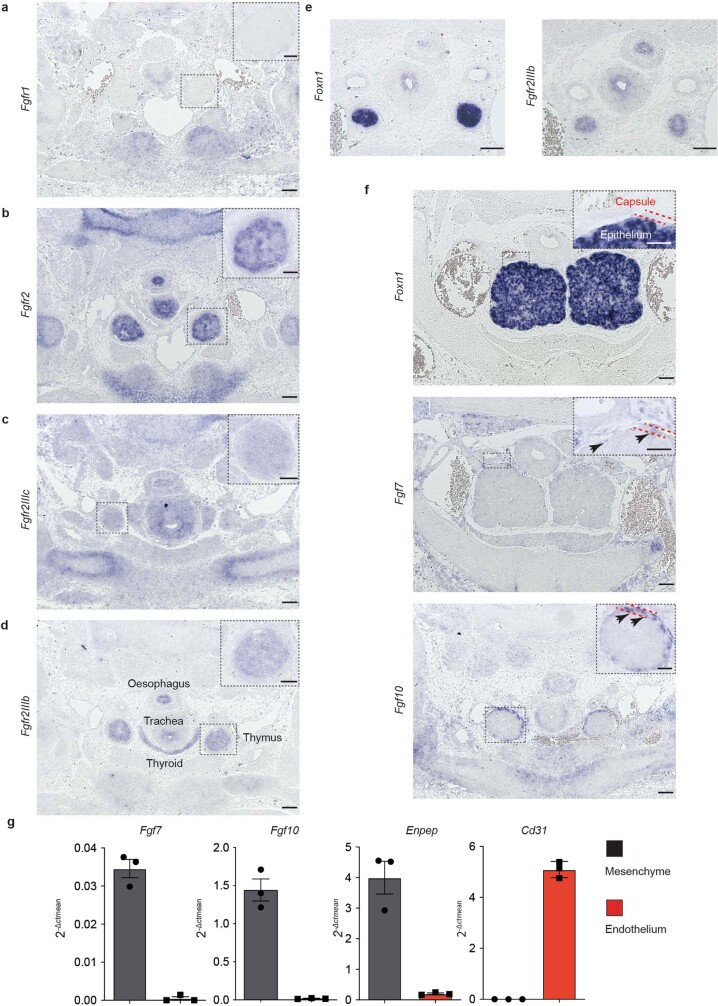
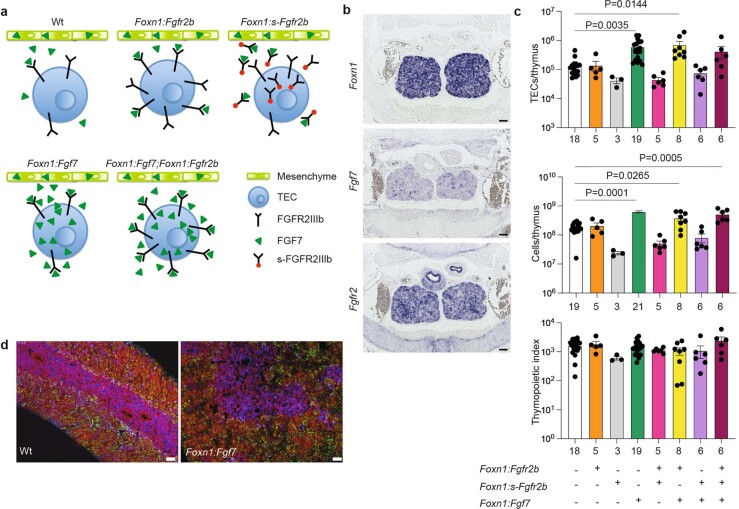
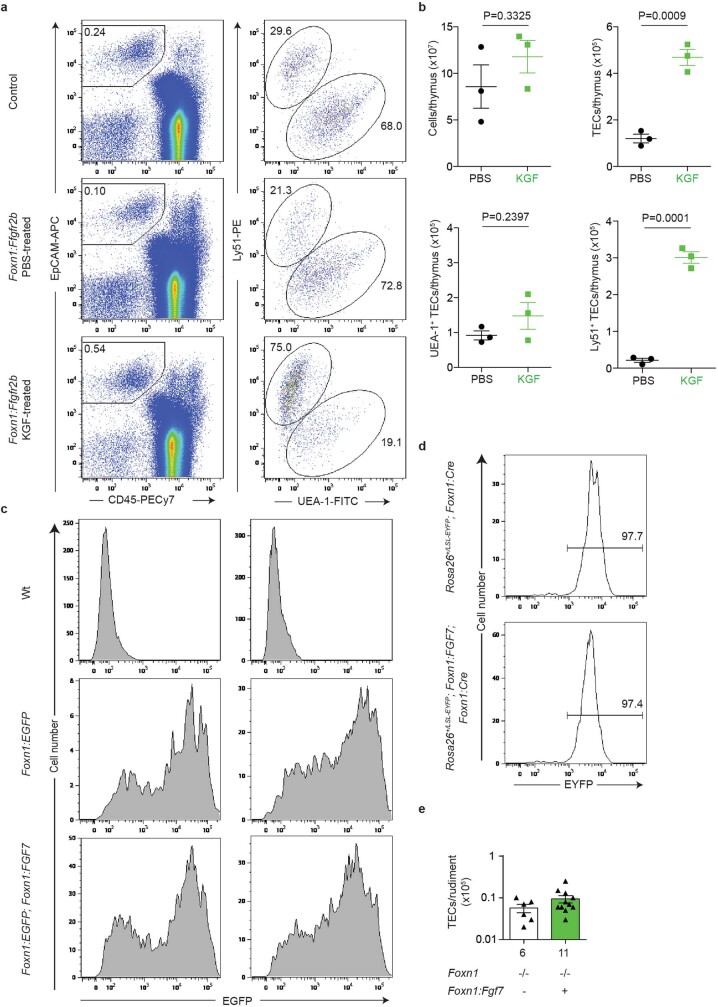
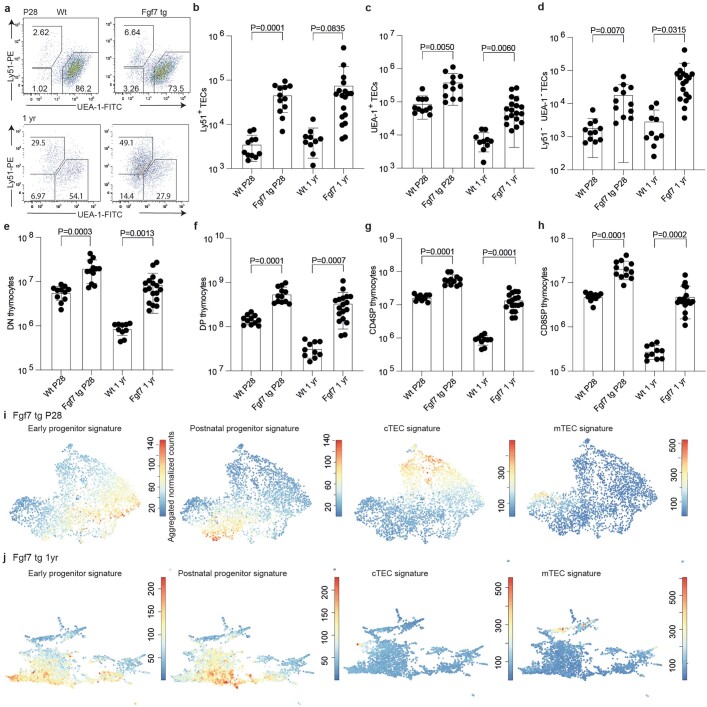
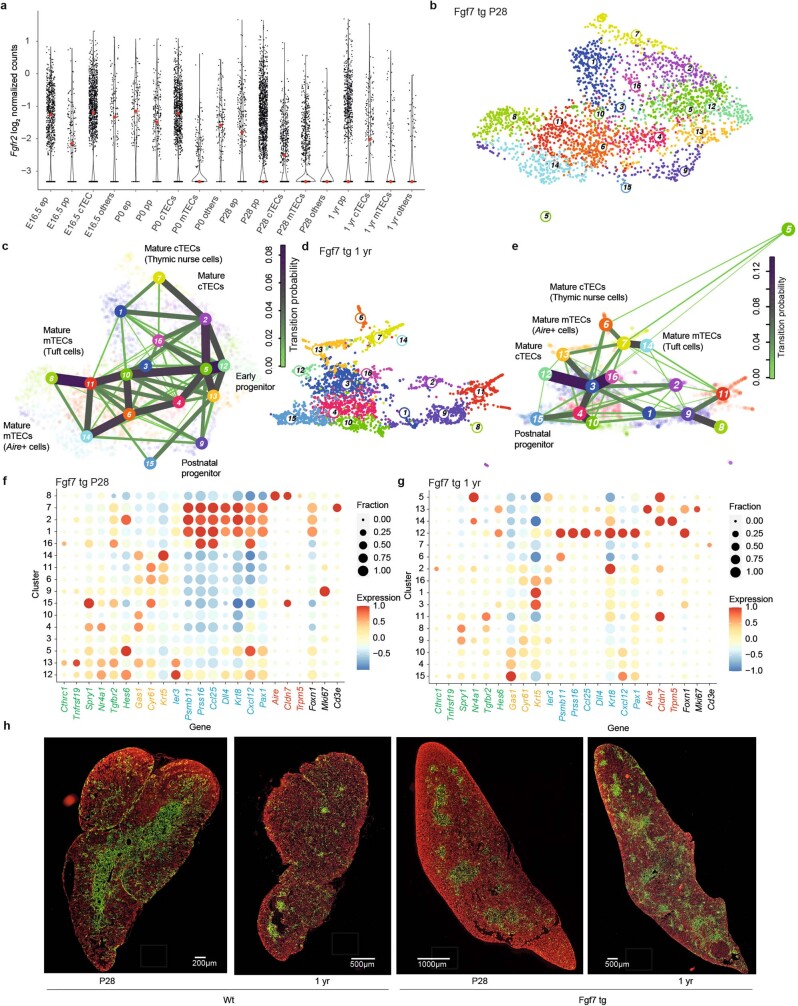
T cell development in the thymus is essential for cellular immunity and depends on the organotypic thymic epithelial microenvironment. In comparison with other organs, the size and cellular composition of the thymus are unusually dynamic, as exemplified by rapid growth and high T cell output during early stages of development, followed by a gradual loss of functional thymic epithelial cells and diminished naive T cell production with age1-10. Single-cell RNA sequencing (scRNA-seq) has uncovered an unexpected heterogeneity of cell types in the thymic epithelium of young and aged adult mice11-18; however, the identities and developmental dynamics of putative pre- and postnatal epithelial progenitors have remained unresolved1,12,16,17,19-27. Here we combine scRNA-seq and a new CRISPR-Cas9-based cellular barcoding system in mice to determine qualitative and quantitative changes in the thymic epithelium over time. This dual approach enabled us to identify two principal progenitor populations: an early bipotent progenitor type biased towards cortical epithelium and a postnatal bipotent progenitor population biased towards medullary epithelium. We further demonstrate that continuous autocrine provision of Fgf7 leads to sustained expansion of thymic microenvironments without exhausting the epithelial progenitor pools, suggesting a strategy to modulate the extent of thymopoietic activity.


Conflict of interest statement

The authors declare no competing interests.

Figures

Fig. 1
Fig. 1. Heterogeneity of TECs.
a, UMAP representation of transcriptome similarities among 6,959 individual TECs derived from 4-week-old wild-type male (n = 2) and female (n = 2) mice. Cell clusters and transition probabilities were inferred with VarID; connections with probability P > 0.001 are shown, with transition probabilities indicated by line thickness and colour. The positions of clusters containing early and postnatal bipotent progenitors and mature cTEC and mTEC clusters are indicated. Colours mark cells in the identified cell clusters. b, Expression profiles of signature genes in individual TEC clusters. cf, UMAP plots highlighting the aggregated expression profiles of gene groups distinguishing early (c) and postnatal (d) progenitors and cTECs (e) and mTECs (f). gi, Age-dependent changes in the TEC compartment. Transcriptome features of TEC clusters are shown at various time points expressed as ratios of progenitor and mature TEC gene set transcript counts; the P28 time point was used as a reference. Assignment of clusters to the four main populations in the coordinate system is indicated in g; the sizes of dots correspond to the relative fraction in the TEC population. j, Summary of dynamic changes in the composition of the TEC compartment. yr, year. Source data
Fig. 2
Fig. 2. Barcoding shows the differentiation capacity of progenitor populations.
a, Schematic of the CRISPR–Cas9-based barcoding system. DSB, double-strand break. b, Location of the target site in exon 3 of the mouse Hprt gene. c, Examples of barcodes; the germline sequence is shown with the sgRNA target and protospacer adjacent motif (PAM) sequences indicated at top. Nucleotide additions and deletions (dashes) are indicated in red. d, Frequencies of individual barcodes in decreasing order. e, Number of Foxn1-expressing TECs in the thymic rudiment of E12.5 embryos (left; n = 5) and numbers of different barcodes in the thymi of mice of different ages (right): E16.5, n = 6; P0, n = 5; P12–P15, n = 11; >P16, n = 12. The dotted lines indicate the range of the numbers of progenitors previously inferred from medullary islet counts in adult mice. f, Enrichment of shared barcodes in the Ly51UEA-1+ mTEC and Ly51+UEA-1 cTEC fractions of mice of different ages. Enrichment values were significantly different in the comparison of mice at P0 and >3 weeks (w) (P = 0.009, one-sided Wilcoxon test). E16.5, n = 6; P0, n = 5; ~2 weeks, n = 11; >3 weeks, n = 11. For e and f, boxes extend from the 25th to 75th percentile; whiskers extend to the largest and smallest values; and the median is indicated. See the Methods for a definition of the enrichment value Em. g, Co-occurrence probability of rare barcodes across pairs of samples highlighting enhanced co-occurrence in mTEC (m) and cTEC (c) fractions of the same mouse; individual mice are identified by number. Data are shown for n = 18 mice. hk, P values (–log10) of barcode frequencies indicating co-occurrence of individual barcodes in progenitor and mature TEC fractions (as defined in Fig. 1c–f) at different time points. For gk, P values were calculated as described in the Methods and corrected for multiple testing by the Benjamini–Hochberg method. The red numbers refer to clones discussed in the text. Source data
Fig. 3
Fig. 3. Autocrine Fgf stimulation results in sustained thymic hyperplasia.
ac, Quantitative assessment of thymopoiesis in wild-type (WT) and Foxn1-Fgf7 transgenic (Tg) mice at 4 weeks and 1 year of age. a, WT P28, n = 18;Tg P28, n = 19; WT 1 yr, n = 10;Tg 1 yr, n = 18. b, WT P28, n = 19; Tg P28, n = 21; WT 1 yr, n = 10; Tg 1 yr, n = 18. c, WT P28, n = 18; Tg P28, n = 19; WT 1 yr, n = 10; Tg 1 yr, n = 18. Data are shown as the mean ± s.d. P values are indicated from two-sided t tests. d, Representative photographs of thymi from the mice analysed in a; scale bar, 10 mm. eg, Transcriptome features of TEC clusters expressed as ratios of progenitor and mature TEC gene set transcript counts. Assignment of clusters to the four main populations in the coordinate system is indicated in e; the sizes of dots correspond to the relative fraction in the TEC population. h, Summary of dynamic changes in the composition of the TEC compartment. i, j, P values (–log10) of barcode frequencies indicating co-occurrence of individual barcodes in progenitor and mature TEC fractions (as defined in Fig. 1c–f) at two time points. P values were calculated as described in the Methods and corrected for multiple testing by the Benjamini–Hochberg method. The red numbers correspond to clones discussed in the text. k, Schematic indicating the divergent developmental trajectories of embryonic and postnatal epithelial progenitors. Line thickness corresponds to lineage bias; the dashed line indicates the presumptive lineage relationship of the two progenitor populations. Source data
Extended Data Fig. 1
Extended Data Fig. 1. Characterization of TECs isolated from 4 week-old mice.
a, UMAP representation highlighting the 20 clusters identified by VarID. b, Distribution of male and female TECs (colour-coded) in the UMAP map. c, Expression levels of cell cycle-related genes (see Supplementary Table 5). Cluster 3 corresponds to thymic nurse cells, which have a mixed phenotype of cTECs and thymocytes, the latter likely contributing to the proliferative signature; cluster 15 has affinities to the postnatal progenitor cluster but already expresses significant levels of Aire, a marker of mature mTECs, suggesting that this cluster harbours transit amplifying cells feeding into the mature mTEC populations. The first and third quartiles are marked by the box, the median is denoted by a horizontal line, the boundaries of the whiskers are set at 1.5 times the interquartile range, outliers are indicated as dots outside the boundary of the whiskers. Numbers of cells are as follows: Cluster 1, n = 516; cluster 2, n = 697; cluster 3, n = 288; cluster 4, n = 449; cluster 5, n = 296; cluster 6, n = 420; cluster 7, n = 773; cluster 8, n = 443; cluster 9, n = 136; cluster 10, n = 418; cluster 11, n = 306; cluster 12, n = 670; cluster 13, n = 81; cluster 14, n = 222; cluster 15, n = 401; cluster 16, n = 61; cluster 17, n = 21; cluster 18, n = 203; cluster 19, n = 189; cluster 20, n = 369. d, Expression profiles of the indicated signature genes. e, RNA in situ hybridization depicting Hspb1 expression patterns in the thymus of 4-week-old mice; cortex (c) and medulla (m) are indicated, dashed lines highlight the cortico-medullary junction. Hspb1, as well as other genes not shown here, are often referred to as stress-related genes that may become upregulated during tissue dissociation and single-cell isolation, causing artefactual associations in the transcriptome analysis. However, when assayed by RNA in situ hybridization in the intact thymic lobe of 4-week-old mice, Hspb1 marks a subset of medullary cells, indicating that its expression is an intrinsic characteristic of TECs and confirming that its expression profile deduced from scRNA-seq (see panel d) is not affected by the isolation procedure. Scale bar, 0.5 mm. f, Number of cells in individual TEC clusters. Cluster 17 represents cells derived from ectopic parathyroid tissue Source data
Extended Data Fig. 2
Extended Data Fig. 2. Characterization of gene sets defining embryonic and postnatal progenitors.
a, b, Five transcriptional trajectories each define the gene sets characterizing embryonic (a) and postnatal (b) progenitors. Gene lists are given in Supplementary Tables 1 and 2. The P28 time point is used as the reference point for expression levels. c, d, Expression values of individual genes in the sets characterizing embryonic (c) and postnatal (d) progenitors. Most genes exhibit low expression values. e, Pathway analysis of unique gene sets (Supplementary Tables 1–4) characterizing early and postnatal progenitors and mature cTECs and mTECs. The three most enriched biological processes each as defined by the database for annotation, visualization and integrated discovery (DAVID) annotation tool, are shown; the genes driving the enrichment for the GO categories are listed in Supplementary Table 6. Both progenitor populations express a number of heat shock protein genes, which are not considered here Source data
Extended Data Fig. 3
Extended Data Fig. 3. Age-dependent changes in the TEC compartment.
a–d, UMAP representation of transcriptome similarities between individual TECs isolated from thymi at various time points. Note that for P28, a combined analysis of three mice (2 females, 1 male) is shown, as they were subsequently used for the barcoding analysis; in Fig. 1, data from an additional non-barcoded mouse is included. Left panels in a-d indicate the cluster designation deduced by VarID. The right panels indicate the transcriptional relationships in terms of VarID-derived transition probabilities; connections with probabilities P > 0.001 are shown and the transition probabilities are indicated by line thickness and colouring. For orientation purposes, the major cell populations are also indicated. Cells derived from ectopic parathyroid tissue were detected at P28 (c, cluster 8), and 1 year (d, clusters 3 and 5). e–h, Expression profiles of TEC clusters for the indicated signature genes and the four time points. The fractions of each cluster expressing a particular gene and their respective expression levels are depicted according to the scales shown on the right. Dot colour represents the z-score of the mean expression levels of the gene in the respective cluster, and dot size represents the fraction of cells in the cluster expressing the gene; gene names are coloured according to shared expression patterns (EP: green; PP: orange; cTEC, blue; mTEC, red; other genes of interest, black). z-scores above 1 and below −2 are replaced by 1 and -1 respectively.
Extended Data Fig. 4
Extended Data Fig. 4. Age-dependent changes in the TEC compartment.
a–d, UMAP maps of progenitor and mature TEC populations at 4 different time points; embryonic day 16.5 (E16.5), newborn (P0), 4-week-old (P28), and 1-year-old (1 yr). The UMAP maps for P28 mice were generated by inclusion of only barcoded mice.
Extended Data Fig. 5
Extended Data Fig. 5. Comparative analysis of scRNA-seq data.
a–d, Projection of aggregated read-counts for gene sets defining early and postnatal progenitors and mature cTEC and mTEC (Supplementary Tables 1–4) onto the 9 major TEC subsets defined by Baran-Gale et al. (1). Whereas the early progenitor signature cannot be unequivocally assigned, the postnatal progenitor signature maps to the intertypical TEC subset; the cTEC and mTEC signatures match the description of Baran-Gale et al.. e, Analysis of scRNA-seq data of Baran-Gale et al. visualized using UMAP. Their 9 different TEC subtypes are distinguished by different colours, matching the code in a-d. f, Projection of aggregated read-counts for the early progenitor gene set onto the UMAP, indicating partial overlap with cells referred to as mature and perinatal cTECs. g, Projection of aggregated read-counts for the postnatal progenitor gene set onto the UMAP indicating good correspondence with the majority of intertypical TECs.
Extended Data Fig. 6
Extended Data Fig. 6. Characterization of the sgRNAHprt cassette.
a, Schematic of the components of the hU6:sgRNAHprt transgene; key features are indicated by name and are colour-coded; the bar representing the hU6 promotor sequence was truncated. b, Nucleotide sequence of the hU6:sgRNAHprt transgene construct (colour code as in a). ce, Frequencies of individual barcodes in decreasing order from left to right grouped by the degree of occurrence in the cohort of mice analysed here (n = 33); colours indicate those barcodes that satisfy the criterion indicated at the top right of each plot. f, Scatter plots of barcode frequencies for mTECs and cTECs from the same mouse versus barcode frequencies in cTECs isolated from two different mice. g, Fraction of informative barcodes observed in the TEC compartment of individual mice; informative barcodes are those whose P values indicate a significant deviation (Pb,i < 0.001 for barcode b in sample i) from the barcode frequencies expected from the background model. Since these values represent singular data points, statistical comparisons were not done. Barcode data are listed in Supplementary Tables 7–14 Source data
Extended Data Fig. 7
Extended Data Fig. 7. Characterization of wild-type TEC subsets at P28.
a, Flow cytometric analysis of EpCAM+CD45 TECs after co-staining with anti-Ly51 antibody and UEA-1 lectin. The cTEC gate is indicated on the upper left (2.64% of TECs), the mTEC gate is indicated on the lower right (75.7% of TECs). b, UMAP representation of transcriptome similarities resulting from the combined analysis of three types of wild-type TECs; EpCAM+ TECs without further purification, and TECs purified according to positive Ly51 and UEA-1 staining characteristics, with origins of TECs indicated by colours (EpCAM+ TECs without further purification, grey; Ly51+, blue; UEA-1+, red). c–f, Gene expression profiles of Foxn1 (c), Psmb11 (d), Prss16 (e), and Aire (f), depicted as normalized absolute counts. g, h, Reproducibility of lineage relationships in barcoded TEC populations of female mice; see Fig. 2j for the pattern of the male mouse. P values were calculated as described in the Methods section and multiple-testing corrected by the Benjamini-Hochberg method.
Extended Data Fig. 8
Extended Data Fig. 8. Characterization of clonal relationships in the mTEC compartment.
a, Co-occurrence of individual barcodes in individual TEC clusters (as defined in Extended Data Fig. 3c; 4c) at P28; the -log10 P values of barcode frequencies are indicated. Aire-positive cells share several barcodes with the postnatal progenitor population but also exhibit private barcodes (barcodes 91 and 102); this observation may be explained by the fact that a certain progenitor originally giving rise to the Aire-expressing cells has ceased to exist; alternatively, sublineage-restricted progenitors and their descendants that appear with developmental time may at some point outnumber the original bipotent ancestor, resulting in a lower sampling probability of the latter. Trmp5-expressing tuft cells, (cluster18) share barcodes 1 and 68_5 with the postnatal progenitor population and the Aire+ mTEC compartment, suggesting that they belong to the mTEC lineage. P values were calculated as described in the Methods section and multiple-testing corrected by the Benjamini-Hochberg method. b, c, Expression of Foxn1 (left panel) and Trmp5 (middle and right panels) genes was detected by RNA in situ hybridization using thymus sections of a 4- week-old wild-type mouse; the cortico-medullary junction is indicated by the dashed line; part of the medullary area (boxed) is shown as higher power view. Note that Foxn1-positive cells are present in both cortex and medulla, whereas Trmp5-expresing cells are found in the medulla only. Trmp5-positive cells express Krt8, but neither Ivl nor Foxn1; Ivl-expressing cells are Krt8 negative (Fig. 1b). d, Identification of scattered Krt18-positive cells in the medulla; most medullary cells express Krt5 (blue) and cortical cells express Krt18 (green). e, Active Foxn1 expression as revealed by the activity of the Foxn1:mCardinal transgene using an anti-RFP antibody (red). f, Foxn1 expression (as in e) in cortical and medullary TECs relative to Krt8 expressing TECs (anti-Krt8 antibody, blue); note that Krt8 typically identifies cTEC (as does Krt18). The rare Krt8 expressing cells in the medulla do not express Foxn1 (arrows). g, Identification of Foxn1-expressing cells (as in e), post-Foxn1 cells. Foxn1 expression is recorded via the Foxn1:mCardinal transgenic construct (anti-RFP antibody; red). Post-Foxn1 cells are identified by Foxn1-activated indelible EYFP expression in the Foxn1:Cre; Rosa26-LSL-EYFP reporter background (anti-GFP antibody, green); note the presence of purely green cells (arrows), indicating that such cells have lost Foxn1 expression. h, Combined analysis of all three cell states; Krt8-positive cells are post-Foxn1 cells (arrows); a magnification of the indicated area is shown on the left. Collectively, these data suggest that the Krt8-positive post-Foxn1 cells in the medulla are tuft cells. Scale bars, 0.1 mm. Panels in b and c are representative of 3 mice; panels in d-h are representative of 2 mice.
Extended Data Fig. 9
Extended Data Fig. 9. Characterization of the Fgfr2-signalling pathway in mouse embryos.
a–f, RNA in situ hybridization (ISH) analysis of mouse embryos. a–e, ISH performed on E13.5 embryos indicates that Fgfr2IIIb (but neither Fgfr2IIIc nor Fgfr1) expression is a common feature of pharyngeal epithelia. a, No detectable expression of the Fgfr1 gene in the thymic epithelium (higher magnification in inset). b, The Fgfr2 gene is expressed in epithelia of pharyngeal organs, including the thymus (inset). c, Low levels of expression of Fgfr2IIIc in the thymus. d, Moderate levels of expression of Fgfr2IIIb in the thymus; anatomical structures are indicated. e, Expression of Fgfr2IIIb is present in E13.5 Foxn1-deficient thymic epithelial rudiment and thus independent of Foxn1 activity. f, Expression of Fgf7 (E15.5, middle panel) and Fgf10 (E13.5, bottom panel) genes in the mesenchymal capsule of the thymus (indicated by arrows), but not in the epithelium that is marked by Foxn1 expression (E15.5, upper panel). The capsular zone is indicated with dashed red lines in the inset of each panel. g, qPCR analysis of gene expression patterns in purified thymic mesenchyme (isolated as CD45EpCAMCD31Ly51+ cells) and endothelium (isolated as CD45EpCAMCD31+Ly51 cells) of 4-week-old mice; data are shown as mean±s.e.m. n = 3 for all experiments. Enpep encodes the mesenchymal Ly51 marker (note that Enpep is also expressed on cTECs, which unlike mesenchymal cells also express the epithelial marker EpCAM); Cd31 expression marks endothelial cells. This analysis indicates that of the many ligands of Fgfr2b,, Fgf7 and Fgf10 are expressed by thymic mesenchyme, but not endothelial cells. Embryo genotypes for ad, Foxn1+/−, for e, Foxn1−/−; for f and g Foxn1+/+. Panels in a-f are representative of 3 mice. Scale bars, 0.1 mm for main panels; 0.05 mm for insets. Source data
Extended Data Fig. 10
Extended Data Fig. 10. Strategy of transgenic interference targeting the Fgfr2-signalling pathway.
a, Schematic illustration of the Fgf signalling pathway in the thymus. The mesenchyme (green) produces Fgf7 (and other Fgfr2 ligands) that bind to the Fgfr2IIIb variant of the receptor expressed by thymic epithelial cells (top row, left panel). In the present study, this pathway is genetically modulated in several ways to explore whether, under physiological conditions, the receptor or the ligand are in excess. We used the Foxn1 promotor to direct expression of various components of the Fgf signalling cascade in thymic epithelial cells, either singly or in combination. (i) Overexpression of the Fgfr2b receptor (top row, middle panel). The Foxn1:Fgfr2IIIb transgenic is designed to increase the sensitivity of epithelial cells to Fgf ligands. This transgenic constellation should result in a stimulatory effect if the ligand is in excess, because more receptor/ligand complexes can form at the cell surface of the target cell. However, if the ligand rather than the receptor is limiting, providing more receptors should have no effect on the target cell. (ii) Expression of a soluble decoy receptor (top row, right panel). The Foxn:s-Fgfr2IIIb transgenic line expresses a soluble dominant-negative form of the Fgfr2IIIb receptor, and is expected to disrupt productive Fgfr2IIIb receptor signalling. In this experiment, a decrease in the concentration of free ligand in the extracellular space should reduce engagement of receptors and thus diminish signalling activity. (iii) Autocrine provision of Fgf7 (bottom row, left panel). In the Foxn1:Fgf7 transgenic line, an autocrine loop is generated in the thymic microenvironment by expression of Fgf7 in TECs, resulting in an increase in the concentration of free ligand in the extracellular space. If, in the wild-type situation, receptor molecules are in excess and hence mostly free of ligand, signalling activity should increase; conversely, if under normal circumstances the ligand is in excess over the receptor, no effect should be seen. (iv) Simultaneous overexpression of both Fgf7 ligand and Fgfr2IIIb receptor (bottom row, right panel). This constellation is designed to test if the effect of excess Fgf7 ligand can be further increased by provision of additional receptors; if so, it would indicate that endogenous receptors are fully occupied by excess free ligand. b, Overexpression of Fgf7 (middle panel) and Fgfr2IIIb (bottom panel) in the thymic epithelium of Foxn1:Fgf7-transgenic and Foxn1:Fgfr2IIIb-transgenic mice respectively, as demonstrated by RNA in situ hybridization performed on sections from E15.5 embryos with the indicated probes. Scale bars, 0.1 mm. Panels are representative of 3 mice. c, Thymopoietic activities in 4-week-old mice of the indicated genotypes; the number of mice per genotype is indicated below each column; data are shown as mean±s.e.m. From multiple comparisons, only the statistically significant differences are indicated. No significant differences between male and female mice were observed; hence, data from animals of both sexes were pooled for the analysis. The variable extents of thymopoietic activity in the seven transgenic mouse lines studied herein indicate that, under physiological conditions, limiting levels of ligand(s) rather than those of the receptor determine the extent of Fgf signalling in TECs; note, for instance, that expression of a soluble Fgfr2IIIb decoy receptor impaired thymopoiesis in a wild-type background and even partially neutralized the autocrine effects of the Foxn1:Fgf7 transgene. t-test; two-sided; multiple-testing corrected by Benjamini-Hochberg method. P values for significant differences (i. e., P < 0.05) are indicated. d, Immunohistochemical analysis of wild-type and Foxn1:Fgf7 transgenic 4-week-old thymi; CD45-positive haematopoietic cells, red; Krt5-positive TECs, blue; Krt18-positive TECs, green. Scale bars, 0.1 mm. Panels are representative of 3 mice. Source data
Extended Data Fig. 11
Extended Data Fig. 11. Response of the thymic epithelium to KGF-treatment and autocrine stimulation.
These experiments are designed to test the hypothesis that acute provision of an Fgfr2b ligand increases the number of cells expressing the Fgfr2b receptor. a, Flow cytometric analysis of dissociated thymic tissue; the percentage of EpCAM+CD45 TECs is indicated in the left panels. The cell surface pattern of TECs is resolved after co-staining with anti-Ly51 antibody and UEA-1 lectin (right panels). The control is from a 2-week-old wild-type thymus; representative profiles for Foxn1:Fgfr2b transgenic cohorts of male mice treated with PBS or KGF (human Fgf7) are shown in the middle and bottom rows, respectively. As shown in Extended Data Fig. 10, the presence of the transgene as such has no influence on the magnitude of the endogenous Fgf7 response. Unlike the response to continuous Fgf stimulation (c.f., Fig. 3), short-term treatment of adult mice with exogenous human Fgf7 (KGF) causes a disproportional increase in Ly51+ cells at the expense of UEA-1+ TECs. b, Numerical assessment of TEC subsets (n = 3 per condition; data are shown as mean±s.e.m.). At the age of four weeks, male mice received 9 intra-peritoneal injections of KGF at days 1, 2, 3, 8, 9, 10, 15, 16, 17 and were sacrificed on day 21; note the large increase of Ly51+ TECs after KGF treatment. The lack of a significant increase in thymocyte numbers indicates that the Fgf-responsive TEC compartment initially gives rise to functionally immature Ly51+ progeny; this observation supports the notion that the Ly51+ TEC compartment is functionally heterogeneous and indicates that Ly51 expression as such does not unequivocally identify mature cTECs. t-test; two-sided; P values are indicated. c, Age-related down-regulation of Foxn1-expression in Fgf-stimulated TECs revealed by flow cytometry. Representative flow cytometric profiles of EpCAM+CD45 TECs of 7 to 8 week-old female and male mice with the indicated genotypes; the non-transgenic wild-type cells serve as a negative control for reporter expression levels arising from the Foxn1:EGFP transgene. Note that Fgf7 stimulation does not prevent the age-dependent physiological down-regulation of the Foxn1 gene. d, Foxn1-negative TECs once expressed Foxn1, as indicated by the presence of indelible lineage marks in TECs of 4 to 6 week-old female mice (males show the same pattern) as revealed by the Rosa26-LSL-EYFP; Foxn1:Cre reporter line. For c and d, the profiles are representative of at least 4 biological replicates. e, Fgf7 stimulation fails to increase the number of TECs in Foxn1-deficient mice. The numbers of mice in the two cohorts are shown below the histogram; data are shown as mean±s.e.m. Since Foxn1-deficient epithelia do not proliferate in response to Fgf stimulation, all changes in the TEC compartment described here are likely to originate from Foxn1-expressing cells. Source data
Extended Data Fig. 12
Extended Data Fig. 12. Changes in the thymic microenvironment upon autocrine Fgf stimulation.
a, Representative flow cytometric profiles of Epcam+CD45 TECs from wild-type (left panel) and Foxn1:Fgf7 transgenic (right panel) mice at either 4-weeks (P28) or 1-year (1 yr) of age (top and bottom rows respectively); the percentages of individual TEC subpopulations are indicated in the respective gates. b–d, Numerical analysis of TEC subpopulations based on flow cytometry. For b-d, Wt P28, n = 11; Fgf7 tg P28, n = 12; Wt 1 yr, n = 10; Fgf7 tg 1 yr, n = 18. Data are shown as mean±s.e.m. e–h, Flow cytometric analyses of CD45+ thymocyte populations; DN, CD4CD8; DP, CD4+CD8+; CD4SP, CD4+CD8; CD8SP, CD4CD8+. For e-h, Wt P28, n = 11; Fgf7 tg P28, n = 12; Wt 1 yr, n = 10; Fgf7 tg 1 yr, n = 18. Data are shown as mean±s.e.m. t-test; two-sided; P values are indicated. i, j, UMAP representation of progenitor and mature TEC populations in Foxn1:Fgf7 transgenic mice at (i) P28 and (j) 1 year of age. Source data
Extended Data Fig. 13
Extended Data Fig. 13. Effect of continuous Fgf7 signalling on the TEC compartment in young and old mice.
a, Expression of the Fgfr2 gene in cells of different TEC subsets of mice at different time points (E16.5 EP, n = 721 cells; E16.5 PP, n = 166 cells; E16.5 cTECs, n = 1,159 cells; E16.5 others, n = 141 cells; P0 EP, n = 136 cells; P0 PP, n = 226 cells; P0 cTECs, n = 924 cells; P0 mTECs, n = 311 cells; P0 others, n = 148 cells; P28 EP, n = 292 cells; P28 PP, n = 2,302 cells; P28 cTECs, n = 554 cells; P28 mTECs, n = 2,338 cells; P28 others, n = 303 cells; 1yr PP, n = 981 cells; 1yr cTECs, n = 225 cells; 1yr mTECs, n = 209 cells; 1 yr others, n = 87 cells). Data are presented as violin plots; the red dots indicate median expression levels. Negative cells are given a pseudo-count of 0.1. scRNA-seq datasets of barcoding mice across different time points were merged and normalized by downscaling to 1,500 transcript counts in order to calculate the log2-normalized transcript counts for Fgfr2. b, d, UMAP representation of transcriptome similarities between individual TECs isolated from thymi of P28 (b), or 1 year-old (d) Foxn1:Fgf7 transgenic mice. c, e, Cluster designations deduced by VarID indicating the transcriptional relationships in terms of VarID-derived transition probabilities; connections with probabilities P > 0.001 are shown and the transition probabilities are indicated by line thickness and colouring. For orientation purposes, the major cell populations are also indicated. In panel (e), cluster 5 represents cells derived from ectopic parathyroid tissue. f, g, Expression profiles of TEC clusters for the indicated signature genes and the two time points. The fractions of each cluster expressing a particular gene and their respective expression levels are depicted according to the scales shown on the right. Dot colour represents the z-score of the mean expression levels of the gene in the respective cluster and dot size represents the fraction of cells in the cluster expressing the gene; gene names are coloured according to shared expression patterns (EP: green; PP: orange; cTEC, blue; mTEC, red; other genes of interest, black). z-scores above 1 and below -1 are replaced by 1 and -1 respectively. h, Immunohistochemical analysis of thymic lobes of wild-type (wt) and Foxn1:Fgf7 transgenic mice at two different time points. Sections were stained with anti-Keratin 5 (green) and anti-Keratin 18 (red) antibodies, marking medullary and cortical compartments. Scale bars are indicated; panels are representative of 4 mice.

References

    1. Baran-Gale J, et al. Ageing compromises mouse thymus function and remodels epithelial cell differentiation. eLife. 2020;9:e56221. doi: 10.7554/eLife.56221. - DOI - PMC - PubMed
    1. Venables T, Griffith AV, DeAraujo A, Petrie HT. Dynamic changes in epithelial cell morphology control thymic organ size during atrophy and regeneration. Nat. Commun. 2019;10:4402. doi: 10.1038/s41467-019-11879-2. - DOI - PMC - PubMed
    1. George AJT, Ritter MA. Thymic involution with ageing: obsolescence or good housekeeping? Immunol. Today. 1996;17:267–272. doi: 10.1016/0167-5699(96)80543-3. - DOI - PubMed
    1. Boehm T, Swann JB. Thymus involution and regeneration: two sides of the same coin? Nat. Rev. Immunol. 2013;13:831–838. doi: 10.1038/nri3534. - DOI - PubMed
    1. Steinmann GG, Klaus B, Müller-Hermelink H-K. The involution of the ageing human thymic epithelium is independent of puberty. A morphometric study. Scand. J. Immunol. 1985;22:563–575. doi: 10.1111/j.1365-3083.1985.tb01916.x. - DOI - PubMed

Substances