. 2022 Aug;21(4):1217-1232.
doi: 10.1007/s10237-022-01586-1. Epub 2022 May 25.

A longitudinal study of the arterio-venous fistula maturation of a single patient over 15 weeks

Affiliations

A longitudinal study of the arterio-venous fistula maturation of a single patient over 15 weeks

Eamonn Colley et al. Biomech Model Mechanobiol. 2022 Aug.

Abstract

Arterio-venous fistula creation is the preferred vascular access for haemodialysis, but has a large failure rate in the maturation period. Previous research, considering the remodelling mechanisms for failure-to-mature patients, has been limited by obtaining the patient-specific boundary conditions at only a few points in the patient history. Here, a non-invasive imaging system was used to reconstruct the three-dimensional vasculature, and computational fluid dynamics was used to analyse the haemodynamics for one patient over 15 weeks. The analysis suggested evidence of a control mechanism, which adjusts the lumen diameter to keep the wall shear stress near constant in the proximal regions of the vein and artery. Additionally, the vein and artery were shown to remodel at different growth rates, and the blood flow rate also saw the largest increase within the first week. Wall shear stress at time of creation may be a useful indicator for successful AVF maturation.

Keywords: Arterio-venous fistula; Computational fluid dynamics; Dialysis; Vascular access.


Conflict of interest statement

The authors have no disclosures. All procedures followed were in accordance with the ethical standards of the responsible committee on human experimentation (institutional and national) and with the Helsinki Declaration of 1975, as revised in 2000 (5). Informed consent was obtained from all patients for being included in the study.

Figures

Fig. 1
Fig. 1
Unstructured mesh. The mesh is generated with tetrahedral elements and then converted to polyhedral elements. The cross section of the polyhedral mesh at the vein, artery and anastomosis displays the mesh resolution at the core and boundary layers; element height starts at 0.025 mm near the wall. TAWSS values at locations 1–4 are used to test for grid independence
Fig. 2
Fig. 2
Anatomical regions of the three-dimensional vasculature. A volume of the AVF lumen is created from the 3D freehand ultrasound system, and the focus regions are defined
Fig. 3
Fig. 3
Comparison of the vasculature at baseline and at 1 week post-surgery. The cephalic vein (blue) is surgically attached to the radial artery (red) to create an AVF (green). A comparison at baseline to 1 week post-surgery shows the large difference in cross-sectional areas by flow-induced remodelling. For the baseline artery and vein, the cross-sectional areas are taken from the approximate location where the AVF was created
Fig. 4
Fig. 4
Longitudinal vascular remodelling. Longitudinal remodelling of the patient’s AVF over 15 weeks is shown for both artery and vein. Each point on the graph corresponds to the cross-sectional area, sampled at 1-mm distances along the centrelines of the vasculature. A greyscale is used to represent the weekly changes, with week 1 corresponding to a lighter shade and week 15 darker. The volume of each segment (a–d) is compared to the baseline level and fitted to a line of best fit to demonstrate the trend. a, c Anastomosis to 40 mm along the centreline. b, d) From 40 to 80 mm along the centreline from the anastomosis
Fig. 5
Fig. 5
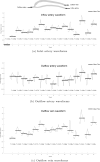
Transient waveforms. The transient waveforms are measured with Doppler ultrasound and are shown for the inflow artery, outflow artery and outflow vein. At pre-creation, the flow rate in the inflow artery is pulsatile with a mean flow rate of 10 mL/min. There is an apparent increase in the flow rate for the inflow artery and outflow vein, but the outflow artery stays approximately constant. It should be noted that after week 10, there are larger fluctuations in the flow rates. Each flow rate is normalised with the cardiac cycle, where T represents the cycle length in seconds (s)
Fig. 6
Fig. 6
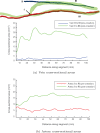
Mean flow rates. The mean flow rate is shown for the inflow artery, outflow artery and outflow vein and lines of best fit added to demonstrate the trend. There is a 36-fold increase from pre-creation to week 1 in the inflow artery (10 mL/min to 360 mL/min). The outflow artery has retrograde flow which remains approximately constant, and accounts for approximately 20% of the flow in the vein
Fig. 7
Fig. 7
Velocity streamlines at systole for week 1 and week 2. The velocity streamlines are shown for week 1 and week 2, where the majority of the remodelling happens in the maturation. There is a large increase in flow between the 2 weeks. Note that the flow in the outflow artery is retrograde
Fig. 8
Fig. 8
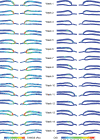
TAWSS and OSI contours—weekly changes. Time-averaged wall shear stress (TAWSS) is shown on the left and the oscillatory shear index (OSI) on the right, displaying both the medial and lateral view. High TAWSS is seen in the vein swing segment and anastomosis region. High OSI values are seen on one side of the AVF, typically in the vein swing segment and just after. Note that the geometry is not to scale
Fig. 9
Fig. 9
transWSS contours—weekly changes. The transWSS is shown for each of the weeks. Note that the geometry is not to scale
Fig. 10
Fig. 10
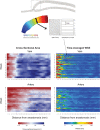
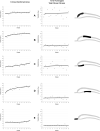
Geometric and TAWSS comparison. Top: The vasculature is divided into sub-volumes (nodes), spaced 1 mm apart and an example node is shown in the highlighted region in the figure. For each node, the nearest face cells on the wall, which make up the surface area of the sub-volume, are represented by a 2D rectangular box, shown here in black. The wall faces within this region shown in black, which contain the TAWSS values, are sorted via a histogram function, where the size indicates the bin count and the colour by the magnitude of the TAWSS in that bin. This allows a comparison of WSS distribution along with the area distribution, over time. Bottom: The cross-sectional area (left) at each node is shown for weeks 1–15 in the vein and from baseline to week 15 in the artery. TAWSS (right) shows large values near the anastomosis in both the vein and artery, with much lower values after 40 mm
Fig. 11
Fig. 11
Vascular remodelling. Various segments of the AVF are shown and their associated changes in the spatially averaged cross-sectional area and time-averaged wall shear stress (TAWSS). Segments further from the anastomosis (b, d) have less weekly fluctuations in TAWSS and have constancy of approximately 3 Pa. Segments closer to the anastomosis (a, c) have a much higher baseline value and larger fluctuations. Trends are shown via lines of best fit through the data points

References

    1. Bozzetto M, Ene-Iordache B, Remuzzi A. Transitional flow in the venous side of patient-specific arteriovenous fistulae for hemodialysis. Ann Biomed Eng. 2016;44(8):2388–2401. doi: 10.1007/s10439-015-1525-y. - DOI - PubMed
    1. Bozzetto M, Brambilla P, Rota S, Ene-Iordache B, Sironi S, Remuzzi G, Remuzzi A. Toward longitudinal studies of hemodynamically induced vessel wall remodeling. Int J Artif Organs. 2018 doi: 10.1177/0391398818784207. - DOI - PubMed
    1. Browne LD, Walsh MT, Griffin P. Experimental and numerical analysis of the bulk flow parameters within an arteriovenous fistula. Cardiovasc Eng Technol. 2015;6(4):450–462. doi: 10.1007/s13239-015-0246-6. - DOI - PubMed
    1. Carroll GT, McGloughlin TM, Burke PE, Egan M, Wallis F, Walsh MT. Wall shear stresses remain elevated in mature arteriovenous fistulas: a case study. J Biomech Eng. 2011;133(2):021003. doi: 10.1115/1.4003310. - DOI - PubMed
    1. Carroll J, Colley E, Thomas S, Varcoe R, Simmons A, Barber T. Tracking geometric and hemodynamic alterations of an arteriovenous fistula through patient-specific modelling. Comput Methods Programs Biomed. 2020 doi: 10.1016/j.cmpb.2019.105203. - DOI - PubMed

LinkOut - more resources