. 2022 May 10:20:2268-2279.
doi: 10.1016/j.csbj.2022.05.012. eCollection 2022.

Delineating the conformational landscape and intrinsic properties of the angiotensin II type 2 receptor using a computational study

Affiliations

Delineating the conformational landscape and intrinsic properties of the angiotensin II type 2 receptor using a computational study

Xiaoliang Cong et al. Comput Struct Biotechnol J. .

Abstract

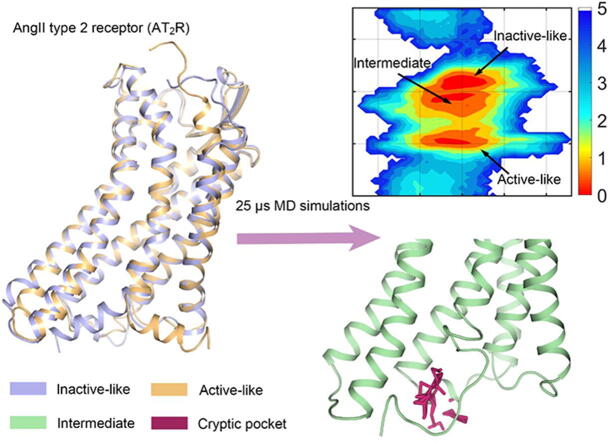
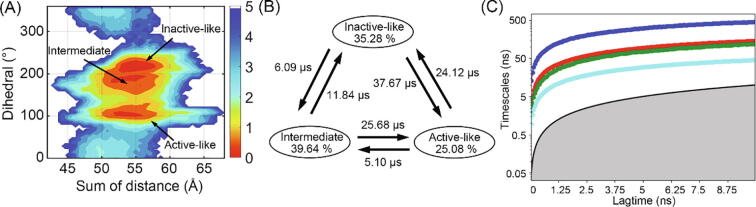
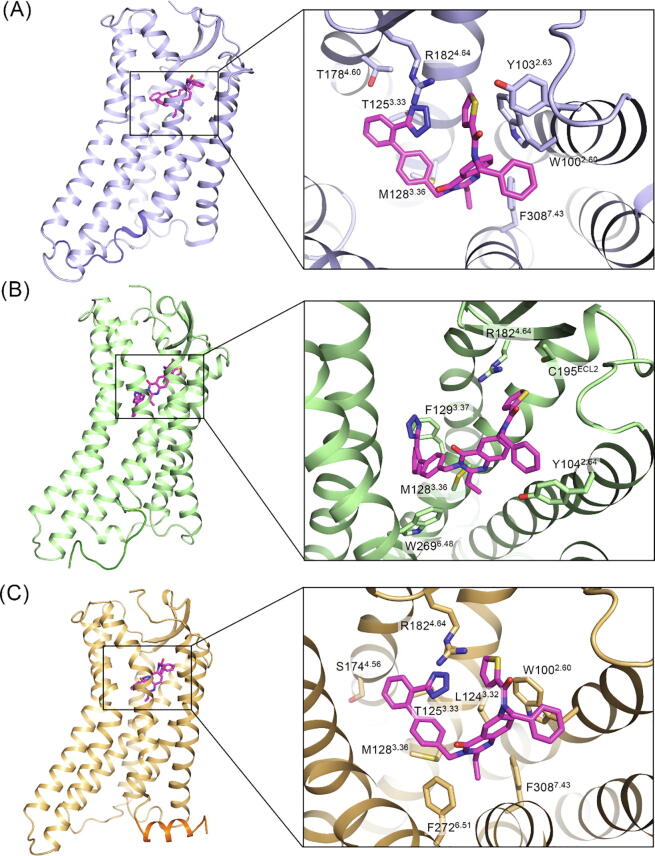
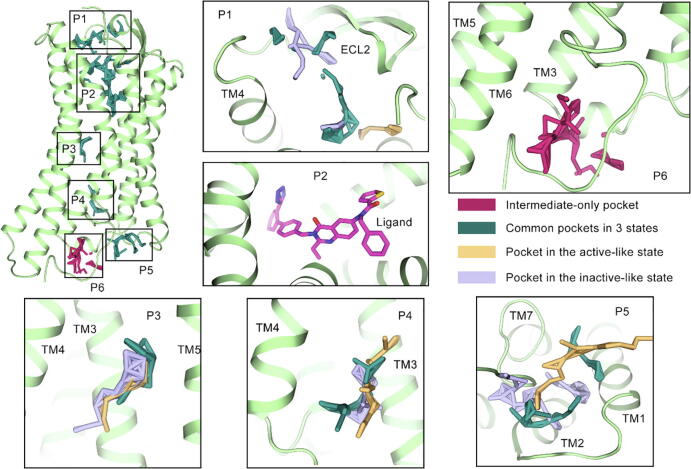
As a key regulator for the renin-angiotensin system, a class A G protein-coupled receptor (GPCR), AngII type 2 receptor (AT2R), plays a pivotal role in the homeostasis of the cardiovascular system. Compared with other GPCRs, AT2R has a unique antagonist-bound conformation and its mechanism is still an enigma. Here, we applied combined dynamic and evolutional approaches to investigate the conformational space and intrinsic properties of AT2R. With molecular dynamic simulations, Markov State Models, and statistics coupled analysis, we captured the conformational landscape of AT2R and identified its uniquity from both dynamical and evolutional viewpoints. A cryptic pocket was also discovered in the intermediate state during conformation transitions. These findings offer a deeper understanding of the AT2R mechanism at an atomic level and provide hints for the design of novel AT2R modulators.

Keywords: AT2R; Conformational dynamics; Cryptic pocket; G protein-coupled receptors; MD simulations.


Conflict of interest statement

The authors declare that they have no known competing financial interests or personal relationships that could have appeared to influence the work reported in this paper.

Figures

None
Graphical abstract
Fig. 1
Fig. 1
(A) RMSF value for each residue during MD simulations. Flexible domains are highlighted in green rectangles. (B) The structure colored by the RMSF value. Highly flexible domains such as N-term and H8 were removed for clarity. (C) The movement expressed by major PCs. Yellow, green, and blue arrows represent the movement shown by PC1, PC2, and PC3, respectively. (For interpretation of the references to color in this figure legend, the reader is referred to the web version of this article.)
Fig. 2
Fig. 2
(A) The distinctions between the AT2R in the two states. Purple and orange cartoons show inactive-like and active-like AT2R, respectively. In the zoom-in views, the sum of distance between the Cα atoms of S2.40 to K5.63 and S2.40 to K6.25 was shown to measure the movement of TM5-TM6. The dihedral among the Cα atoms of L8.54, V7.56, C7.54, and C7.47 was applied for the movement of H8. (B) The free energy landscape composed of the sum of distance and dihedral. Arrows show the position of inactive-like and active-like AT2R on the landscape. (For interpretation of the references to color in this figure legend, the reader is referred to the web version of this article.)
Fig. 3
Fig. 3
(A) The conservation score of each position in a multiple sequence alignment for AT2R sequences. Secondary structures for positions were labelled above. Color scheme: green, α-helix; purple, β-sheet; gray, loop. (B) Logoplots visualizing residue frequency in each position. (C) SCA matrix for residue pairs. From blue to red, the evolutional correlation increases. H8 interaction domain is labelled by a line. (D) The projection of residues on the PC2-PC3 and PC2-PC4 decomposition for SCA matrix. Blue and red circles identify corresponding sector residues. (E) The clustered co-evolution matrix for blue and red sectors. (F) The location of blue and red evolutional sectors on AT2R. Sector residues are colored correspondingly and the other residues are shown in gray cartoons. Key helixes and position of the orthosteric pocket are labelled. (For interpretation of the references to color in this figure legend, the reader is referred to the web version of this article.)
Fig. 4
Fig. 4
(A) The DCCM matrix between residue pairs. Red and blue show correlated and anti-correlated movement between the pair, respectively. The correlation with a constant smaller than 0.3 was colored white for clarity. Rectangles show key correlation domains. Secondary structures of residues are shown around the residue index. Color scheme: green, α-helix; purple, β-sheet; gray, loop. (B) The position of highly contacting residues (W1002.60, I3047.39, and F3087.43, more than 60% in contact with ligand at the threshold of 4 Å) and ligand. AT2R and ligand were colored orange and magentas, respectively. (C) The projection of DCCM score for highly contacting residues on AT2R structure. The color scheme is the same as (A). (For interpretation of the references to color in this figure legend, the reader is referred to the web version of this article.)
Fig. 5
Fig. 5
(A) The position of macrostates on the free energy landscape and their corresponding states in activation. (B) The transition between macrostates and proportions of each state. (C) The implied timescale test for the MSM. Different timescales τ1, τ2, τ3, and τ4 were represented as blue, red, green, and cyan lines changing with lag time. (For interpretation of the references to color in this figure legend, the reader is referred to the web version of this article.)
Fig. 6
Fig. 6
The representative structure and pocket conformation for inactive-like (A), intermediate (B), and active-like (C) AT2R, which are shown in purple, green, and orange cartoons. The dark color identifies the position of H8. The interface residues and ligand are shown in sticks. (For interpretation of the references to color in this figure legend, the reader is referred to the web version of this article.)
Fig. 7
Fig. 7
The pockets predicted by Fpocket in the intermediate state. Pockets are shown in sticks and zoom-in subplots show the specific position of each pocket. The pockets overlapping with those in other macrostates are colored in deep green, while the unique pocket P6 for the intermediate state was colored in red. Purple and orange sticks depict pockets in the representative inactive-like and active-like structures, respectively. (For interpretation of the references to color in this figure legend, the reader is referred to the web version of this article.)
Fig. 8
Fig. 8
The two possible ligand binding modes for P6. (A) The docked pose for Z164965728, representing the “up” pose interacting with ICL2, TM3, TM6, and H8. (B) The docked pose for Z1560372712, representing the “down” pose mainly interacting with H8.

Similar articles

Cited by

References

    1. Karnik S.S., Unal H., Kemp J.R., Tirupula K.C., Eguchi S., Vanderheyden P.M.L., et al. International Union of Basic and Clinical Pharmacology. XCIX. Angiotensin Receptors: Interpreters of Pathophysiological Angiotensinergic Stimuli. correctedPharmacol Rev. 2015;67:754–819. - PMC - PubMed
    1. Mehta P.K., Griendling K.K. Angiotensin II cell signaling: physiological and pathological effects in the cardiovascular system. Am J Physiol Cell Physiol. 2007;292:82–97. - PubMed
    1. Paz Ocaranza M., Riquelme J.A., García L., Jalil J.E., Chiong M., Santos R.A.S., et al. Counter-regulatory renin-angiotensin system in cardiovascular disease. Nat Rev Cardiol. 2020;17:116–129. - PMC - PubMed
    1. Zaman M.A., Oparil S., Calhoun D.A. Drugs targeting the renin-angiotensin-aldosterone system. Nat Rev Drug Discov. 2002;1:621–636. - PubMed
    1. de Gasparo M., Catt K.J., Inagami T., Wright J.W., Unger T. International union of pharmacology. XXIII. The angiotensin II receptors. Pharmacol Rev. 2000;52:415–472. - PubMed