

A Porcine Sepsis Model With Numerical Scoring for Early Prediction of Severity
- PMID: 35615093
- PMCID: PMC9125192
- DOI: 10.3389/fmed.2022.867796
A Porcine Sepsis Model With Numerical Scoring for Early Prediction of Severity
Abstract
Introduction: Sepsis can lead to organ dysfunctions with disturbed oxygen dynamics and life-threatening consequences. Since the results of organ-protective treatments cannot always be transferred from laboratory models into human therapies, increasing the translational potential of preclinical settings is an important goal. Our aim was to develop a standardized research protocol, where the progression of sepsis-related events can be characterized reproducibly in model experiments within clinically-relevant time frames.
Methods: Peritonitis was induced in anesthetized minipigs injected intraperitoneally with autofeces inoculum (n = 27) or with saline (sham operation; n = 9). The microbial colony-forming units (CFUs) in the inoculum were retrospectively determined. After awakening, clinically relevant supportive therapies were conducted. Nineteen inoculated animals developed sepsis without a fulminant reaction. Sixteen hours later, these animals were re-anesthetized for invasive monitoring. Blood samples were taken to detect plasma TNF-α, IL-10, big endothelin (bET), high mobility group box protein1 (HMGB1) levels and blood gases, and sublingual microcirculatory measurements were conducted. Hemodynamic, respiratory, coagulation, liver and kidney dysfunctions were detected to characterize the septic status with a pig-specific Sequential Organ Failure Assessment (pSOFA) score and its simplified version (respiratory, cardiovascular and renal failure) between 16 and 24 h of the experiments.
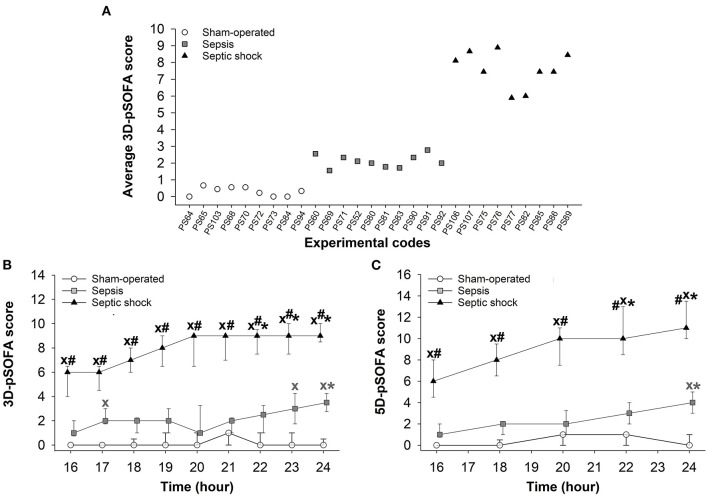
Results: Despite the standardized sepsis induction, the animals could be clustered into two distinct levels of severity: a sepsis (n = 10; median pSOFA score = 2) and a septic shock (n = 9; median pSOFA score = 8) subgroup at 18 h of the experiments, when the decreased systemic vascular resistance, increased DO2 and VO2, and markedly increased ExO2 demonstrated a compensated hyperdynamic state. Septic animals showed severity-dependent scores for organ failure with reduced microcirculation despite the adequate oxygen dynamics. Sepsis severity characterized later with pSOFA scores was in correlation with the germ count in the induction inoculum (r = 0.664) and CFUs in hemocultures (r = 0.876). Early changes in plasma levels of TNF-α, bET and HMGB1 were all related to the late-onset organ dysfunctions characterized by pSOFA scores.
Conclusions: This microbiologically-monitored, large animal model of intraabdominal sepsis is suitable for clinically-relevant investigations. The methodology combines the advantages of conscious and anesthetized studies, and mimics human sepsis and septic shock closely with the possibility of numerical quantification of host responses.
Keywords: SOFA score; fecal peritonitis; inflammatory markers; organ dysfunction; pig model; sepsis; septic shock.
Copyright © 2022 Rutai, Zsikai, Tallósy, Érces, Bizánc, Juhász, Poles, Sóki, Baaity, Fejes, Varga, Földesi, Burián, Szabó, Boros and Kaszaki.
Conflict of interest statement
The authors declare that the research was conducted in the absence of any commercial or financial relationships that could be construed as a potential conflict of interest.
Figures


Similar articles
-
[Clinically relevant sepsis model in minipigs].Magy Seb. 2012 Aug;65(4):198-204. doi: 10.1556/MaSeb.65.2012.4.5. Magy Seb. 2012. PMID: 22940388 Hungarian.
-
Adaptation and Validation of a Pediatric Sequential Organ Failure Assessment Score and Evaluation of the Sepsis-3 Definitions in Critically Ill Children.JAMA Pediatr. 2017 Oct 2;171(10):e172352. doi: 10.1001/jamapediatrics.2017.2352. Epub 2017 Oct 2. JAMA Pediatr. 2017. PMID: 28783810 Free PMC article.
-
[Significance of high mobility group box 1, von Willebrand factor and other cytokines in the evaluation of severity and prognosis of sepsis patients].Zhonghua Wei Zhong Bing Ji Jiu Yi Xue. 2020 Aug;32(8):933-937. doi: 10.3760/cma.j.cn121430-20200428-00346. Zhonghua Wei Zhong Bing Ji Jiu Yi Xue. 2020. PMID: 32912405 Chinese.
-
Evolution of the Concept of Sepsis Scoring Systems in Pediatrics to Predict Mortality and Outcomes.Cureus. 2024 Nov 29;16(11):e74725. doi: 10.7759/cureus.74725. eCollection 2024 Nov. Cureus. 2024. PMID: 39735042 Free PMC article. Review.
-
Modeling sepsis, with a special focus on large animal models of porcine peritonitis and bacteremia.Front Physiol. 2023 Jan 10;13:1094199. doi: 10.3389/fphys.2022.1094199. eCollection 2022. Front Physiol. 2023. PMID: 36703923 Free PMC article. Review.
Cited by
-
Norepinephrine Infusion and the Central Venous Waveform in a Porcine Model of Endotoxemic Hypotension with Resuscitation: A Large Animal Study.J Invest Surg. 2025 Dec;38(1):2445603. doi: 10.1080/08941939.2024.2445603. Epub 2025 Jan 6. J Invest Surg. 2025. PMID: 39761972
-
Therapeutic effect of adipose-derived mesenchymal stem cells in a porcine model of abdominal sepsis.Stem Cell Res Ther. 2023 Dec 12;14(1):365. doi: 10.1186/s13287-023-03588-x. Stem Cell Res Ther. 2023. PMID: 38087374 Free PMC article.
-
The Impact of Pathogens on Sepsis Prevalence and Outcome.Pathogens. 2024 Jan 20;13(1):89. doi: 10.3390/pathogens13010089. Pathogens. 2024. PMID: 38276162 Free PMC article. Review.
-
Elevated level of extracellular vimentin is associated with an increased fibrin formation potential in sepsis: ex vivo swine study.Intensive Care Med Exp. 2024 Aug 29;12(1):75. doi: 10.1186/s40635-024-00660-5. Intensive Care Med Exp. 2024. PMID: 39207603 Free PMC article.
-
Active CNS delivery of oxycodone in healthy and endotoxemic pigs.Fluids Barriers CNS. 2024 Oct 23;21(1):86. doi: 10.1186/s12987-024-00583-z. Fluids Barriers CNS. 2024. PMID: 39443944 Free PMC article.
References
-
- Vincent JL, de Mendonça A, Cantraine F, Moreno R, Takala J, Suter PM, et al. . Use of the SOFA score to assess the incidence of organ dysfunction/failure in intensive care units: results of a multicenter, prospective study. Working group on “sepsis-related problems” of the European Society of Intensive Care Medicine. Crit Care Med. (1998) 26:1793–800. 10.1097/00003246-199811000-00016 - DOI - PubMed
LinkOut - more resources
Full Text Sources