

Serum Metabolomics Benefits Discrimination Kidney Disease Development in Type 2 Diabetes Patients
- PMID: 35615098
- PMCID: PMC9126316
- DOI: 10.3389/fmed.2022.819311
Serum Metabolomics Benefits Discrimination Kidney Disease Development in Type 2 Diabetes Patients
Abstract
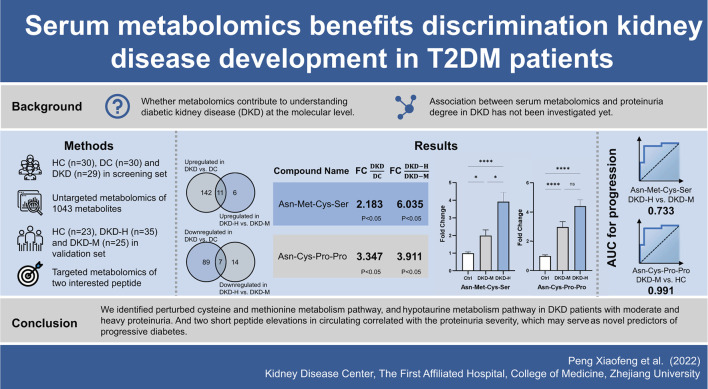
Background: Diabetic kidney disease (DKD) is the primary cause of end-stage renal disease, raising a considerable burden worldwide. Recognizing novel biomarkers by metabolomics can shed light on new biochemical insight to benefit DKD diagnostics and therapeutics. We hypothesized that serum metabolites can serve as biomarkers in the progression of DKD.
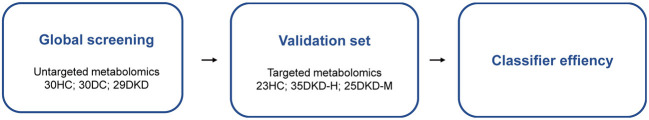
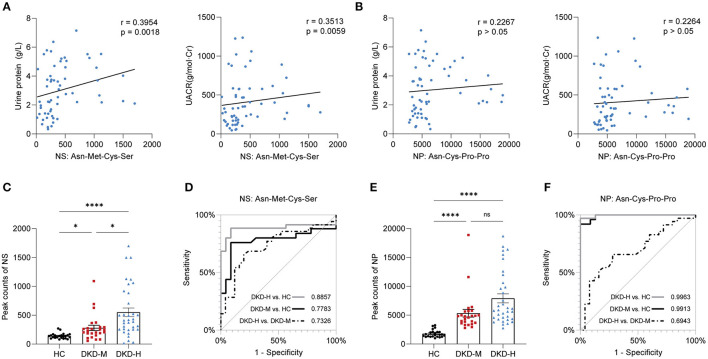
Methods: A cross-sectional study of 1,043 plasma metabolites by untargeted LC/MS among 89 participants identified associations between proteinuria severity and metabolites difference. Pathway analysis from differently expressed metabolites was used to determine perturbed metabolism pathways. The results were replicated in an independent, cross-sectional cohort of 83 individuals. Correlation and prediction values were used to examine the association between plasma metabolites level and proteinuria amount.
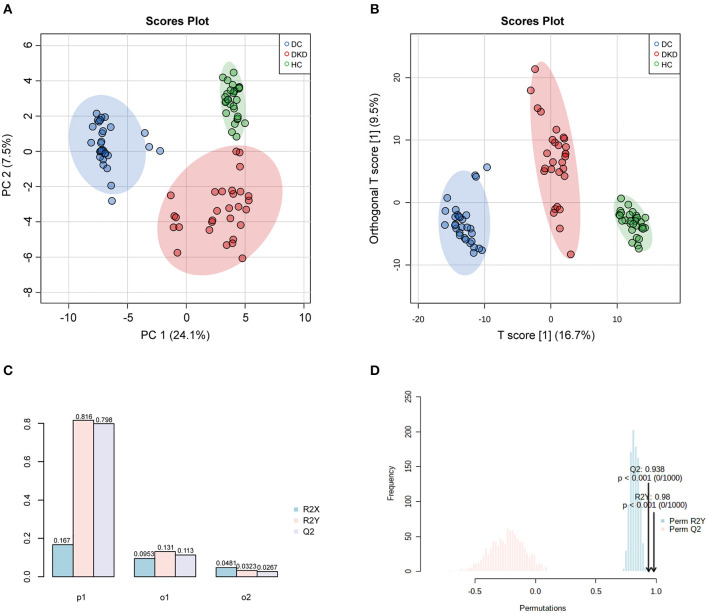
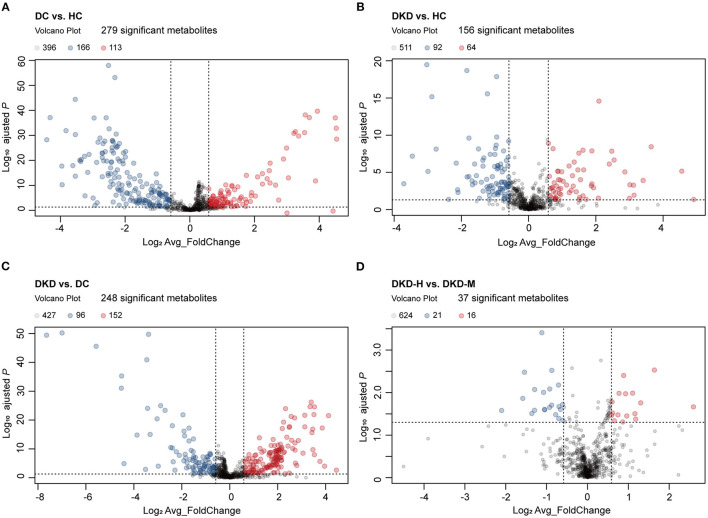
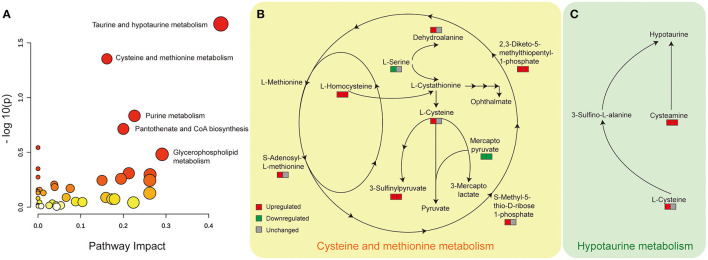
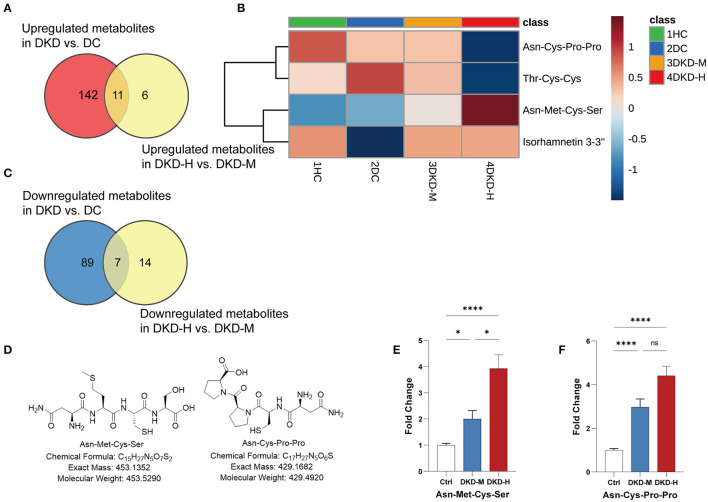
Results: Diabetes, and diabetic kidney disease with different ranges of proteinuria have shown different metabolites patterns. Cysteine and methionine metabolism pathway, and Taurine and hypotaurine metabolism pathway were distinguishable in the existence of DKD in DC (diabetes controls without kidney disease), and DKD with different ranges of proteinuria. Two interesting tetrapeptides (Asn-Met-Cys-Ser and Asn-Cys-Pro-Pro) circulating levels were elevated with the DKD proteinuria progression.
Conclusions: These findings underscore that serum metabolomics provide us biochemical perspectives to identify some clinically relevant physiopathologic biomarkers of DKD progression.
Keywords: biomarker discovery; diabetic kidney disease; metabolomics; progression; proteinuria.
Copyright © 2022 Peng, Wang, Shao, Wang, Feng, Wang, Ye, Chen and Jiang.
Conflict of interest statement
The authors declare that the research was conducted in the absence of any commercial or financial relationships that could be construed as a potential conflict of interest.
Figures
Similar articles
-
Clinical metabolomics characteristics of diabetic kidney disease: A meta-analysis of 1875 cases with diabetic kidney disease and 4503 controls.Diabetes Metab Res Rev. 2024 Mar;40(3):e3789. doi: 10.1002/dmrr.3789. Diabetes Metab Res Rev. 2024. PMID: 38501707
-
Diagnostic value of triglyceride and cystatin C ratio in diabetic kidney disease: a retrospective and prospective cohort study based on renal biopsy.BMC Nephrol. 2022 Jul 27;23(1):270. doi: 10.1186/s12882-022-02888-3. BMC Nephrol. 2022. PMID: 35896961 Free PMC article.
-
Impaired Amino Acid Metabolism and Its Correlation with Diabetic Kidney Disease Progression in Type 2 Diabetes Mellitus.Nutrients. 2022 Aug 15;14(16):3345. doi: 10.3390/nu14163345. Nutrients. 2022. PMID: 36014850 Free PMC article.
-
Harnessing Metabolomics to Describe the Pathophysiology Underlying Progression in Diabetic Kidney Disease.Curr Diab Rep. 2021 May 11;21(7):21. doi: 10.1007/s11892-021-01390-8. Curr Diab Rep. 2021. PMID: 33974145 Free PMC article. Review.
-
Metabolomics as a tool for the early diagnosis and prognosis of diabetic kidney disease.Med Res Rev. 2022 Jul;42(4):1518-1544. doi: 10.1002/med.21883. Epub 2022 Mar 10. Med Res Rev. 2022. PMID: 35274315 Review.
Cited by
-
α-Ketoglutarate alleviates osteoarthritis by inhibiting ferroptosis via the ETV4/SLC7A11/GPX4 signaling pathway.Cell Mol Biol Lett. 2024 Jun 14;29(1):88. doi: 10.1186/s11658-024-00605-6. Cell Mol Biol Lett. 2024. PMID: 38877424 Free PMC article.
-
Biomarker Profiling with Targeted Metabolomic Analysis of Plasma and Urine Samples in Patients with Type 2 Diabetes Mellitus and Early Diabetic Kidney Disease.J Clin Med. 2024 Aug 10;13(16):4703. doi: 10.3390/jcm13164703. J Clin Med. 2024. PMID: 39200845 Free PMC article.
-
Metabolomics for Clinical Biomarker Discovery and Therapeutic Target Identification.Molecules. 2024 May 8;29(10):2198. doi: 10.3390/molecules29102198. Molecules. 2024. PMID: 38792060 Free PMC article. Review.
-
Untargeted metabolomics reveals dynamic changes in metabolic profiles of rat supraspinatus tendon at three different time points after diabetes induction.Front Endocrinol (Lausanne). 2023 Nov 20;14:1292103. doi: 10.3389/fendo.2023.1292103. eCollection 2023. Front Endocrinol (Lausanne). 2023. PMID: 38053726 Free PMC article.
-
The effect of high-intensity interval training on type 2 diabetic muscle: A metabolomics-based study.Heliyon. 2024 Jul 20;10(15):e34917. doi: 10.1016/j.heliyon.2024.e34917. eCollection 2024 Aug 15. Heliyon. 2024. PMID: 39170342 Free PMC article.
References
LinkOut - more resources
Full Text Sources
Miscellaneous