. 2022 May 23;8(1):veac037.
doi: 10.1093/ve/veac037. eCollection 2022.

Timescales modulate optimal lysis-lysogeny decision switches and near-term phage reproduction

Affiliations

Timescales modulate optimal lysis-lysogeny decision switches and near-term phage reproduction

Shashwat Shivam et al. Virus Evol. .

Abstract

Temperate phage can initiate lysis or lysogeny after infecting a bacterial host. The genetic switch between lysis and lysogeny is mediated by phage regulatory genes as well as host and environmental factors. Recently, a new class of decision switches was identified in phage of the SPbeta group, mediated by the extracellular release of small, phage-encoded peptides termed arbitrium. Arbitrium peptides can be taken up by bacteria prior to infection, modulating the decision switch in the event of a subsequent phage infection. Increasing the concentration of arbitrium increases the chance that a phage infection will lead to lysogeny, rather than lysis. Although prior work has centered on the molecular mechanisms of arbitrium-induced switching, here we focus on how selective pressures impact the benefits of plasticity in switching responses. In this work, we examine the possible advantages of near-term adaptation of communication-based decision switches used by the SPbeta-like group. We combine a nonlinear population model with a control-theoretic approach to evaluate the relationship between a putative phage reaction norm (i.e. the probability of lysogeny as a function of arbitrium) and the extent of phage reproduction at a near-term time horizon. We measure phage reproduction in terms of a cellular-level metric previously shown to enable comparisons of near-term phage fitness across a continuum from lysis to latency. We show the adaptive potential of communication-based lysis-lysogeny responses and find that optimal switching between lysis and lysogeny increases the near-term phage reproduction compared to fixed responses, further supporting both molecular- and model-based analyses of the putative benefits of this class of decision switches. We further find that plastic responses are robust to the inclusion of cellular-level stochasticity, variation in life history traits, and variation in resource availability. These findings provide further support to explore the long-term evolution of plastic decision systems mediated by extracellular decision-signaling molecules and the feedback between phage reaction norms and ecological context.

Keywords: control theory; evolution; mathematical modeling; viral ecology.


Figures

Figure 1.
Figure 1.
Schematic of the model. (A) We consider a batch culture of susceptible bacteria, S, infected by free temperate phage, V, given limited resources, R. Early in the infection, exposed bacteria, E, sense the concentration of arbitrium quorum sensing molecule, A (in green), from the environment, and a decision between lysis and lysogeny is made based on the optimal probability function P(A). Lytic infections (in purple), I, result in the destruction of the infected bacteria and the release of a burst of new phage to the environment. Lysogenic infections (in yellow) result in the internalization of the phage in the bacterial chromosome, and the resulting lysogen, L, continues its replication cycle. Both infection pathways produce and release arbitrium molecules into the environment. (B.1) We use final population sizes of infected cells (L + E) at a given time horizon, tf, to (B.2) optimize the function of probability of lysogeny, by finding the optimal arbitrium switching point, A0, and shaping parameter, k, that maximizes cell-centric metric of phage reproduction at the given tf.
Figure 2.
Figure 2.
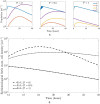
Temperate phage–bacterial infection dynamics for different fixed probabilities of lysogeny (P = 0, P = 0.5, or P = 1 where P is the probability of lysogeny) for 48 h with an MOI of 0.01. The model parameters are given in Table A1. (A) Population dynamics for the system when a fixed strategy is employed over a period of 48 h. The three panels correspond to an obligately lytic (P = 0, left panel), stochastic (P = 0.5, middle panel), and purely lysogenic (P = 1, right panel) strategy, respectively. (B) Comparison of total birth states, i.e. aggregate population of lysogens and exposed cells, for the three fixed strategies. The optimal fixed strategies with highest birth states population vary with time. Specifically, obligately lytic strategy is favored for relative short timescales (from 12 to 36 h). Beyond this, the mixed strategy (P = 0.5) is favored.
Figure 3.
Figure 3.
Comparison of the optimal lysis–lysogeny decision response functions (function of arbitrium molecule concentration) given variations in time horizon (from 12 to 48 h). The switching point (from lysis to lysogeny, i.e. from P = 0 to P = 1) in the sigmoidal lysis–lysogeny response function shifts to the right as the horizon increases. (A) Production rate of arbitrium molecules used is formula image as given in Table A1. (B) A lower production rate of formula image is used in this case, which results in a corresponding shift of optimal strategies to lower concentrations.
Figure 4.
Figure 4.
Temperate phage–bacterial infection dynamics for an optimal switching strategy in the lysis–lysogeny decision as a function of the final time horizon. Consecutive panels show an optimal strategy dynamics resulting from the optimal response functions to arbitrium quorum sensing concentration represented in Fig. 3 given a time horizon (12, 18, 24, 36, and 48 h, respectively). We see a common strategy of pure lysis followed by a stochastic strategy in all cases. The time of the switch from obligate lysis to a stochastic strategy can be deduced by the time at which the production of lysogens start. The switch occurs based on the length of the time horizon, with a later switch for longer horizons. The initial MOI is set as 0.01; the additional model parameters are given in Table A1.
Figure 5.
Figure 5.
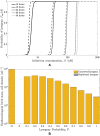
Cell-centric metric of phage reproduction for optimal and fixed probabilities of lysogeny. The relevant parameters are presented in Table A1. Note that the optimal strategy is a response function of arbitrium molecule concentration. The initial MOI is set as 0.01; the additional model parameters are given in Table A1. (A) Comparison between birth states produced from multiple fixed and optimal probability strategies for a time horizon of 48 h with an MOI of 0.01. The cell densities of the converted lysogens, replicated lysogens, and exposed cells are stacked, with the bar representing converted lysogens at the bottom and the bar representing exposed cells at the top. Here, we consider ten alternative fixed probability strategies for lysis–lysogeny i.e. not reliant on arbitrium molecule concentration. We simulate with probabilities from 0 to 1 with increments of 0.1 and compare the performance of all these strategies to the optimal strategy which utilizes the arbitrium system. The comparison shows that the total birth states produced by the optimal strategy is higher than all fixed strategies. (B) The final time birth states population vary with time horizon (from 12 to 48 h) and strategies (optimal, pure lysis, pure lysogeny, and stochastic). The comparison is made for all time horizons from 12 to 48 h, but only three fixed strategies are considered for clarity. The birth states formed by following the optimal strategy are greater than these fixed strategies for all time horizons.
Figure 6.
Figure 6.
Effect of resource level (change in initial concentration and influx) on optimal lysis–lysogeny switching point. The simulation parameters are indicated in Table A1. (A) Heatmaps for time horizons from 12 to 48 h and variation in the initial resource concentration, from 40 formula image (which is the base case concentration used in all previous plots) to 100 formula image. (B) Heatmaps for time horizons from 12 to 48 h and variation in resource influx, from 0 formula image (which is the base case concentration used in all previous plots) to 3 formula image. In both subfigures, the three panels correspond to the optimal switching point (left panel), fraction of lysogens to infected cells at the final time (middle panel), and growth rate (right panel).
Figure A1.
Figure A1.
Effect of production rate of arbitrium—formula image, on optimal switching concentration for a time horizon of 24 h. The production rate is varied from 105 to formula image with exponential steps of 100.5. For each arbitrium production rate, we compute the corresponding optimal switching concentration. The relationship between the optimal switching concentration and arbitrium production rate is linear (correlation coefficient = 1).
Figure A2.
Figure A2.
Epidemiological birth state population composition for different time horizons (from 12 to 48 h) when optimal switching strategy is used. (A) Fraction of lysogens and exposed cells at the final time. This shows the relative contribution of the exposed and lysogenic cells to the fitness measure used. (B) Cell density of lysogens and exposed cells at the final time. The cell densities of the converted lysogens, replicated lysogens, and exposed cells are stacked, with the bar representing converted lysogens at the bottom and the bar representing exposed cells at the top. The bar graph also explicitly shows the lysogens created due to conversion and replication. In all cases, the converted lysogens are the dominant part of the birth states.
Figure A3.
Figure A3.
Effect of considering only lysogens as epidemiological birth states. (A) Optimal switching point for time horizons (12 to 48 h) with different objectives. The solid lines represent the optimal probability functions when the objective is maximizing both lysogens and exposed cells at the final time, i.e. formula image. The dashed lines represent the optimal functions when the objective is maximizing only the lysogens at the final time, i.e. formula image. The solid and dashed lines of the same color represent optimal probability functions for the same time horizon. The optimal probability functions are very similar with a slightly faster switch to lysogeny. This increases the lysogen count at the cost of reducing exposed cells, which is immaterial for the new optimization problem. (B) Cell density of epidemiological birth state at final time for formula image h, with the bar representing replicated lysogens stacked on top of the bar for converted lysogens. Similar to Fig. 5, we consider ten alternative fixed probability strategies (formula image) and compare total birth states. Here, only lysogens are considered as birth states, with the majority being converted lysogens. The optimal strategy is more than four times better than the highest value achieved for a fixed strategy (for P = 0.2), demonstrating the higher near-term reproduction compared to a fixed strategy.
Figure A4.
Figure A4.
Robustness analysis of optimal switching point for different virion decay rates, dV, burst size, β, and adsorption rate, ϕ, with the time horizon varying from 12 to 48 h. (A) shows the effect of variation in dV from 0.025 to formula image, with formula image being the nominal value used in previous plots. (B) shows the effect of variation in β from 25 to 75, with the nominal value being 50. (C) shows the effect of variation in ϕ from formula image ml/h to formula image ml/h, with the nominal value being formula image. In all three subfigures, the first panel (left) shows the actual time at which the switch from lysis to lysogeny occurs, the second panel (middle) shows the switching point in terms of the arbitrium concentration, and the third panel (right) shows the cell density of the epidemiological birth states. The switching time is not robust to changes in the decay rate, burst size, or adsorption rate; however, certain trends remain consistent. Increasing the burst size or the adsorption rate or decreasing the decay rate of virions improves the effectiveness of the viral particles. To prevent host depletion, the switching time is observed to slightly decrease (left panel). Increased effectiveness of the viral particles results in an increase in the epidemiological birth states produced by the final time, as seen in the right panels. The increased population of lysogens increase the concentration of arbitrium in the medium. As the switching time decreases with an increase in virion effectiveness, the switching concentration must increase (due to the increased arbitrium production by the higher lysogen cell density), as seen in the middle panels. While the switching concentration is strongly dependent on these parameters, the switching time changes less due to variations in dV, β, and ϕ. For variation in decay rates, only slight variation is observed when comparing values for long time horizons. The effect of changes to the burst size and adsorption rate are more pronounced, but limited to long time horizons.
Figure A5.
Figure A5.
Effect of resource level (change in initial concentration and influx) on fraction of susceptible cells at the optimal switching point. The simulation parameters are present in Table A1. The first panel corresponds to a heatmap for time horizons from 12 to 48 h and variation in initial resource concentration, from 40 formula image (which is the base case concentration used in all previous plots) to 100 formula image. The second panel is a heatmap for time horizons from 12 to 48 h and variation in resource influx, from 0 formula image (which is the base case concentration used in all previous plots) to 3 formula image. An increase in resource concentration in the system (either through increase in initial resource concentration or resource influx) leads to a lower susceptible fraction at the switching point. This translates to a longer period of lysis (which would reduce the population fraction of susceptible cells in the system) followed by a switch to lysogeny. A longer time horizon results in a lower susceptible fraction at the switching point. Both observations are consistent with previous results, where a higher resource concentration or time horizon meant an increase in the arbitrium switching concentration, that is, a longer period of lysis.

References

    1. Abedon S. T. (2015) ‘Bacteriophage Secondary Infection’, Virologica Sinica, 30: 3–10.doi: 10.1007/s12250-014-3547-2 - DOI - PMC - PubMed
    1. Aframian N. et al. (2022) ‘Dormant Phages Communicate via Arbitrium to Control Exit from Lysogeny’, Nature Microbiology, 7: 145–53. - PubMed
    1. Armijo L. (1966) ‘Minimization of Functions having Lipschitz Continuous First Partial Derivatives’, Pacific Journal of Mathematics, 16: 1–3. doi: 10.2140/pjm.1966.16.1 - DOI
    1. Avlund M. et al. (2009) ‘Why do Phage Play Dice?’ Journal of virology, 86: 2898.doi: 10.1128/JVI.01057-09 - DOI - PMC - PubMed
    1. Bernard C. et al. (2021) ‘Beyond Arbitrium: Identification of a Second Communication System in Bacillus Phage phi3T That May Regulate Host Defense Mechanisms’, ISME J, 15: 545–9. - PMC - PubMed