. 2022 May 9:13:878387.
doi: 10.3389/fmicb.2022.878387. eCollection 2022.

Investigating Abiotic and Biotic Mechanisms of Pyrite Reduction

Affiliations

Investigating Abiotic and Biotic Mechanisms of Pyrite Reduction

Rachel L Spietz et al. Front Microbiol. .

Abstract

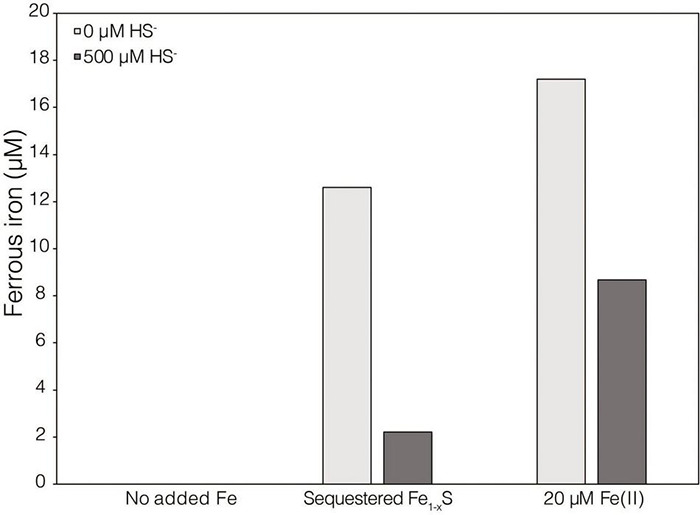
Pyrite (FeS2) has a very low solubility and therefore has historically been considered a sink for iron (Fe) and sulfur (S) and unavailable to biology in the absence of oxygen and oxidative weathering. Anaerobic methanogens were recently shown to reduce FeS2 and assimilate Fe and S reduction products to meet nutrient demands. However, the mechanism of FeS2 mineral reduction and the forms of Fe and S assimilated by methanogens remained unclear. Thermodynamic calculations described herein indicate that H2 at aqueous concentrations as low as 10-10 M favors the reduction of FeS2, with sulfide (HS-) and pyrrhotite (Fe1- x S) as products; abiotic laboratory experiments confirmed the reduction of FeS2 with dissolved H2 concentrations greater than 1.98 × 10⁻⁴ M H2. Growth studies of Methanosarcina barkeri provided with FeS2 as the sole source of Fe and S resulted in H2 production but at concentrations too low to drive abiotic FeS2 reduction, based on abiotic laboratory experimental data. A strain of M. barkeri with deletions in all [NiFe]-hydrogenases maintained the ability to reduce FeS2 during growth, providing further evidence that extracellular electron transport (EET) to FeS2 does not involve H2 or [NiFe]-hydrogenases. Physical contact between cells and FeS2 was required for mineral reduction but was not required to obtain Fe and S from dissolution products. The addition of a synthetic electron shuttle, anthraquinone-2,6-disulfonate, allowed for biological reduction of FeS2 when physical contact between cells and FeS2 was prohibited, indicating that exogenous electron shuttles can mediate FeS2 reduction. Transcriptomics experiments revealed upregulation of several cytoplasmic oxidoreductases during growth of M. barkeri on FeS2, which may indicate involvement in provisioning low potential electrons for EET to FeS2. Collectively, the data presented herein indicate that reduction of insoluble FeS2 by M. barkeri occurred via electron transfer from the cell surface to the mineral surface resulting in the generation of soluble HS- and mineral-associated Fe1- x S. Solubilized Fe(II), but not HS-, from mineral-associated Fe1- x S reacts with aqueous HS- yielding aqueous iron sulfur clusters (FeS aq ) that likely serve as the Fe and S source for methanogen growth and activity. FeS aq nucleation and subsequent precipitation on the surface of cells may result in accelerated EET to FeS2, resulting in positive feedback between cell activity and FeS2 reduction.

Keywords: dissolution; extracellular electron transfer; hydrogen; methanogens; pyrite (FeS2); pyrrhotite (Fe1–xS).


Conflict of interest statement

The authors declare that the research was conducted in the absence of any commercial or financial relationships that could be construed as a potential conflict of interest.

Figures

FIGURE 1
FIGURE 1
Gibb’s free energy calculated for abiotic pyrite (FeS2) reduction to pyrrhotite (Fe1–xS) and HS by H2 at 38°C, an ionic strength of 0.05 M, and at a pH of 7.0. The vertical dashed line depicts the minimum H2 concentration that abiotic FeS2 reduction was detected experimentally (see Figure 2).
FIGURE 2
FIGURE 2
Production of total sulfide (aqueous plus gas phase) in reactors containing 2 mM synthetic FeS2 nanoparticles when incubated at 38°C in the presence of H2 ranging from 0 to 1.98 × 10– 3 M aqueous H2 (equivalent to 0 to 2.5 bar). All abiotic reactors contained 35 mL of base salts medium and 35 mL of headspace (balance of headspace as N2 gas).
FIGURE 3
FIGURE 3
Dissolved ferrous iron [Fe(II)] concentration in abiotic dialysis experiment reactors following 7 days of incubation at 38°C. One hundred sixty-five milliliters serum bottles containing base salts medium were provided with no Fe (No added Fe), 0.1 g of specimen pyrrhotite sequestered in 50 kDa dialysis tubing (Sequestered Fe1–xS), or 20 μM FeCl2. Reactors were either provided with no sulfur source (0 μM HS) or 500 μM Na2S (500 μM HS). Following incubation, subsamples were collected under anoxic conditions and were leached with 1N HCl at 4°C for 16 h before quantifying Fe(II).
FIGURE 4
FIGURE 4
Production of (A) total CH4, (B) dissolved H2, (C) total sulfide (aqueous plus gas phase), and (D) total biomass (DNA) by Methanosarcina barkeri strain Fusaro during growth with 2 mM synthetic pyrite (FeS2) nanoparticles, 20 μM ferrous iron [Fe(II)] and 2 mM HS, or no added Fe or S source (No Fe/S). The H2 concentration is reported for the dissolved phase. Averages and standard deviations for triplicates are shown. Protein data as an additional proxy for growth is presented in Supplementary Figure 3. Data depicting growth kinetics and activities of M. barkeri strain MS with FeS2 are presented in Supplementary Figure 4.
FIGURE 5
FIGURE 5
Production of (A) methane (CH4), (B) total sulfide (aqueous plus gas phase), and (C) total biomass (DNA) in cultures of Methanosarcina barkeri Fusaro with deletions in each of the four operons encoding all five [NiFe]-hydrogenases in its genome. The M. barkeri Fusaro hydrogenase mutant was grown either with no provided iron (Fe) or sulfur (S) source (No Fe/S); with 20 μM ferrous iron [Fe(II)] and 0.4 mM sulfide (HS) [Fe(II)/HS]; or with 2 mM synthetic pyrite (FeS2) nanoparticles as the sole sources of Fe and S. Hydrogen (H2) was not detected (detection limit 0.1 μM) in the headspace of any of the culture conditions tested (data not shown). Averages and standard deviations for triplicates are shown.
FIGURE 6
FIGURE 6
Production of (A) total methane (CH4), (B) total sulfide (aqueous plus gas phase), (C) total biomass (DNA), and (D) reduced anthrahydroquinone-2,6-disulfonate (AH2QDS) from anthraquinone-2,6-disulfonate (AQDS) by Methanosarcina barkeri strain Fusaro when grown with pyrite (FeS2) free in solution (green) or sequestered in 100 kDa dialysis tubing (orange) to prevent physical association. Negative control cultures contained no added Fe or S source (red), while positive control cultures were provided with 20 μM Fe(II) and 2 mM HS (red; same data as presented in Figure 2). AQDS was provided at a final concentration of 20 mM. In (A–C), culture conditions with added AQDS are represented by dashed lines and culture conditions that do not contain AQDS are shown by solid lines. Only conditions provided AQDS are shown panel d, and absorbance at 325 nm (AQDS) is depicted by solid lines while absorbance at 450 nm (AH2QDS) depicted by long-dashed lines. Averages and standard deviations for triplicates are shown. Protein data as an additional proxy for growth is presented in Supplementary Figure 3.
FIGURE 7
FIGURE 7
Production of (A) total CH4 and (B) total biomass (DNA) of M. barkeri Fusaro wild-type grown with no added Fe (No added Fe), with 0.1 g specimen pyrrhotite (Fe1–xS; 63–125 μm size fraction) sequestered in 100 kDa dialysis tubing (Sequestered Fe1–xS), or with 20 μM FeCl2. For each of these conditions, no sulfide (0 μM HS) or 500 μM sulfide (500 μM HS) was added as Na2S. The data represent the difference for each analyte between the initial measurement (day 0) and the final measurement (day 10). Averages and standard deviations for triplicates are shown. Sampling was infrequent to minimize potential damage to dialysis membranes from sharp, freshly fractured, Fe1–xS grains and their edges.
FIGURE 8
FIGURE 8
(A) Methanosarcina barkeri MS gene transcripts that were significantly upregulated in cells provided with synthetic pyrite (FeS2) nanoparticles compared to those provided with ferrous iron [Fe(II)]/cysteine (Cys) and those provided with Fe(II)/sulfide (HS) as the sole iron and sulfur source. The log fold change (LFC) of transcript abundance in FeS2- versus Fe(II)/HS-grown cells (y-axis) is plotted as a function of the LFC of transcript abundance in FeS2- versus Fe(II)/Cys-grown cells (x-axis). Each point represents a single gene and the size of the point represents the relative mean normalized transcript abundance detected across FeS2 replicate cultures. (B) A cassette of genes whose expression (transcripts) were upregulated when Methanosarcina barkeri MS cells were provided with synthetic FeS2 nanoparticles when compared to cells provided with 20 μM ferrous iron [Fe(II)] and 2 mM Cys or 20 μM ferrous iron [Fe(II)] and 2 mM HS as sole sources of Fe and S. Truncated locus tags and annotations of gene functions as assessed by UniProt are provided (“MSBRM_” has been removed due to space limitations). Gene arrows colored blue represent significant differential expression in M. barkeri MS cells grown on FeS2 compared to cells grown with Fe(II)/Cys or Fe(II)/HS (p < 0.05, LFC > 0.5). The green gene arrows were significantly upregulated (p < 0.05) in the FeS2 growth condition relative to both the Fe(II)/Cys or Fe(II)/HS growth conditions but the LFC was below 0.5. The gene depicted in yellow was upregulated on the FeS2 growth condition relative to both the Fe(II)/Cys or Fe(II)/HS growth conditions but not significantly (p > 0.05). The gene depicted in white was not differentially regulated among growth conditions. Importantly, an analysis of proteomes of Methanococcus voltae A3 cells provided with 2 mM FeS2 or 26 μM Fe(II) and 2 mM HS independently identified homologs of many of the same proteins as being up-expressed under the FeS2 condition (Payne et al., 2021a), and these are indicated with an asterisk (*). Gene abbreviations: Fld, flavodoxin; AKR, aldo/keto reductase; Fdx, ferrodoxin; mABH, membrane-associated alpha/beta hydrolase; FeoAB, ferrous iron transporter subunits (A,B).
FIGURE 9
FIGURE 9
A model for Methanosarcina barkeri growth on pyrite (FeS2). See main text for description.

References

    1. Anders S., Pyl P. T., Huber W. (2015). HTSeq–a Python framework to work with high-throughput sequencing data. Bioinformatics 31 166–169. 10.1093/bioinformatics/btu638 - DOI - PMC - PubMed
    1. Bapteste E., Brocheir C., Boucher Y. (2005). Higher-level classification of the archaea: evolution of methanogenesis and methanogens. Archaea 1 353–363. 10.1155/2005/859728 - DOI - PMC - PubMed
    1. Beifuss U., Tietze M. (2005). “Methanophenazine and other natural biologically active phenazines,” in Natural Products Synthesis II. Topics in Current Chemistry, ed. Mulzer J. (Berlin: Springer; ), 77–113. 10.1007/b96889 - DOI
    1. Benning L. G., Wilkin R. T., Barnes H. L. (2000). Reaction pathways in the Fe-S system below 100°C. Chem. Geol. 167 25–51. 10.1016/s0009-2541(99)00198-9 - DOI
    1. Berner R. A. (1967). Thermodynamic stability of sedimentary iron sulfides. Am. J. Sci. 265 773–785. 10.2475/ajs.265.9.773 - DOI