

Changes and correlates of screen time in adults and children during the COVID-19 pandemic: A systematic review and meta-analysis
- PMID: 35615691
- PMCID: PMC9122783
- DOI: 10.1016/j.eclinm.2022.101452
Changes and correlates of screen time in adults and children during the COVID-19 pandemic: A systematic review and meta-analysis
Abstract
Background: Screen time has increased as a result of the COVID-19 pandemic, and several correlates have been associated with these increases. These changes, however, have not been aggregated. It was the aim of this review to (a) aggregate changes in screen time in adults and children, and (b) report on variables in relation to screen time during the COVID-19 pandemic.
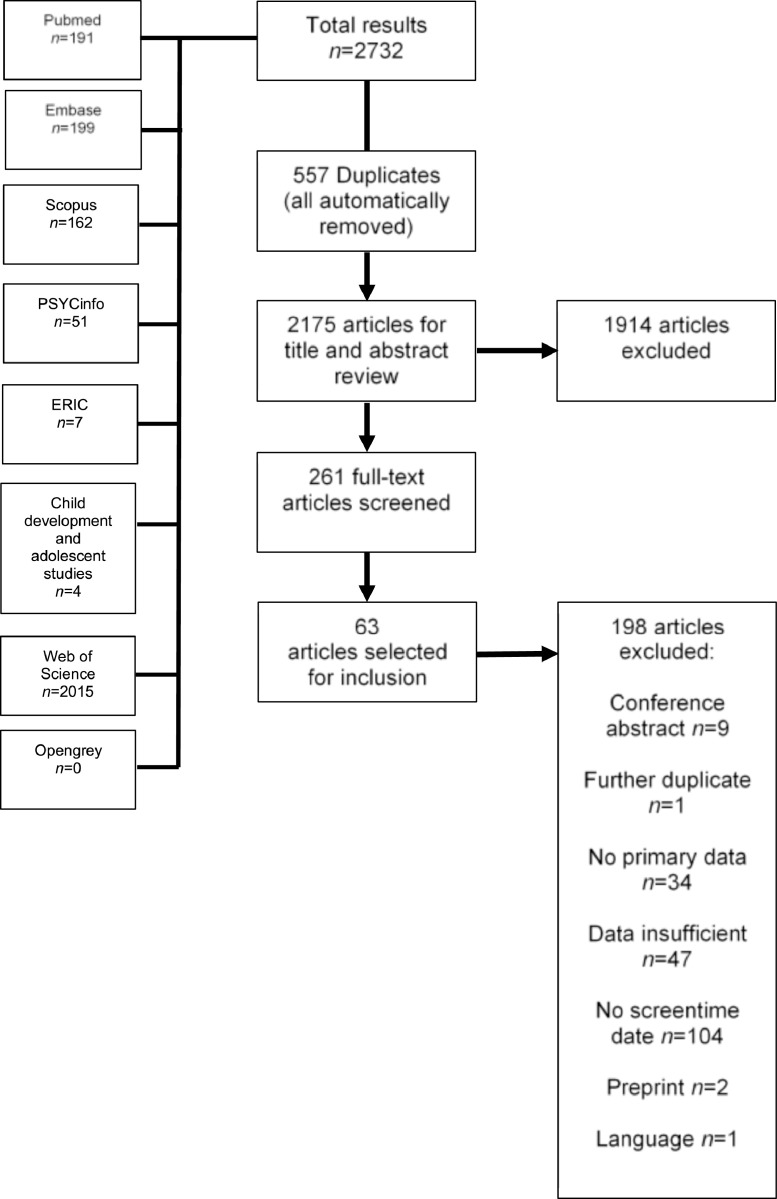
Methods: A systematic review of major databases was undertaken for studies published from inception to 06/12/2021, using a pre-published protocol (PROSPERO ID: CRD42021261422). Studies reporting (a) screen time pre-versus-during the pandemic, (b) screen time percentage change, or (c) correlates of screen time during the pandemic were included. A random effects meta-analysis was undertaken with subgroup analysis by age group and type of screen time.
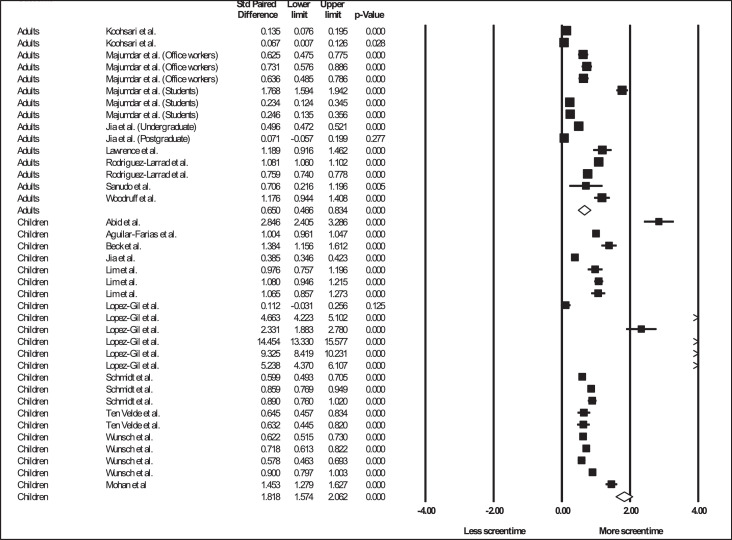
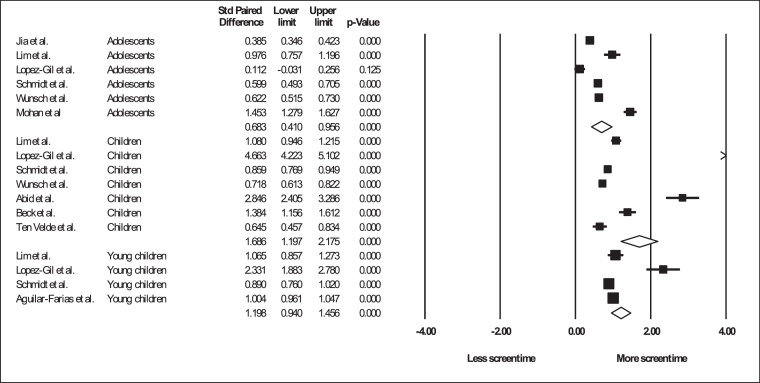
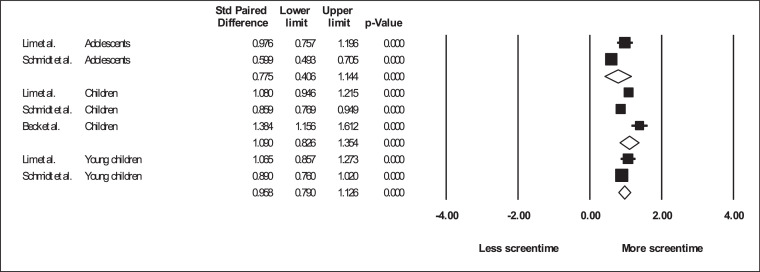
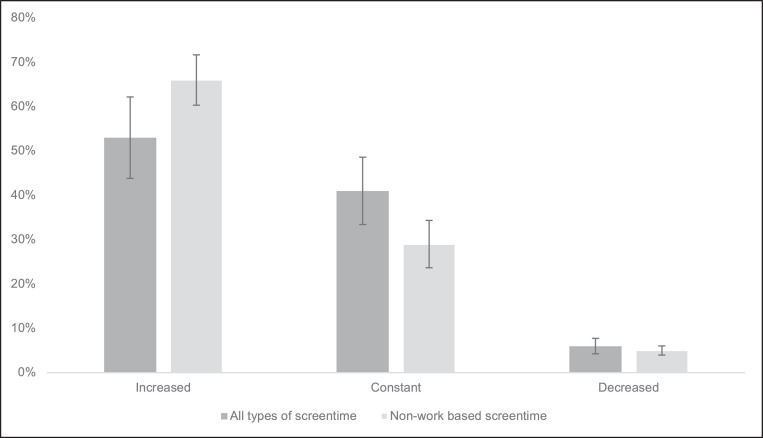
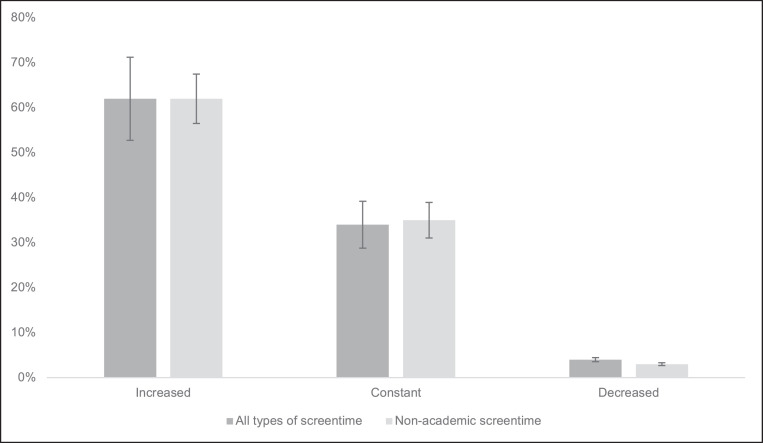
Findings: After review, 89 studies (n = 204,734; median age=20·6; median female=53·3%) were included. The majority of studies were cross-sectional. With regards to total screen time, primary aged children (6-10 years) reported largest increases (1·4 hrs/day; 95%CI 1·1-1·7), followed by adults (>18 years; 1·0 hrs/day; 95%CI 0·7-1·2), adolescents (11-17 years; 0·9 hrs/day; 95%CI 0·3-1·5), and young children (0-5 years; 0·6 hrs/day 95%CI 0·3-0·9 hrs/day). For leisure screen time (non-work/non-academic), primary aged children reported largest increases (1·0 hrs/day 95%CI 0·8-1·3), followed by adults (0·7hr/day 95%CI 0·3-1·2), young children (0·6 hrs/day; 95%CI 0·4-0·8), with adolescents reporting the lowest increase (0·5 hrs/day 95%CI 0·3-0·7). Several correlates were associated with reported increases in screen time, including adverse dietary behaviours, sleep, mental health, parental health, and eye health.
Interpretation: Pooled evidence suggest that primary aged children reported the highest increase in both total and leisure screen time during COVID-19. It is recommended that screen time should be reduced in favour of non-sedentary activities. This study has the potential to inform public health policy and future guidance regarding screen time, and to inform future research in this area.
Funding: No funding was received for this study.
Keywords: Adults; Children; Covid-19; Review; Screentime.
© 2022 The Author(s).
Conflict of interest statement
None to report.
Figures
References
-
- World Health Organization. WHO Coronovirus Didease (COVID-19) Dashboard. Accessed July 2, 2020. https://covid19.who.int
-
- British Broadcasting Corporation. Coronavirus: the world in lockdown in maps and charts. Published 2020. Accessed August 12, 2020. https://www.bbc.co.uk/news/world-52103747
LinkOut - more resources
Full Text Sources
