. 2022 Jun 28;16(6):8729-8750.
doi: 10.1021/acsnano.1c07492. Epub 2022 May 26.

Systemic Delivery of an Adjuvant CXCR4-CXCL12 Signaling Inhibitor Encapsulated in Synthetic Protein Nanoparticles for Glioma Immunotherapy

Affiliations

Systemic Delivery of an Adjuvant CXCR4-CXCL12 Signaling Inhibitor Encapsulated in Synthetic Protein Nanoparticles for Glioma Immunotherapy

Mahmoud S Alghamri et al. ACS Nano. .

Abstract

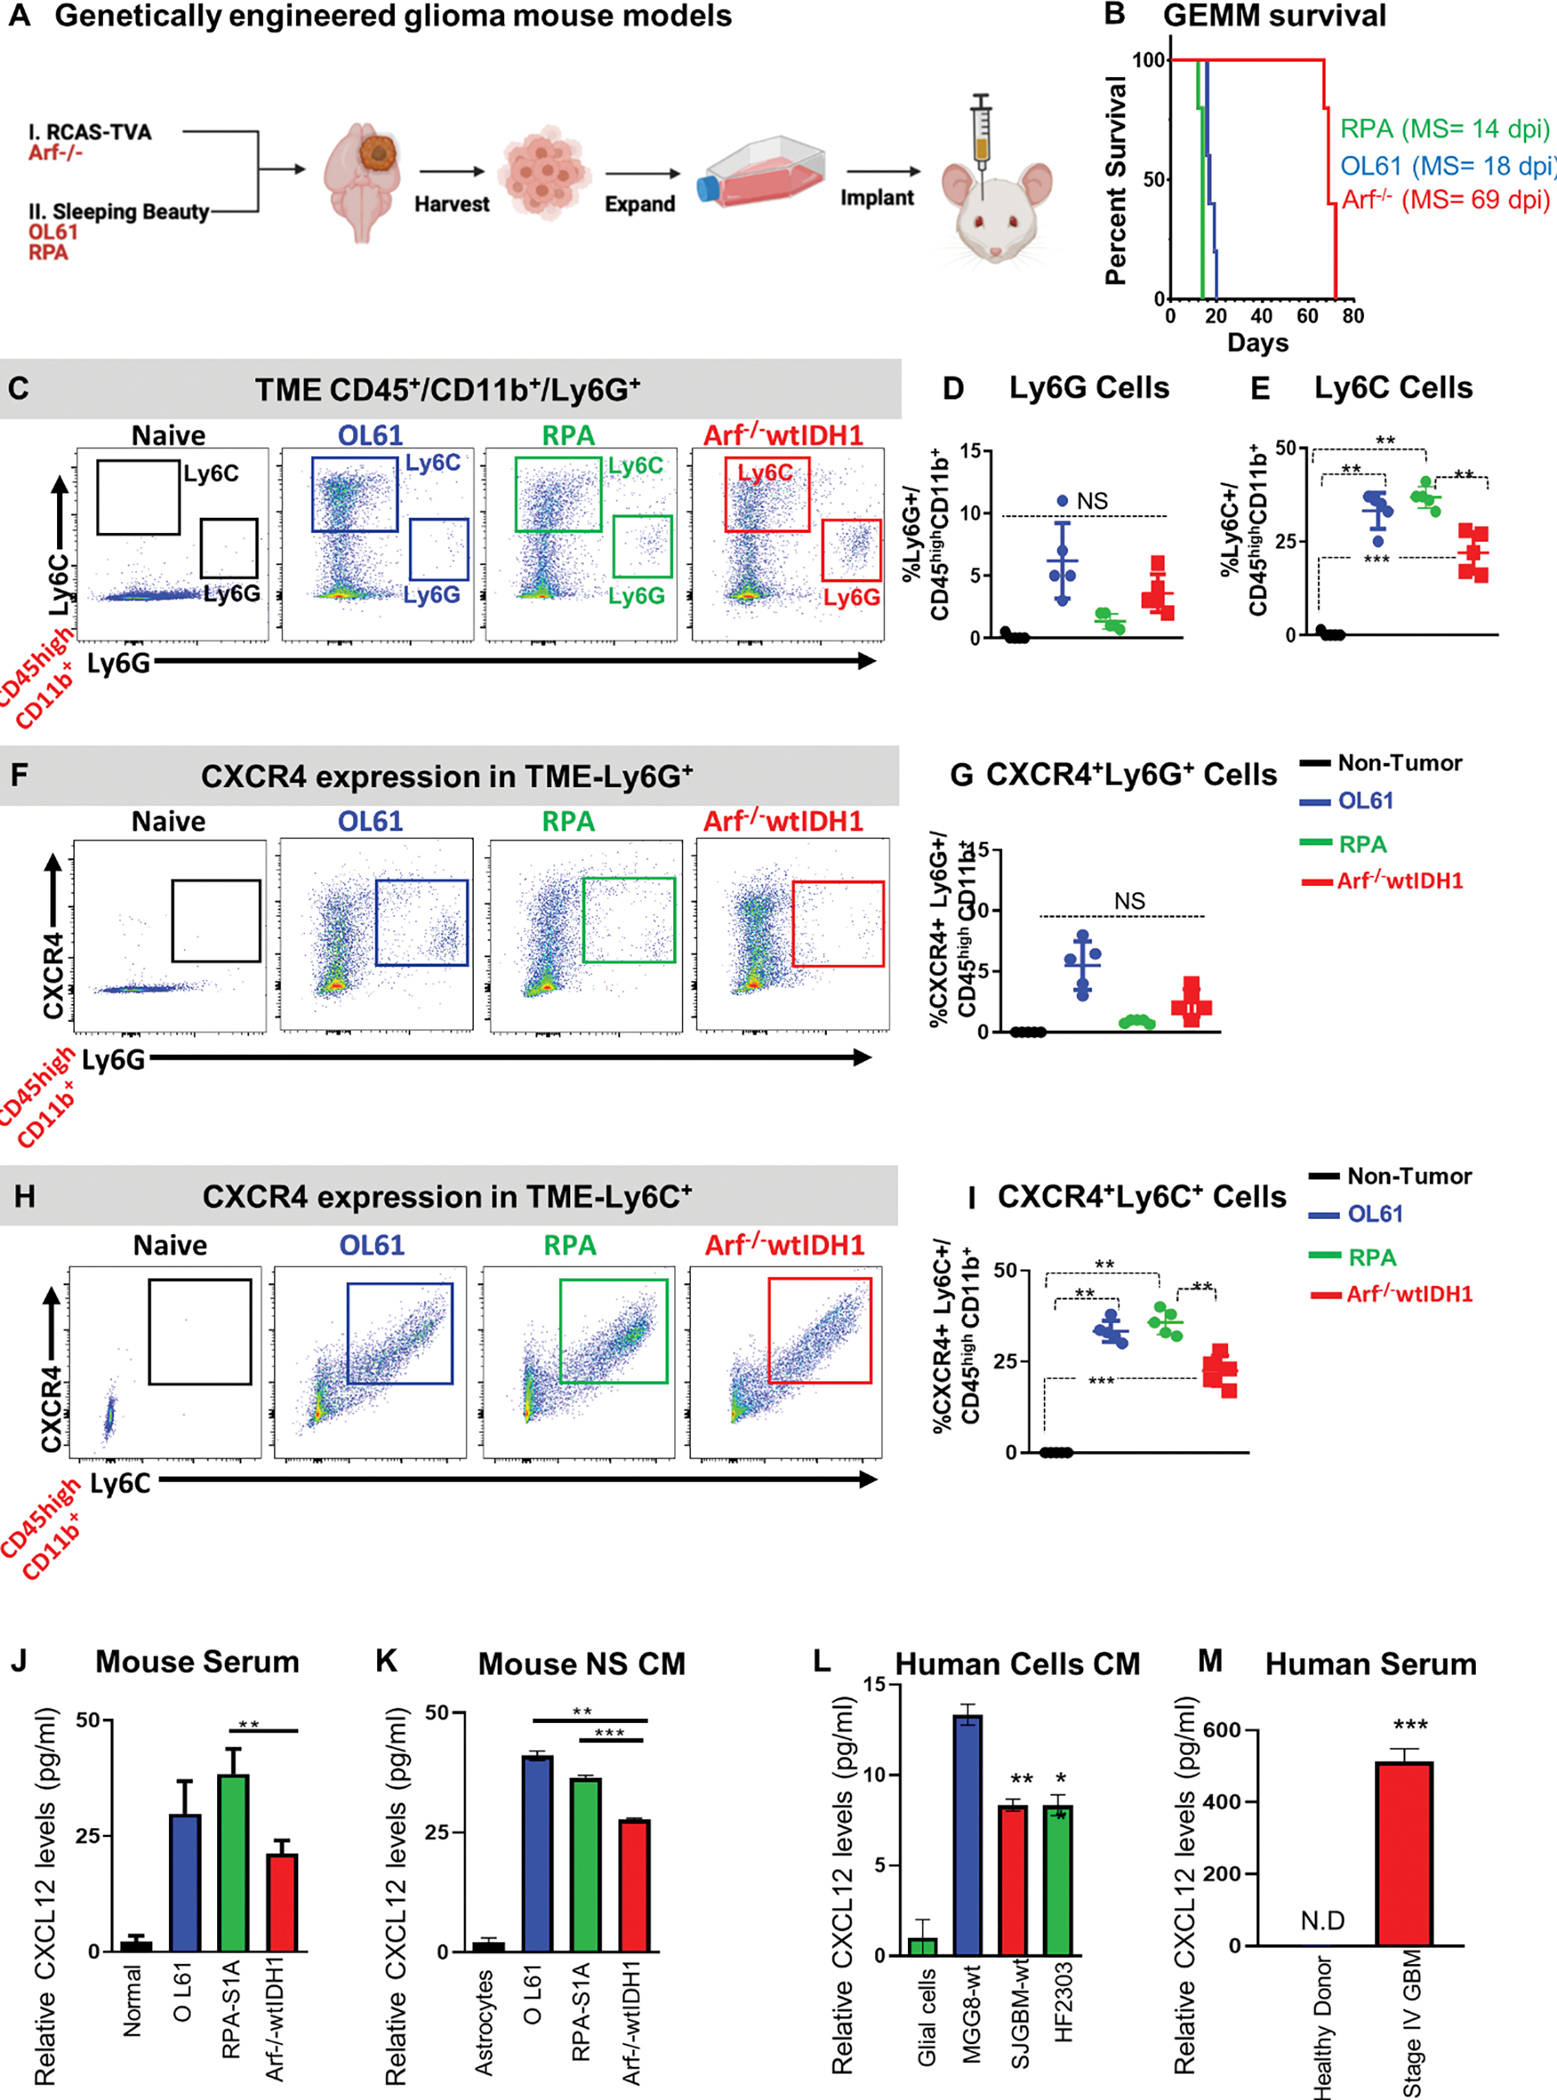
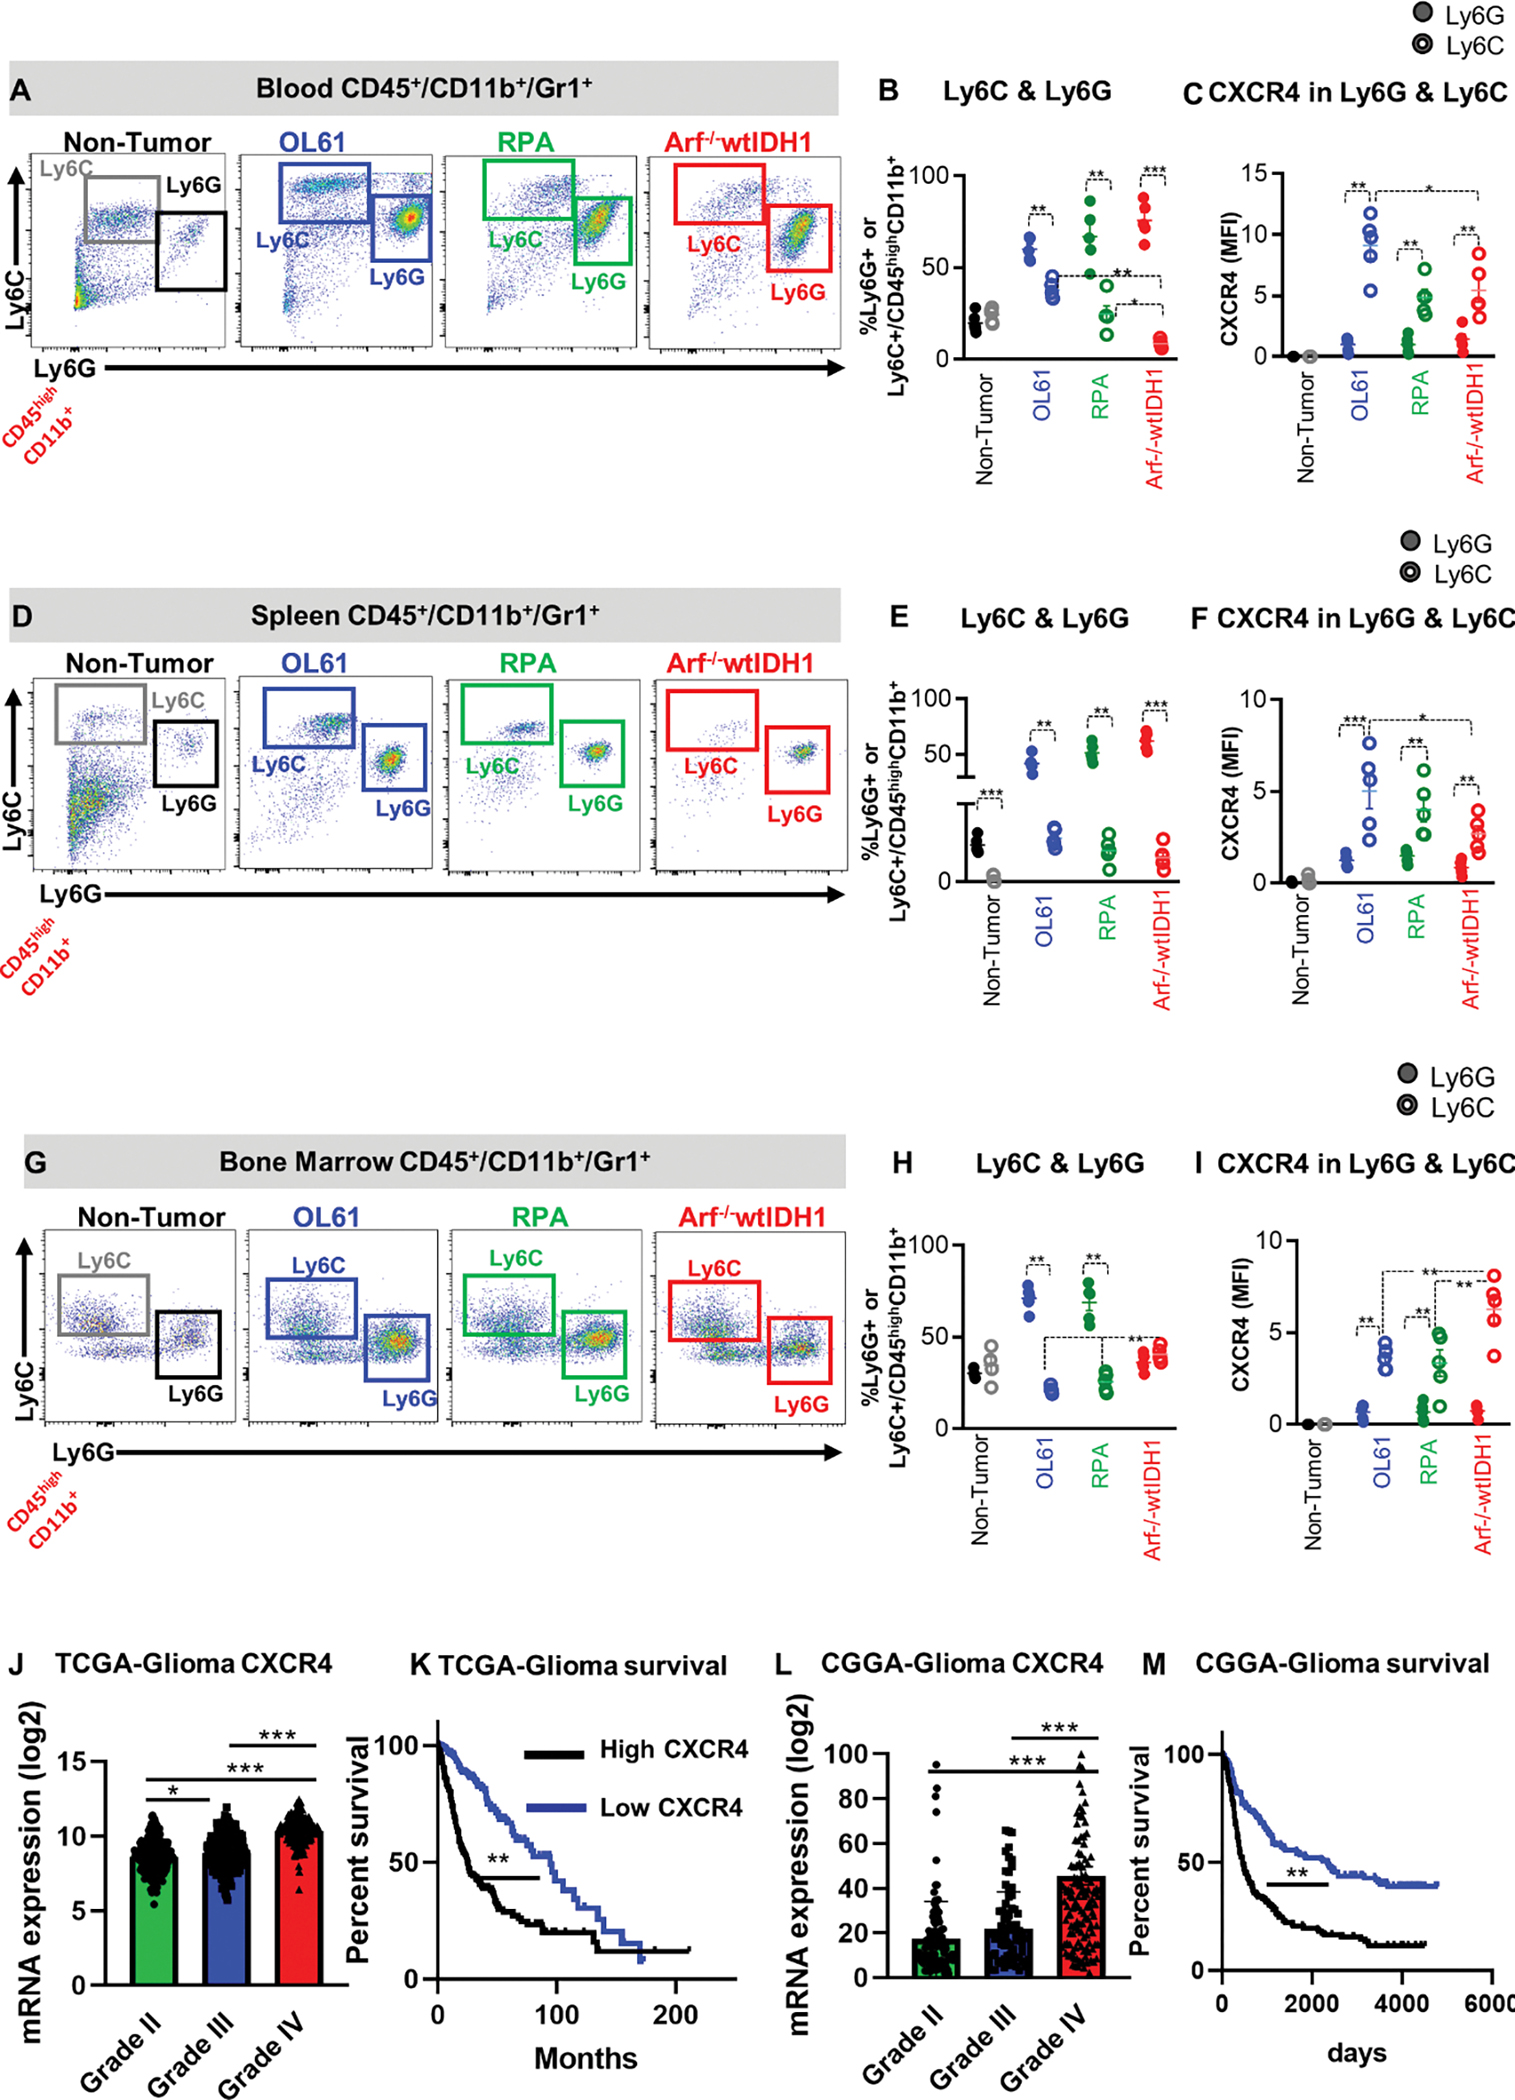
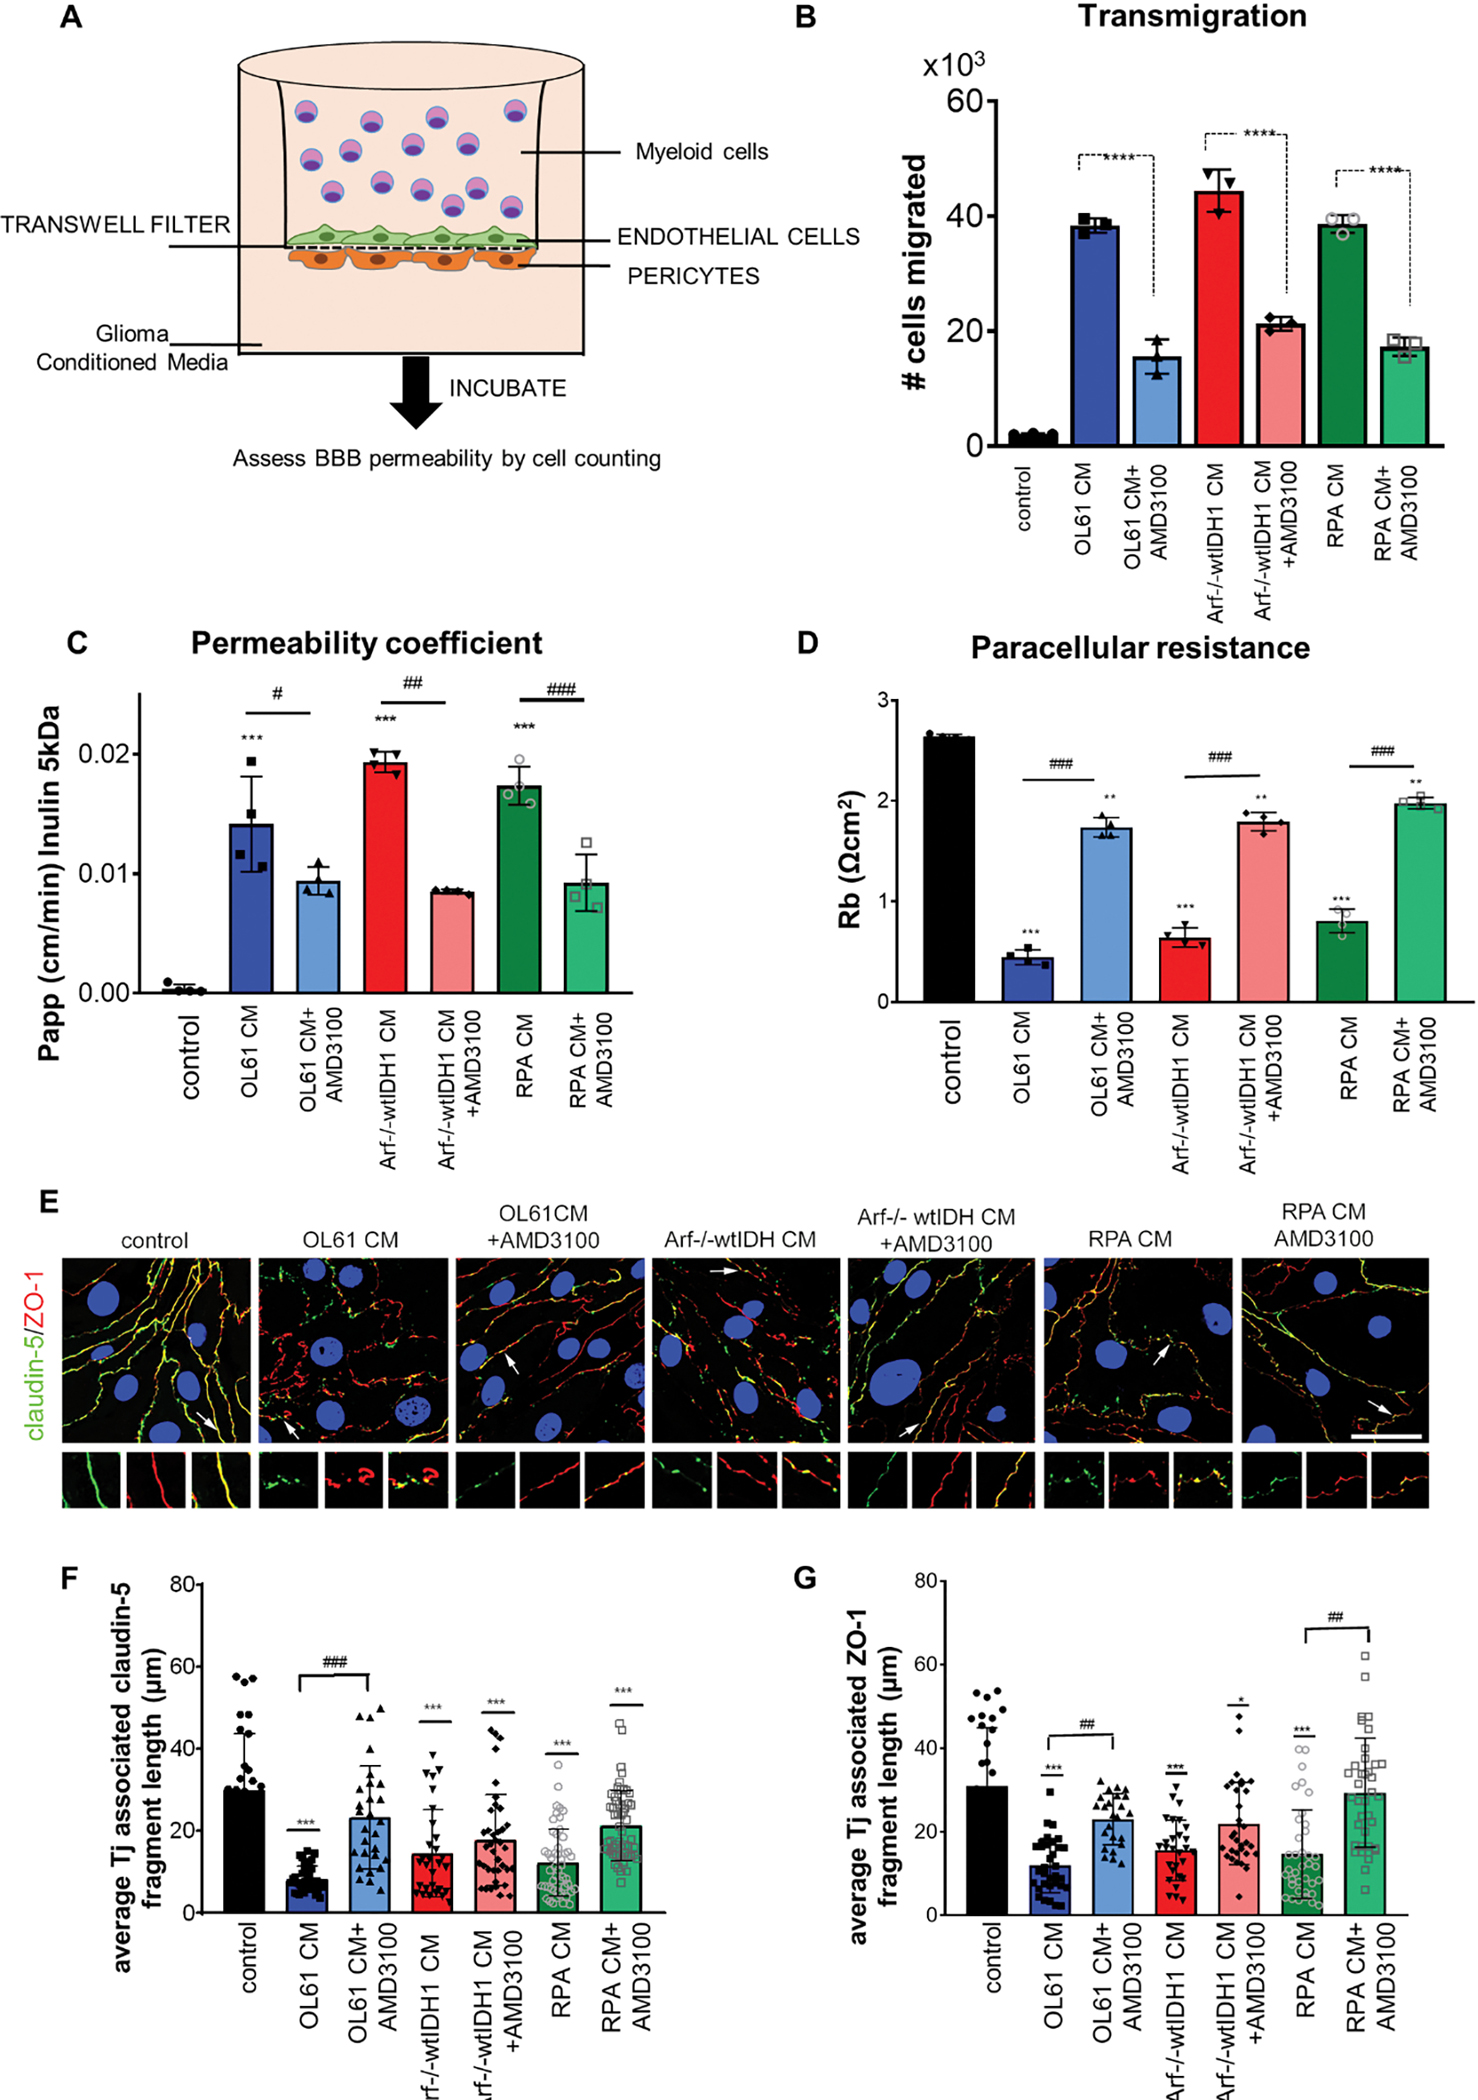
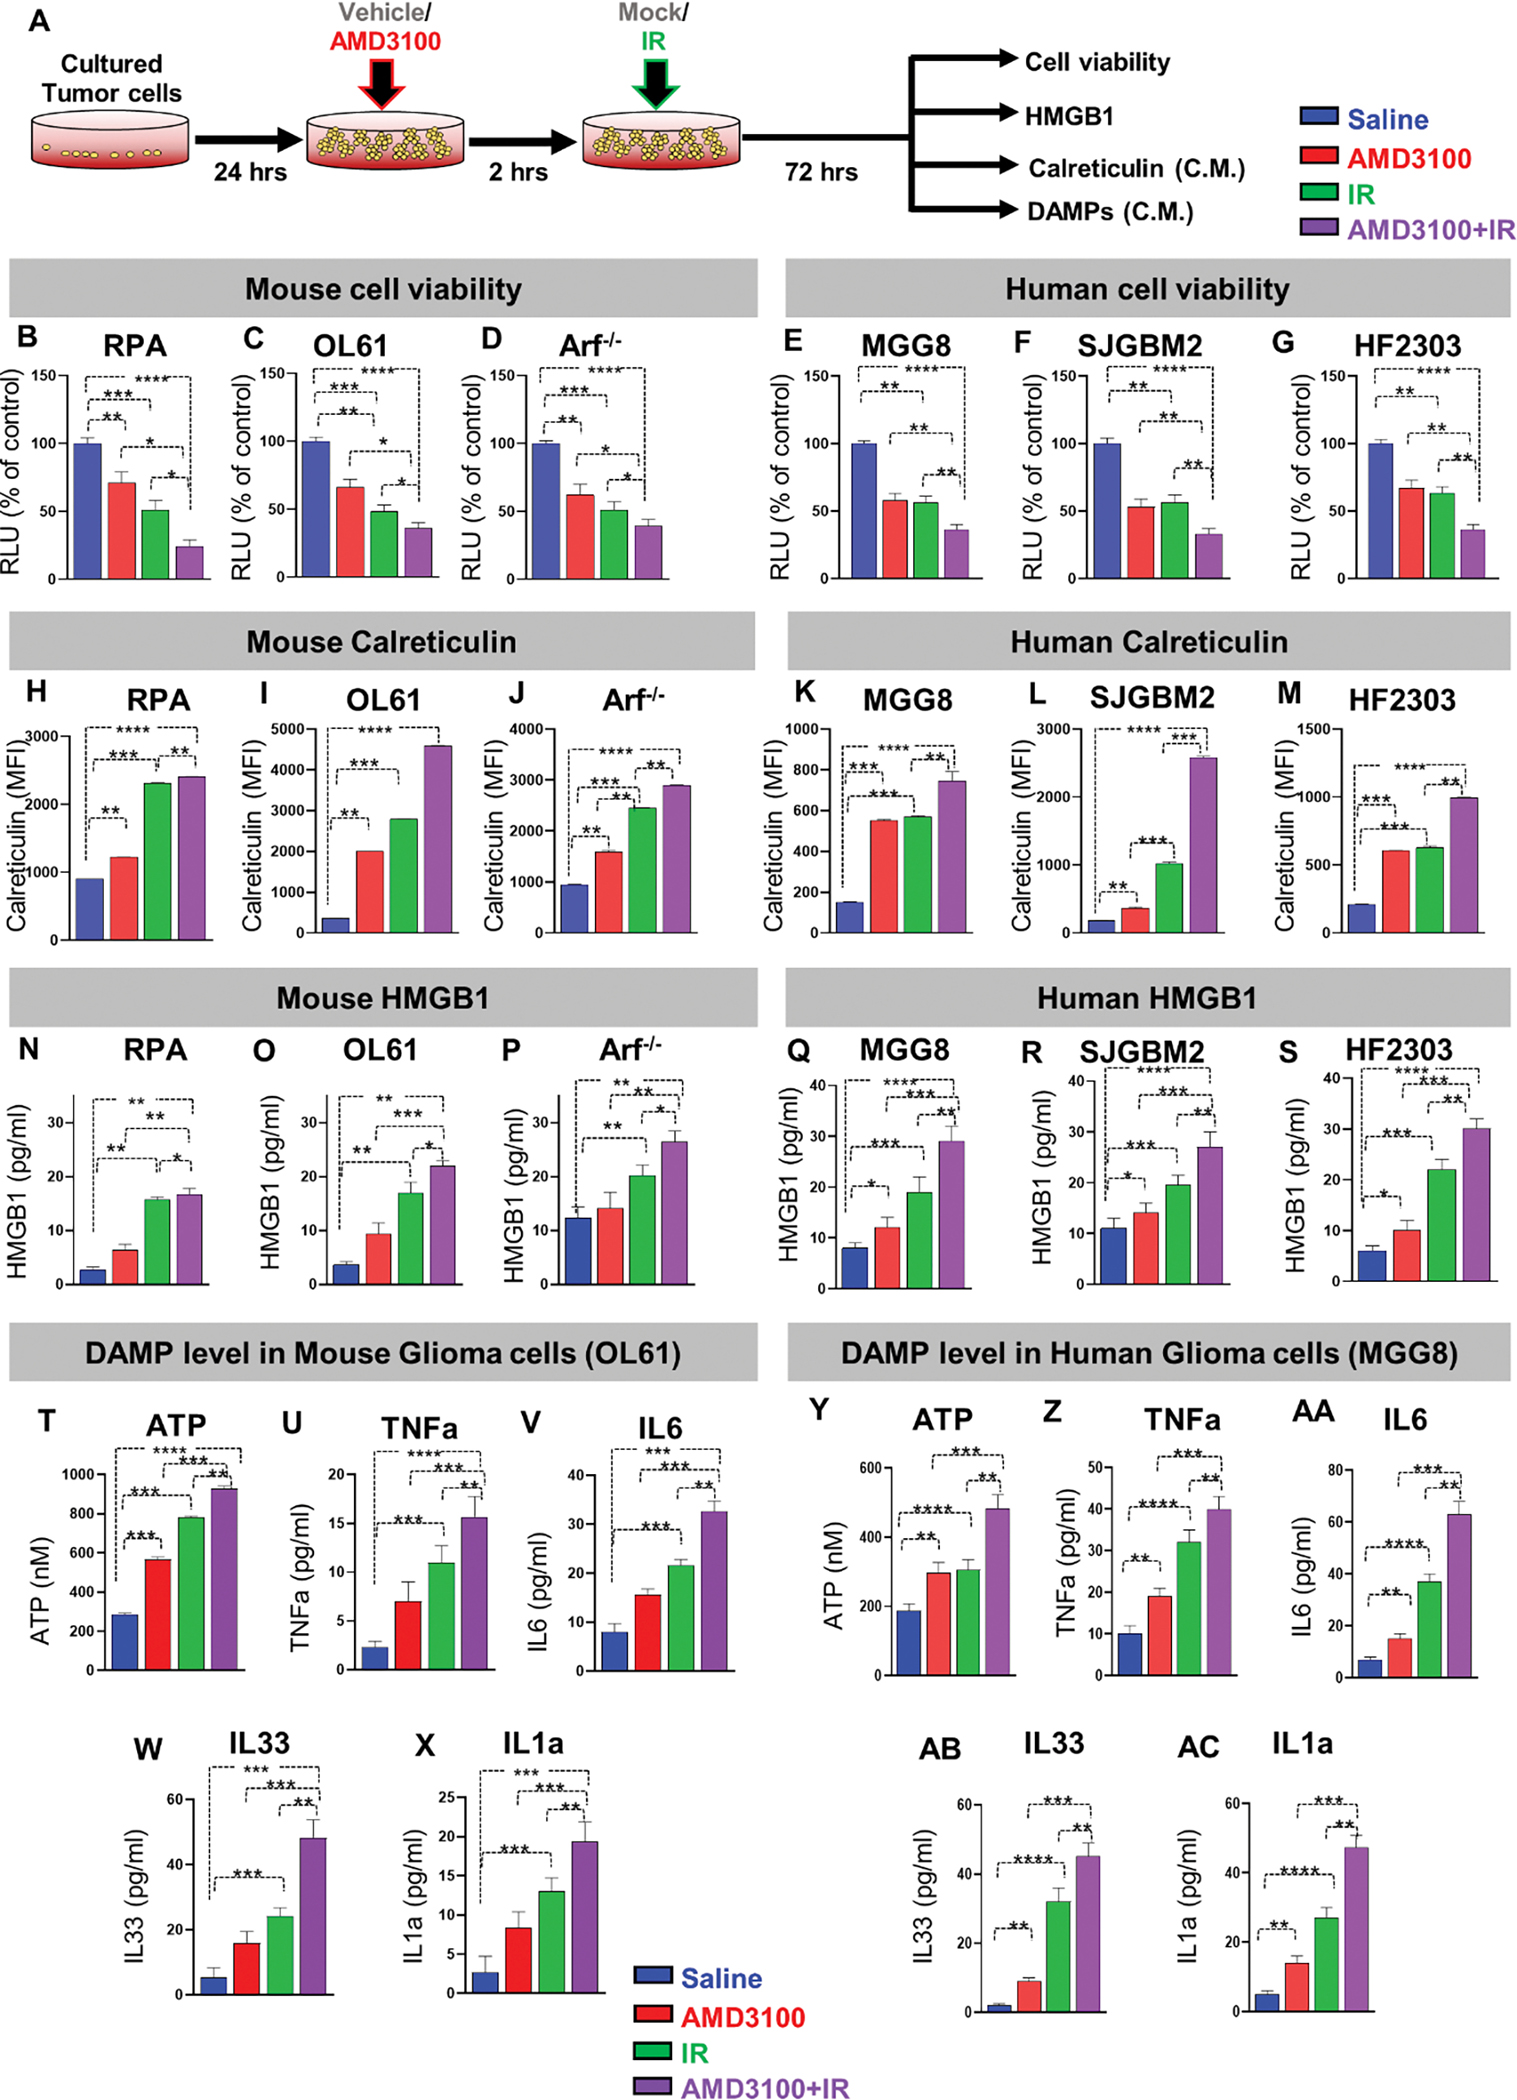
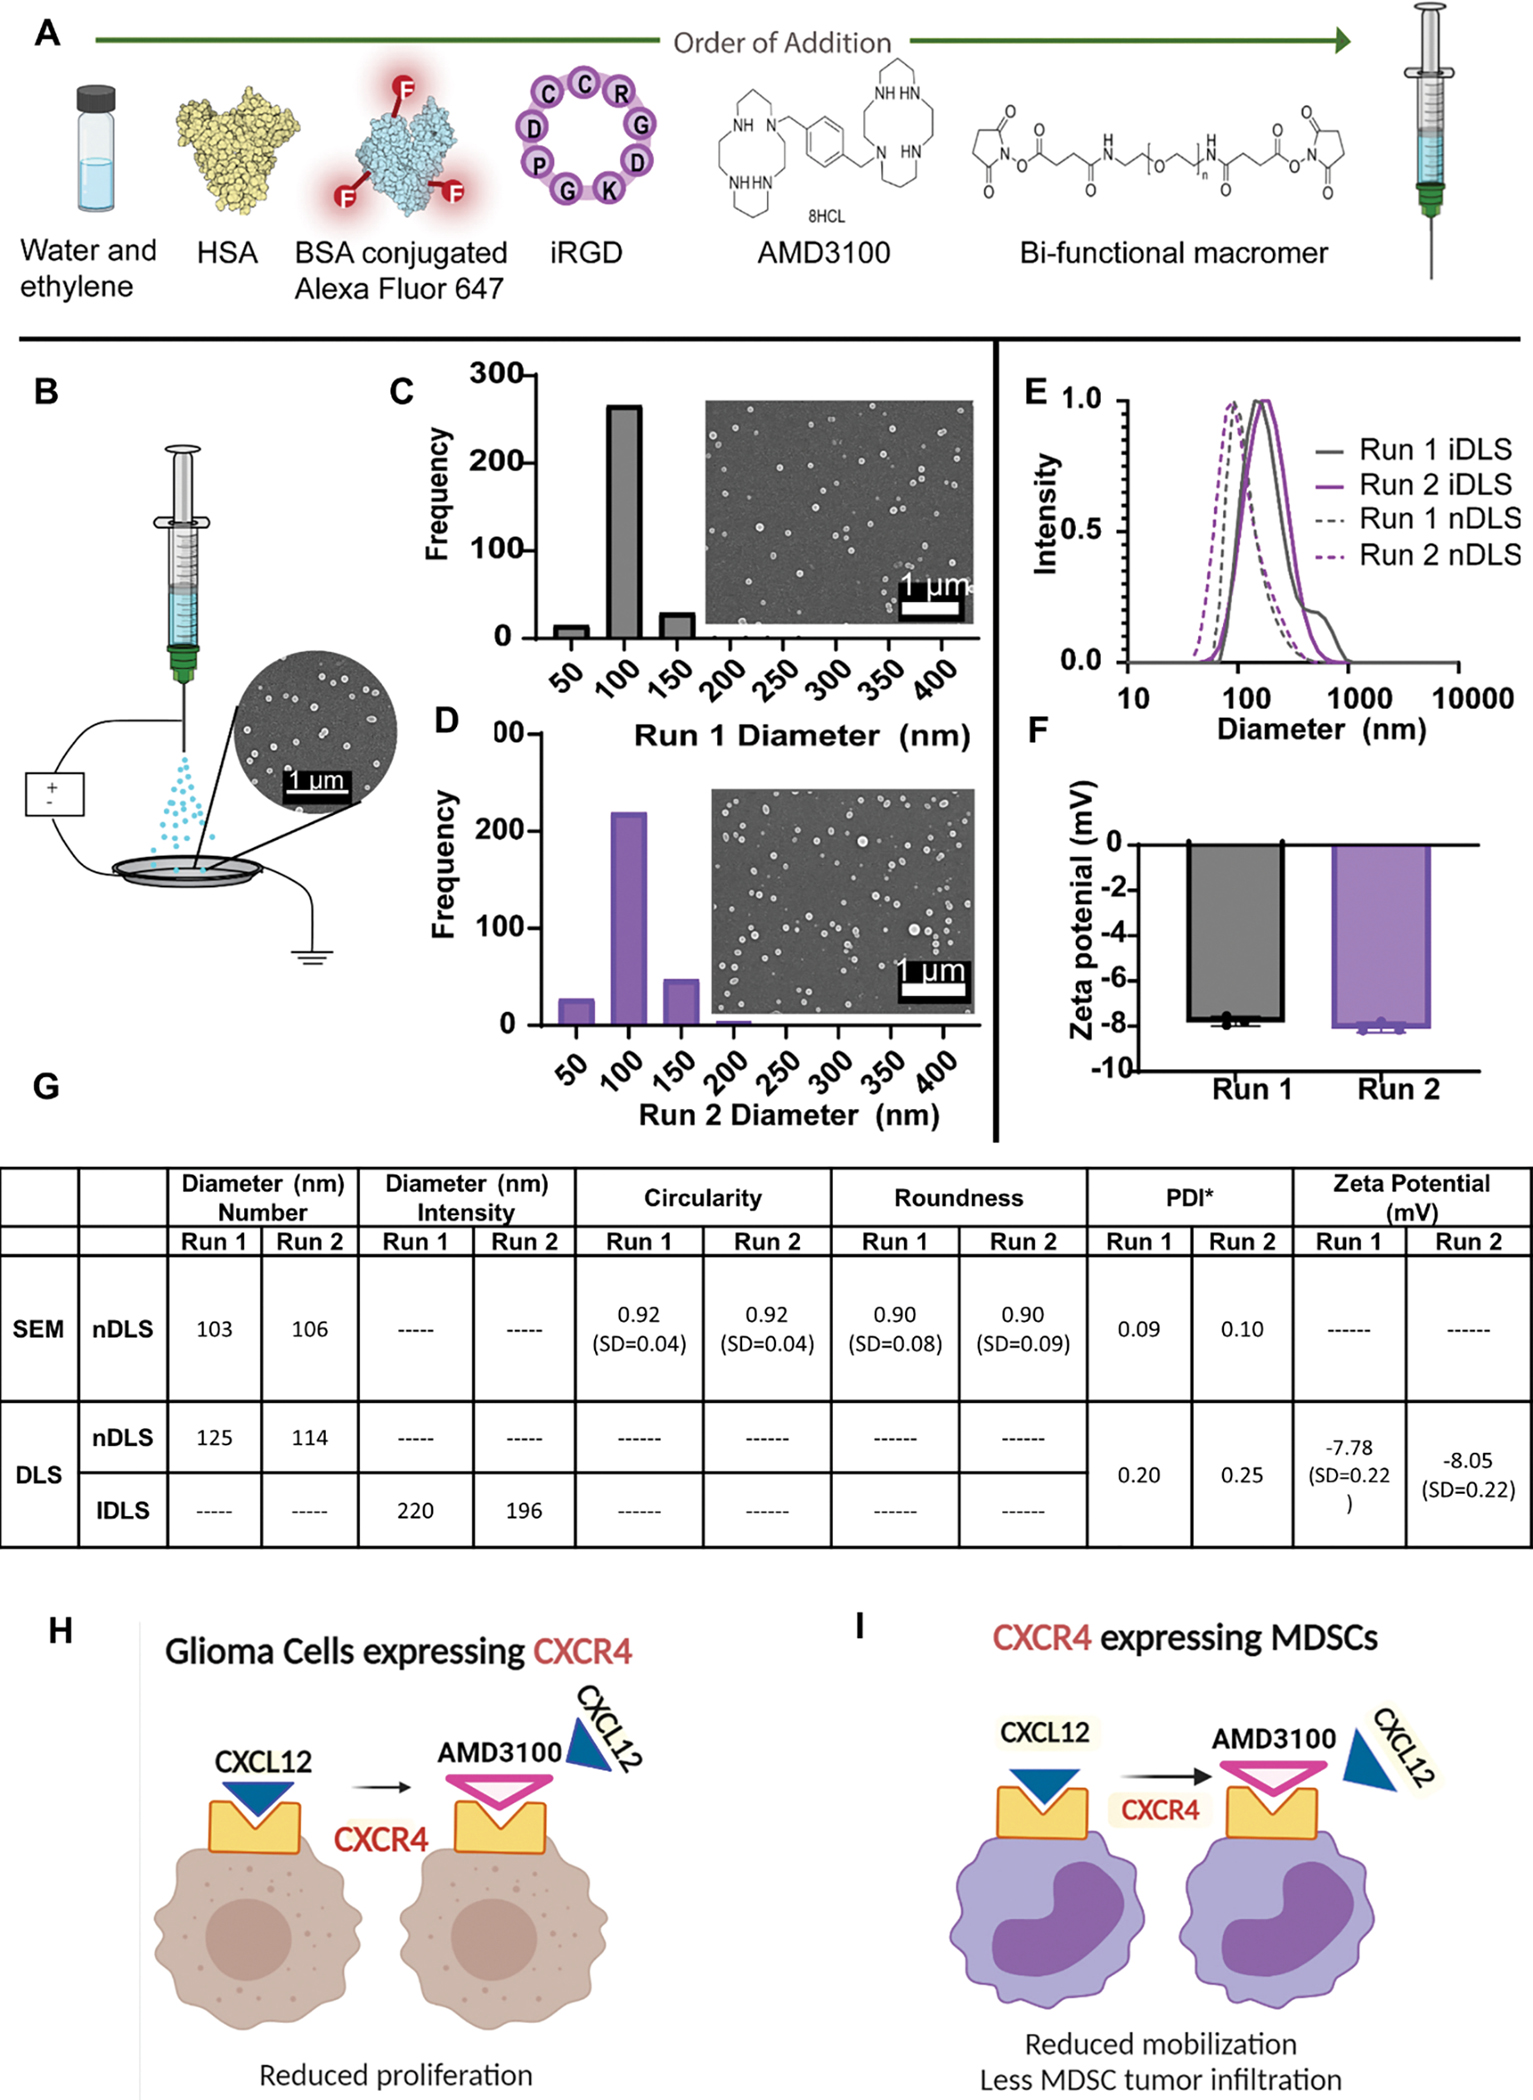
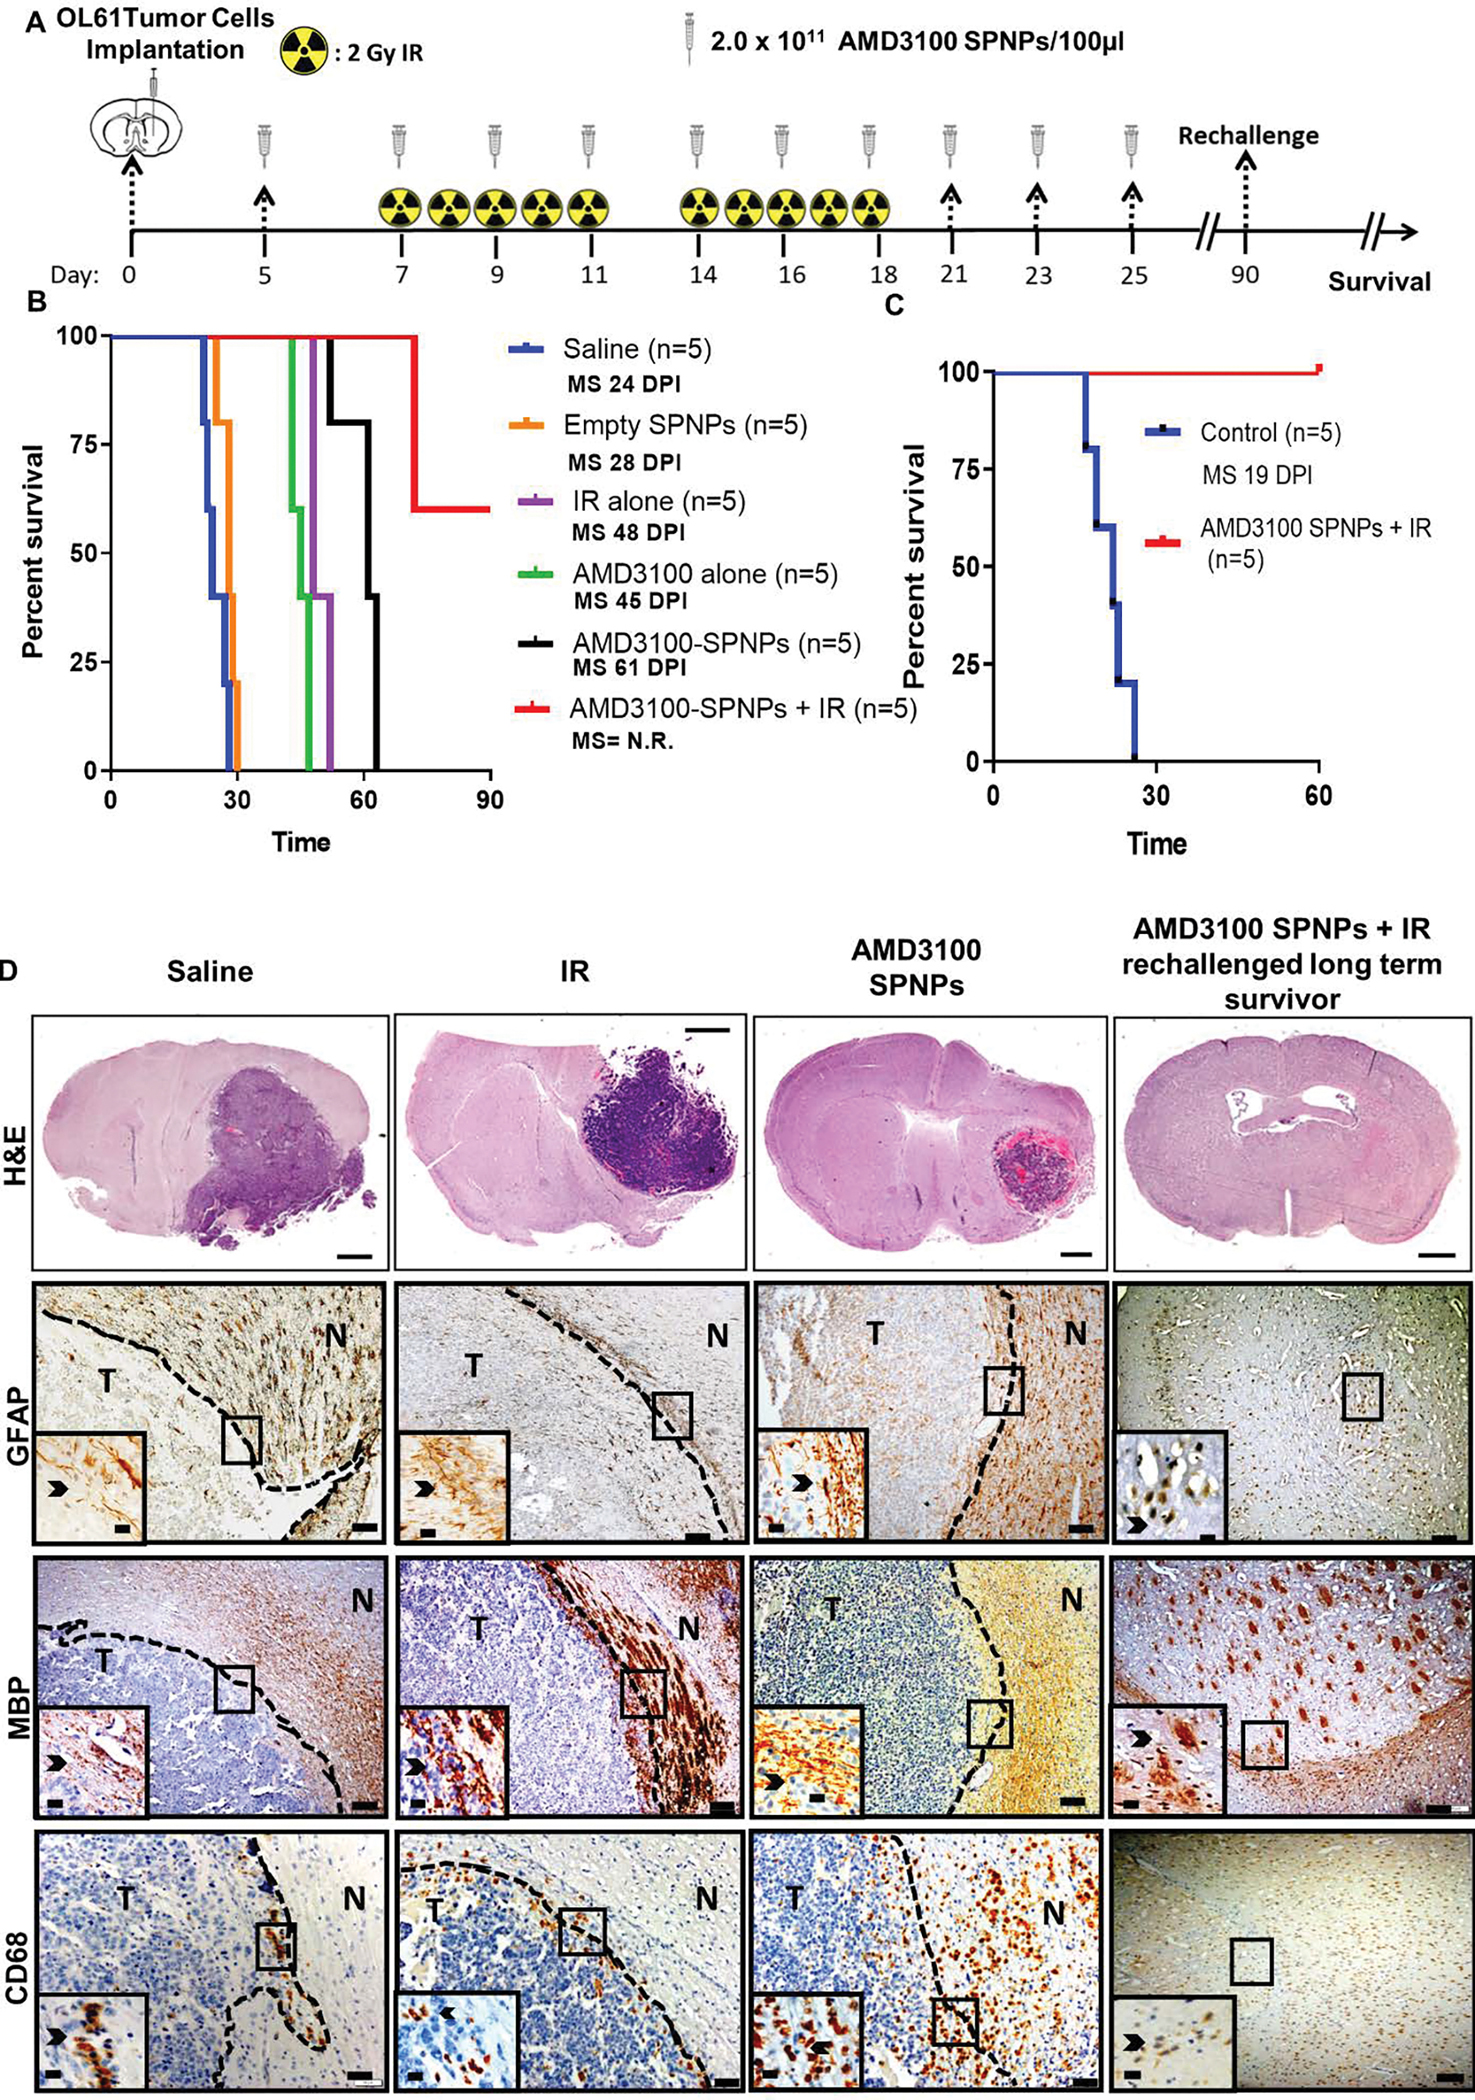
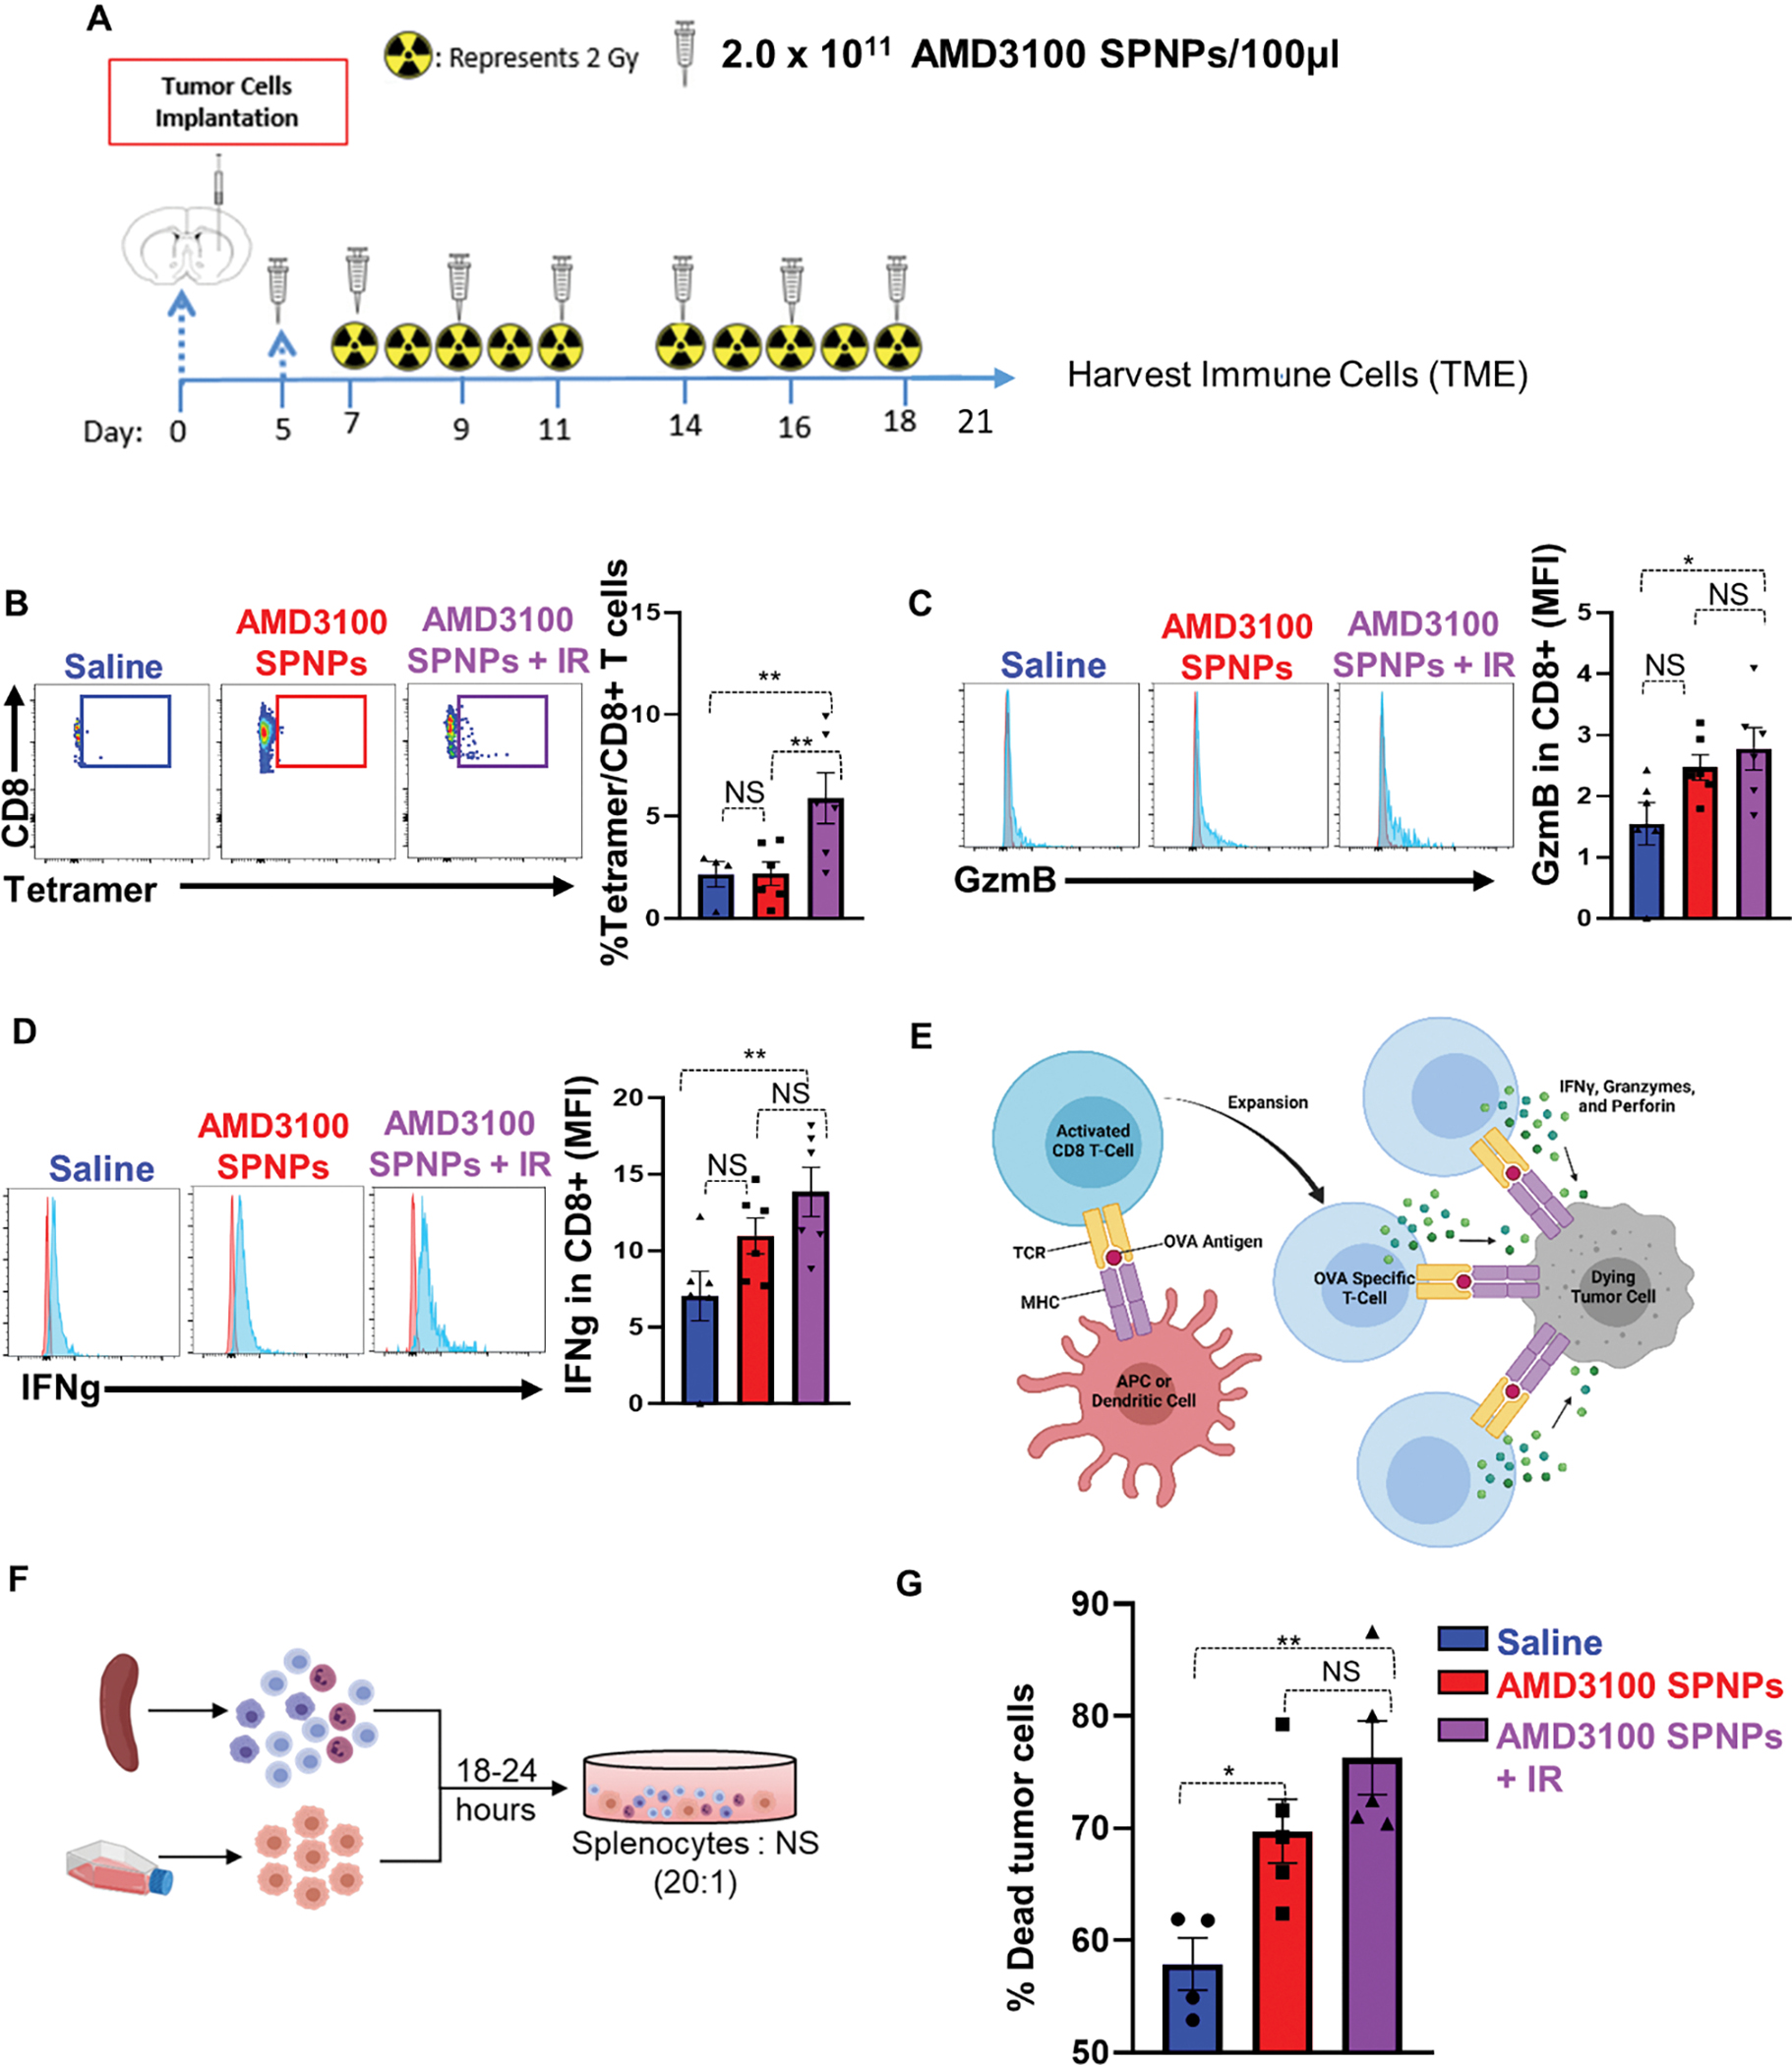
Glioblastoma (GBM) is an aggressive primary brain cancer, with a 5 year survival of ∼5%. Challenges that hamper GBM therapeutic efficacy include (i) tumor heterogeneity, (ii) treatment resistance, (iii) immunosuppressive tumor microenvironment (TME), and (iv) the blood-brain barrier (BBB). The C-X-C motif chemokine ligand-12/C-X-C motif chemokine receptor-4 (CXCL12/CXCR4) signaling pathway is activated in GBM and is associated with tumor progression. Although the CXCR4 antagonist (AMD3100) has been proposed as an attractive anti-GBM therapeutic target, it has poor pharmacokinetic properties, and unfavorable bioavailability has hampered its clinical implementation. Thus, we developed synthetic protein nanoparticles (SPNPs) coated with the transcytotic peptide iRGD (AMD3100-SPNPs) to target the CXCL2/CXCR4 pathway in GBM via systemic delivery. We showed that AMD3100-SPNPs block CXCL12/CXCR4 signaling in three mouse and human GBM cell cultures in vitro and in a GBM mouse model in vivo. This results in (i) inhibition of GBM proliferation, (ii) reduced infiltration of CXCR4+ monocytic myeloid-derived suppressor cells (M-MDSCs) into the TME, (iii) restoration of BBB integrity, and (iv) induction of immunogenic cell death (ICD), sensitizing the tumor to radiotherapy and leading to anti-GBM immunity. Additionally, we showed that combining AMD3100-SPNPs with radiation led to long-term survival, with ∼60% of GBM tumor-bearing mice remaining tumor free after rechallenging with a second GBM in the contralateral hemisphere. This was due to a sustained anti-GBM immunological memory response that prevented tumor recurrence without additional treatment. In view of the potent ICD induction and reprogrammed tumor microenvironment, this SPNP-mediated strategy has a significant clinical translation applicability.

Keywords: CXCL12/CXCR4; glioma; immunogenic cell death; immunotherapy; nanoparticles; synthetic protein; systemic delivery; tumor microenvironment.


Figures

Figure 1.
Figure 1.. Aggressive genetically engineered GBM models are associated with activated CXCR4/CXCL12 signaling and infiltration of immunosuppressive myeloid cells.
(A) Experimental design of the generation of GBM models using the sleeping beauty (SB, rapidly growing, RPA and OL61) and RCAS-TVA technology (slow-growing, Arf−/−). Neurospheres from each model were harvested, cultured and used for intracranial implantation in animals. (B) Kaplan-Meier survival curves of mice bearing Arf−/−, OL61, or RPA (MS: median survival). (C-E) Characterization of granulocytic and monocytic myeloid cell populations (Ly6G vs Ly6C respectively) in normal brain or OL61, RPA, and Arf−/− tumor bearing mice. Arf−/− wtIDH1 tumor bearing mice display lower percentage of monocytic myeloid cells (M-MDSCS; Ly6C+) compared to OL61 and RPA tumor bearing mice. (F, G) Flow analysis of the Ly6G+ CXCR4+ myeloid cells in normal brain or in the tumor from OL61, RPA, and Arf−/− implanted mice. (H-I) Flow analysis of the Ly6C+ CXCR4+ myeloid cells in normal brain or in the tumor from OL61, RPA, and Arf−/− implanted mice. Quantitative ELISA of the CXCL12 levels in mouse serum of tumor-bearing animals (J), conditioned media from cultured mouse, (K) conditioned media from human cells (L), and serum from control and GBM patients (M). p<0.05, ** p<0.01, *** p<0.001. Student’s t test, (n=5/group).
Figure 2.
Figure 2.. CXCR4 is expressed primarily by monocytic MDSCs (CD45high/CD11b+/Ly6Chigh) and is associated with poor prognosis.
(A, B) Representative flow cytometry plots and quantification of the percentage of PMN-MDSCs (CD45high/CD11b+/Ly6G+/Ly6Clow) or M-MDSCs (CD45high/CD11b+/ Ly6Chigh) in bone marrow (BM) from normal mice (N), and mice implanted with OL61, RPA, or Arf−/− wtIDH1 neurospheres. (C) Quantitative analysis of CXCR4 expression in conditions from (B). (D, E) Representative flow cytometry plots and quantification of the percentage of PMN-MDSCs (CD45high/CD11b+/Ly6G+/Ly6Clow) or M-MDSCs (CD45high/CD11b+/ Ly6Chigh) in blood from normal mice (N), and mice implanted with OL61, RPA, or Arf−/− wtIDH1 neurospheres. (F) Quantitative analysis of CXCR4 expression in conditions from (E). (G, H) Representative flow cytometry plots and quantification of the percentage of PMN-MDSCs (CD45high/CD11b+/Ly6G+/Ly6Clow) or M-MDSCs (CD45high/CD11b+/ Ly6Chigh) in spleen from normal mice (N), and mice implanted with OL61, RPA, or Arf−/− wtIDH1 neurospheres. (I) Quantitative analysis of CXCR4 expression in conditions from (H). (J) Analysis of CXCR4 gene expression for glioma patients according to their grade, Grade II (n=226), Grade III (n= 244), and Grade IV (n=150). (K) Kaplan-Meier survival analysis of TCGA glioma patients with high vs low level of CXCR4 expression. (L) Analysis of CXCR4 gene expression for glioma patients in CGGA database according to their grade, Grade II (n=103), Grade III (n= 79), and Grade IV (n=139). (M) Kaplan-Meier survival analysis of CGGA glioma patients with high vs low level of CXCR4 expression. * p<0.05, ** p<0.01, *** p<0.005, One-way ANOVA, (n=5/group).
Figure 3.
Figure 3.. CXCR4 signaling enhances myeloid cells transmigration and increases brain endothelial cell (BEC) barrier permeability.
(A) Diagram of transwell dual-chamber system used for cell migration assay. (B) Bar graph represents the number of the myeloid cells migrated through the endothelial-pericytes transmembrane. (C) Permeability coefficient (Papp) for FITC-inulin in mBMEC monolayers exposed to condition media collected from OL61, Arf−/−wtIDH and RPA cells with or without CXCR4 inhibitor AMD3100 for 24 hrs. (D) Bar graph represents paracellular resistance (Rb) value at 24 hrs for all analyzed groups. (E) Immunofluorescence staining for tight junction (Tj) proteins claudin-5 and ZO-1 in control and cells exposed to OL61, OL61+AMD3100, Arf−/−wtIDH, Arf−/−wtIDH+AMD3100, and RPA and RPA+AMD3100 for 24 hrs. Arrow and magnified images indicate pattern and colocalization of claudin-5 and ZO-1 on the cell border. Scale bar 50mm. Quantitation of the average TJ-associated (F) claudin-5 and (G) ZO-1 fragment length in claudin-5/ZO-1 costained immunofluorescent images in control and cells exposed to OL61, OL61+AMD3100, Arf−/−wtIDH, Arf−/−wtIDH+AMD3100, and RPA and RPA+AMD3100 for 24 hrs. Data are shown as means ± SD. n = 3–5; ***p<0.0001 and **p<0.001 comparing to control. ###p<0.0001 comparing experimental groups with and without inhibitor AMD3100.
Figure 4.
Figure 4.. CXCR4 blockade enhances radio-sensitivity and immunogenic cell death in mouse and human glioma cells.
(A) Schematic shows the in vitro application of AMD3100 and/ or radiation in mouse and human cell cultures. Mouse and patient-derived glioma cells were treated with either free-AMD3100 or in combination with radiation at their respective IC50 doses for 72h. All mouse and human glioma cells were pre-treated with AMD3100 2h prior to irradiation with 3Gy and 10Gy of radiation respectively. (B-D) Bar plot shows the % viable mouse glioma cells (RPA, OL61, or Arf−/−) after treatment with saline, AMD3100, IR (3Gy), or AMD3100+IR. (E-G) Bar plot shows the % viable human glioma cells (MGG8, SJGBM2, or HF2303) after treatment with saline, AMD3100, IR (3Gy), or AMD3100+IR. (H-J) Bar graphs represent levels of immunogenic cell death (ICD) marker Calreticulin in mouse glioma cells (RPA, OL61, or Arf−/−) after treatment with saline, AMD3100, IR (3Gy), or AMD3100+IR. (K-M) Bar graphs represent levels of immunogenic cell death (ICD) marker Calreticulin in human glioma cells (MGG8, SJGBM2, or HF2303) after treatment with saline, AMD3100, IR (3Gy), or AMD3100+IR. (N-P) Bar graphs represent levels of immunogenic cell death (ICD) marker HMGB1 in mouse glioma cells (RPA, OL61, or Arf−/−) after treatment with saline, AMD3100, IR (3Gy), or AMD3100+IR. (Q-S) Bar graphs represent levels of immunogenic cell death (ICD) marker HMGB1 in human glioma cells (MGG8, SJGBM2, or HF2303) after treatment with saline, AMD3100, IR (3Gy), or AMD3100+IR. (T-AC) Quantitative ELISA show the levels of DAMPs (ATP, TNFα, IL6, IL33, IL1α), as markers for ICD in the mouse glioma cells OL61 and the human glioma cells MGG8 after treatment with saline, AMD3100, IR (3Gy), or AMD3100+IR. All AMD3100 treatment were done at IC50 values of the corresponding cell line alone or in combination with 3Gy of IR. (Blue= Saline red= AMD3100 alone, green= IR alone, violet= AMD3100 + IR). MFI= mean fluorescence intensity. ns= non-significant, *p< 0.05 **p< 0.01, ***p< 0.0001, ****p< 0.0001; unpaired t-test. Bars represent mean ± SEM (n= 3 biological replicates).
Figure 5.
Figure 5.. Preparation of electrohydrodynamic (EHD)-jetting and characterization of AMD3100-SPNPs.
(A) Formulation of AMD3100-SPNPs indicating the order of addition of different components. (B) Schematic of the jetting process for AMD3100-SPNPs depicting a Scanning Electron Microscopy (SEM) image of the SPNPs jetted atop of the collection plate (scale bar = 1μm). (C) Size distribution of SPNPs of an independent run, Run 1, in their dry state characterized via SEM and ImageJ analysis. Average diameter, 103 ± 20 nm (PDI = 0.09). Scale bar = 1 μm. (D) Size distribution of SPNPs of a second independent run, Run 2, in their dry state characterized via SEM and ImageJ analysis. Average diameter, 106 ± 25 nm (PDI = 0.10). (E) Numbers based Dynamic Light Scattering (nDLS) size distribution (dashed) and Intensity based DLS (IDLS) of SPNPs in PBS comparing Run 1 and Run 2. (F) Zeta potential of Run 1 and Run 2. (G) Summary table of SPNP characterization of size, shape and charge. (H, I) Schematics represent the therapeutic advantages of blocking CXCR4 in glioma cells. (H) and myeloid cells (I).
Figure 6.
Figure 6.. Combining AMD3100-SPNPs with IR prolong survival of GBM tumor bearing mice.
(A) Timeline of treatment for the combined AMD3100-SPNPs+ IR survival study. (B) Kaplan–Meier survival curve. Significant increase in median survival is observed in all groups receiving AMD3100 alone (i.p.) or IR (p<0.01). Mice (n=5) treated with AMD3100-SPNPs (i.v.) + IR reach long-term survival timepoint (100 dpi) with no signs of residual tumor (C) Kaplan-Meier survival plot for re-challenged long-term survivors from AMD3100-SPNPs+IR (n=5), or control (OL61 Untreated) (n=5). Data were analyzed using the log-rank (Mantel-Cox) test. Days post implantation= dpi. NS= Not significant. **p<0.01, ***p<0.005. (D) H&E staining of 5μm paraffin embedded brain sections from saline (24 dpi), IR (48 dpi), AMD3100-SPNPs alone (45 dpi) and long-term survivors from AMD3100-SPNPs + IR treatment groups (60 dpi after rechallenging with OL61 cells) (scale bar = 1mm). Paraffin embedded 5μm brain sections for each treatment groups were stained for CD68, myeline basic protein (MBP) and glial fibrillary acidic protein (GFAP). Low magnification (10X) panels show normal brain (N) and tumor (T) tissue (black scale bar = 100μm). Black arrows in the high magnification (40X) panels (black scale bar = 20μm) indicate positive staining for the areas delineated in the low-magnification panels. Representative images from an experiment consisting of 3 independent biological replicates are displayed.
Figure 7.
Figure 7.. Combining AMD3100-SPNPs + IR enhances the adaptive antitumor immune response.
(A) Experimental design represents the timeline for the combination treatment of AMD3100-SPNPs + IR to assess the efficacy of GBM-infiltrating T cell function. (B) Representative flow cytometry plots and analysis represents the frequency of tumor specific CD8+ T cells within the TIME in saline, AMD3100-SPNPs, or AMD3100-SPNPs+ IR group. OL61-OVA tumors were analyzed by staining for the SIINFEKL-Kb tetramer. (C, D) Representative flow cytometry plots and analysis represent the expression of effector T cells molecules Granzyme B (GzmB) (C) and Interferon-g (IFN-γ) (D) in CD8 T cells in filtrating the TIME of each group. (E) Schematic represents the process of priming and expansion of OVA specific CD8 T cells which target OL61-OVA cells and triggers tumor cell death. (F) Schematic represents the killing assay of tumor cells co-cultured with splenocytes from each treatment group. (G) Quantitative analysis of the percentage of tumor cells death in co-culturing condition of OL61-OVA tumor cells with Splenocytes from OL61-OVA implanted mice treated with saline, AMD3100-SPNPs, or AMD3100-SPNPs+IR. Red histogram= isotype control, blue histogram= representative sample GzmB or IFN-γ expression. *p< 0.05 **p< 0.01, ***p< 0.0001, ****p<0.0001; One way ANOVA. Bars represent mean ± SEM. (n=4–5/group).

References

    1. Ramirez YP; Weatherbee JL; Wheelhouse RT; Ross AH Glioblastoma multiforme therapy and mechanisms of resistance. Pharmaceuticals (Basel) 2013, 6 (12), 1475–1506. DOI: 10.3390/ph6121475. - DOI - PMC - PubMed
    1. Himes BT; Geiger PA; Ayasoufi K; Bhargav AG; Brown DA; Parney IF Immunosuppression in Glioblastoma: Current Understanding and Therapeutic Implications. Front Oncol. 2021, 11, 770561. DOI: 10.3389/fonc.2021.770561. - DOI - PMC - PubMed
    1. Arvanitis CD; Ferraro GB; Jain RK The blood–brain barrier and blood–tumour barrier in brain tumours and metastases. Nat Rev Cancer. 2020, 20 (1), 26–41. DOI: 10.1038/s41568-019-0205-x. - DOI - PMC - PubMed
    1. Parrish KE; Sarkaria JN; Elmquist WF Improving drug delivery to primary and metastatic brain tumors: strategies to overcome the blood-brain barrier. Clin Pharmacol Ther. 2015, 97 (4), 336–346. DOI: 10.1002/cpt.71. - DOI - PubMed
    1. Ma Q; Jones D; Borghesani PR; Segal RA; Nagasawa T; Kishimoto T; Bronson RT; Springer TA Impaired B-lymphopoiesis, myelopoiesis, and derailed cerebellar neuron migration in CXCR4- and SDF-1-deficient mice. Proc Natl Acad Sci U S A. 1998, 95 (16), 9448–9453. DOI: 10.1073/pnas.95.16.9448. - DOI - PMC - PubMed

Publication types

LinkOut - more resources