. 2022 Jul 15;132(14):e150097.
doi: 10.1172/JCI150097.

A Shigella species variant is causally linked to intractable functional constipation

Affiliations

A Shigella species variant is causally linked to intractable functional constipation

Xin Chen et al. J Clin Invest. .

Abstract

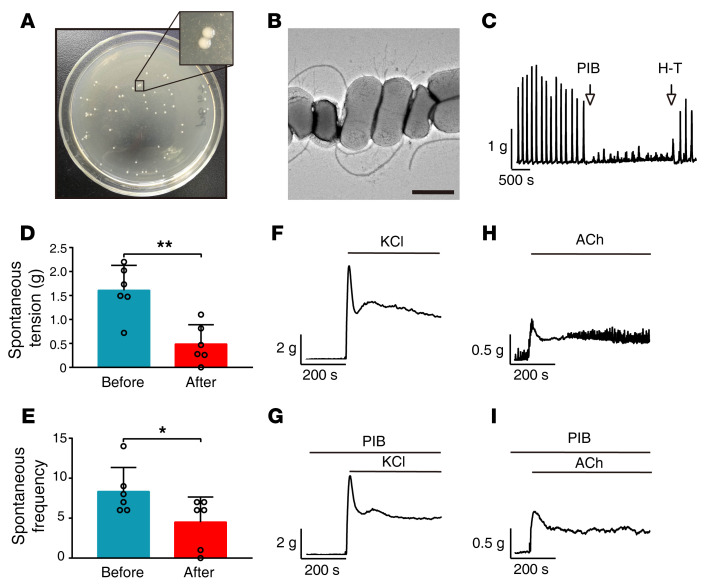
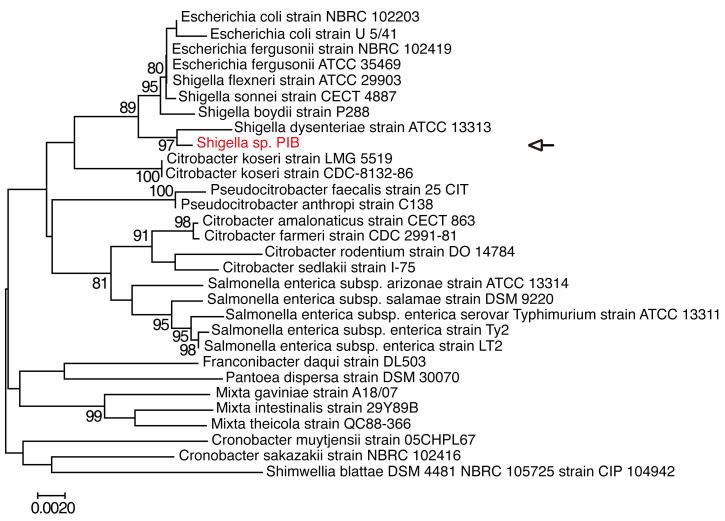
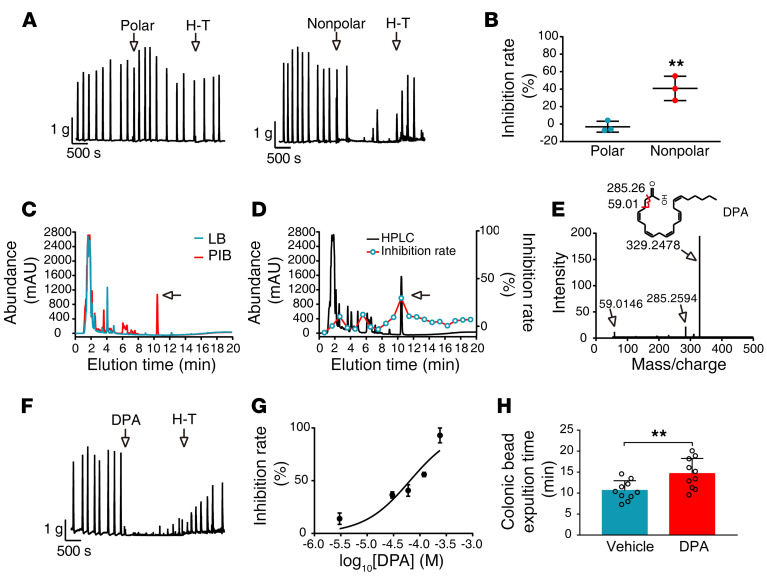
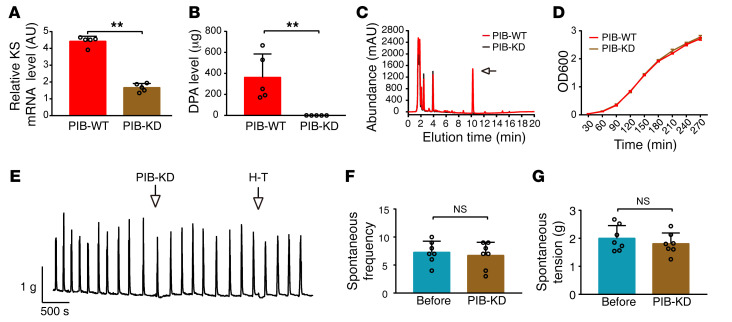
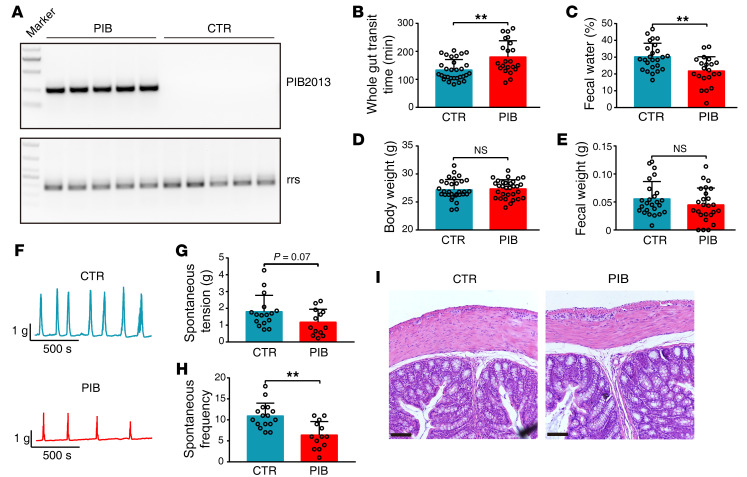
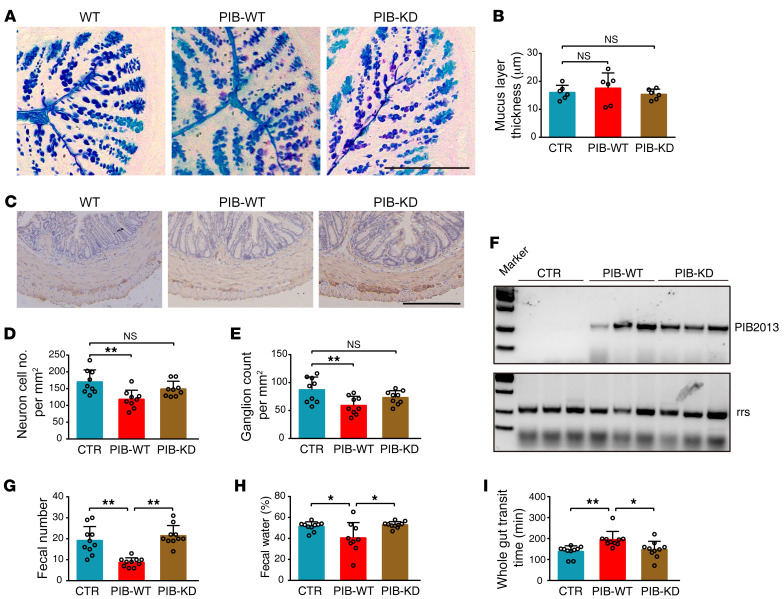
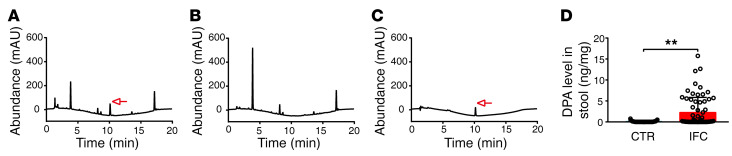
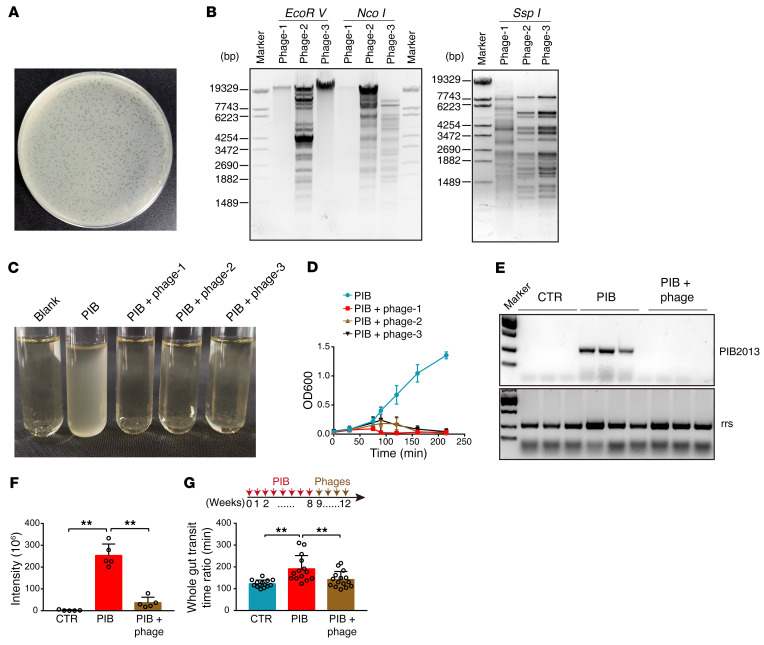
Intractable functional constipation (IFC) is the most severe form of constipation, but its etiology has long been unknown. We hypothesized that IFC is caused by refractory infection by a pathogenic bacterium. Here, we isolated from patients with IFC a Shigella species - peristaltic contraction-inhibiting bacterium (PIB) - that significantly inhibited peristaltic contraction of the colon by production of docosapentenoic acid (DPA). PIB colonized mice for at least 6 months. Oral administration of PIB was sufficient to induce constipation, which was reversed by PIB-specific phages. A mutated PIB with reduced DPA was incapable of inhibiting colonic function and inducing constipation, suggesting that DPA produced by PIB was the key mediator of the genesis of constipation. PIBs were detected in stools of 56% (38 of 68) of the IFC patients, but not in those of non-IFC or healthy individuals (0 of 180). DPA levels in stools were elevated in 44.12% (30 of 68) of the IFC patients but none of the healthy volunteers (0 of 97). Our results suggest that Shigella sp. PIB may be the critical causative pathogen for IFC, and detection of fecal PIB plus DPA may be a reliable method for IFC diagnosis and classification.

Keywords: Bacterial infections; Gastroenterology.


Figures

Figure 1
Figure 1. Identification of PIB from IFC patients.
(A) Typical morphology of PIB colonies. (B) Individual PIB. Scale bar: 1 μm. (C) Representative contraction tracings before and after treatment with PIB culture supernatant. (D and E) Quantification of the contraction in C (n = 6). (FI) Representative contraction tracings of PIB culture supernatant–pretreated colons after stimulation with 87 mM KCl (F and G) or 100 μM ACh (H and I). PIB culture supernatant was applied over 15 minutes before stimulating with KCl or ACh. The experiments were repeated at least 3 times. Data are presented as mean ± SD. *P < 0.05, **P < 0.01 (paired 2-tailed t test).
Figure 2
Figure 2. Phylogenetic relationship between PIB and related bacteria.
A phylogenetic tree based on the PIB 16S rrs (1464 bp) was constructed by the neighbor-joining method, and the distance was calculated with the maximum composite likelihood method as the number of base substitutions per site. Bootstrap values (>80%) based on 1000 replications are listed on the branch node, and the branch length of the phylogenetic tree is proportional to the evolutionary distance. The 16S rrs genes of related bacteria were extracted from GenBank. Phylogenetic analysis was performed using Molecular Evolutionary Genetics Analysis software, version 7.0.
Figure 3
Figure 3. DPA is the active factor released from PIB.
(A and B) PIB culture supernatant was extracted with methanol/H2O/dichloromethane, and the substances in polar and nonpolar phases were subjected to contraction measurement. The contraction inhibition rate of the substances in the 2 phases was calculated (n = 3). (C) The substances in the dichloromethane phase were analyzed with HPLC with a C18 column. The arrow indicates the extra peak (red) of PIB medium in contrast to LB medium. The experiments were repeated 3 times. (D) The contraction-inhibiting activity for each eluted fraction of HPLC was measured. The fraction about 10.2 minutes after elution showed the highest activity. (E) The major resulting fragment ions are indicated in mass spectra of active fraction peaks and were extracted as DPA. The numbers indicate molecular weights of fragment ions. (F) cDPA had a substantial inhibitory effect on contraction. (G) Quantitation of the inhibitory effect of DPA (n = 4). (H) Colonic transit test with bead expulsion time in vehicle- and DPA-treated mice (n = 10). Data are presented as mean ± SD. **P < 0.01 (B, paired 2-tailed t test; H, unpaired 2-tailed t test).
Figure 4
Figure 4. Knockdown of the KS gene disrupts the inhibitory effect of PIB on colon contraction.
(A) KS mRNA level in the PIB-WT and PIB-KD strains was measured by qPCR in which the 16S rrs was used as an internal control (n = 5). (B) DPA levels within PIB-WT and PIB-KD culture supernatants were analyzed with LC-MS/MS (n = 5). (C)Chromatograph of the substances within the culture supernatants of PIB-WT and PIB-KD. The arrow indicates the chromatographic peak of DPA. The experiments were repeated at least 3 times. (D) Bacterial growth curves of PIB-WT and PIB-KD within 270 minutes (n = 5). (E) Representative contraction tracings of colons before and after treatment with PIB-KD culture supernatant. (F and G) Quantification of E (n = 7). The data are presented as mean ± SD. **P < 0.01 (A and B, unpaired 2-tailed t test; F and G, paired 2-tailed t test).
Figure 5
Figure 5. Oral administration of PIB is sufficient to colonize mice and induce constipation phenotypes.
Introduction of 1 × 10⁹ CFU PIB (0.1 mL) per mouse was performed with gavage, and the constipation phenotypes were examined at week 9. (A) Fecal PIB was measured using PIB2013 (n = 5). 16S rrs was used as the internal control. CTR, control. (B) GTT (CTR, n = 30; PIB, n = 22). (C) Fecal water content (CTR, n = 25; PIB, n = 21). (D) Body weight (CTR, n = 30; PIB, n = 30). (E) Fecal weight (CTR, n = 25; PIB, n = 25). The data represent the summary from at least 3 independent experiments. Mice treated with LB were used as the control. (F) Representative colonic contraction tracings of PIB-treated and untreated mice. (G and H) Quantification of colonic peristaltic contraction in PIB-treated and control mice (CTR, n = 15; PIB, n = 13). (I) Representative histological morphology of colons from PIB-treated and control mice. The experiments were repeated at least 3 times. Scale bars: 100 μm. Data are presented as mean ± SD. **P < 0.01 (unpaired 2-tailed t test).
Figure 6
Figure 6. PIB-KD colonized mice but did not induce constipation.
1 × 10⁹ CFU PIB-KD or PIB-WT (0.1 mL) was administered orally to each mouse. (A) Typical immunochemistry section of mucus layers of colons from different groups of mice. (B) Quantification of mucus layer thickness (n = 6). (C) Representative immunochemistry results for colonic ganglia. (D and E) Quantification of ganglia and neurons (n = 9). (F) PIB2013 detection of fecal PIB-WT and PIB-KD in the stools. (G) Number of stools within 2 hours (n = 10). (H) Fecal water (n = 10, except PIB-WT n = 9). (I) GTT time (n = 10). Data are presented as mean ± SD. *P < 0.05, **P < 0.01 (1-way ANOVA Tukey’s multiple-comparison test). Scale bars: 200 μm.
Figure 7
Figure 7. Fecal DPA levels are higher in patients with IFC.
Stool specimens from participants with IFC and healthy volunteers underwent methanol/H2O/dichloromethane extraction and were sampled for HPLC analysis. (A and B) Representative chromatograms for fecal DPA in samples from the IFC and healthy groups. The arrow indicates a fecal DPA peak. (C) A liquid chromatogram of DPA standards (0.03125 ng) was performed to calculate DPA concentration in stool, indicated by an arrow. (D) Relative fecal DPA levels in the IFC patient and healthy groups (CTR, n = 97; IFC, n = 68). Data are presented as mean ± SD. **P < 0.01 (unpaired 2-tailed t test).
Figure 8
Figure 8. Treatment with bacteriophage against Shigella sp. PIB improves constipation symptoms.
(A) Plaque morphology of an isolated Shigella sp. PIB phage from sewage water. (B) Restriction enzyme analysis for 3 phages. (C) Typical image of PIB medium after specific phage administration. Blank, LB only. (D) Growth curve of PIB with or without Shigella phages (n = 4). (E) Fecal PIB in the indicated groups of mice as assayed by PIB2013. (F) Fecal DPA levels in the indicated mouse groups (n = 5). (G) GTT time for mice with or without PIB-specific phages (CTR, n = 14; PIB, n = 14; PIB + phage, n = 15). Data are presented as mean ± SD. **P < 0.01 (1-way ANOVA Tukey’s multiple-comparison test).

Comment in

Similar articles

Cited by

References

    1. Camilleri M, et al. Chronic constipation. Nat Rev Dis Primers. 2017;3(1):17095. doi: 10.1038/nrdp.2017.95. - DOI - PubMed
    1. Bharucha AE, Wald A. Chronic constipation. Mayo Clin Proc. 2019;94(11):2340–2357. doi: 10.1016/j.mayocp.2019.01.031. - DOI - PMC - PubMed
    1. Suares NC, Ford AC. Prevalence of, and risk factors for, chronic idiopathic constipation in the community: systematic review and meta-analysis. Am J Gastroenterol. 2011;106(9):1582–1591. doi: 10.1038/ajg.2011.164. - DOI - PubMed
    1. Wald A. Constipation: advances in diagnosis and treatment. JAMA. 2016;315(2):185–191. doi: 10.1001/jama.2015.16994. - DOI - PubMed
    1. Rao SS, et al. Diagnosis and management of chronic constipation in adults. Nat Rev Gastroenterol Hepatol. 2016;13(5):295–305. doi: 10.1038/nrgastro.2016.53. - DOI - PubMed

Publication types