. 2022 May 26;17(5):e0264460.
doi: 10.1371/journal.pone.0264460. eCollection 2022.

Interaction of fungal lipase with potential phytotherapeutics

Affiliations

Interaction of fungal lipase with potential phytotherapeutics

Farheen Naz et al. PLoS One. .

Abstract

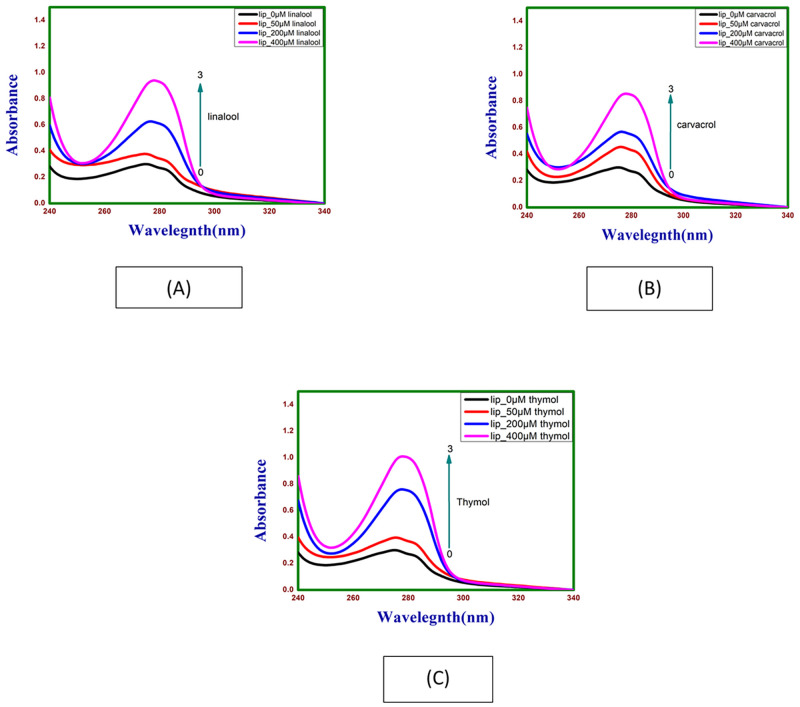
Interaction of thymol, carvacrol and linalool with fungal lipase and Human Serum Albumin (HSA) have been investigated employing UV-Vis spectroscopy Fluorescence and Circular dichroism spectroscopy (CD) along with docking studies. Thymol, carvacrol and linalool displayed approximately 50% inhibition at 1.5 mmol/litre concentrations using para-nitrophenyl palmitate (pNPP). UV-Vis spectroscopy give evidence of the formation of lipase-linalool, lipase-carvacrol and lipase-thymol complex at the ground state. Three molecules also showed complex formation with HSA at the ground state. Fluorescence spectroscopy shows strong binding of lipase to thymol (Ka of 2.6 x 10⁹ M-1) as compared to carvacrol (4.66 x 10⁷ M-1) and linalool (5.3 x 10³ M-1). Number of binding sites showing stoichiometry of association process on lipase is found to be 2.52 (thymol) compared to 2.04 (carvacrol) and 1.12 (linalool). Secondary structure analysis by CD spectroscopy results, following 24 hours incubation at 25°C, with thymol, carvacrol and linalool revealed decrease in negative ellipticity for lipase indicating loss in helical structure as compared with the native protein. The lowering in negative ellipticity was in the order of thymol > carvacrol > linalool. Fluorescence spectra following binding of all three molecules with HSA caused blue shift which suggests the compaction of the HSA structure. Association constant of thymol and HSA is 9.6 x 10⁸ M-1 which along with 'n' value of 2.41 suggests strong association and stable complex formation, association constant for carvacrol and linalool was in range of 107 and 103 respectively. Docking results give further insight into strong binding of thymol, carvacrol and linalool with lipase having free energy of binding as -7.1 kcal/mol, -5.0 kcal/mol and -5.2 kcal/mol respectively. To conclude, fungal lipases can be attractive target for controlling their growth and pathogenicity. Employing UV-Vis, Fluorescence and Circular dichroism spectroscopy we have shown that thymol, carvacrol and linalool strongly bind and disrupt structure of fungal lipase, these three phytochemicals also bind well with HSA. Based on disruption of lipase structure and its binding nature with HSA, we concluded thymol as a best anti-lipase molecule among three molecules tested. Results of Fluorescence and CD spectroscopy taken together suggests that thymol and carvacrol are profound disrupter of lipase structure.


Conflict of interest statement

The authors have declared that no competing interests exist.

Figures

Fig 1
Fig 1
A. (linalool). B. (thymol). C. (carvacrol).
Fig 2
Fig 2. Structure of HSA showing subdomain I, subdomain II, subdomain III and binding pocket.
Fig 3
Fig 3
Inhibitory effect of (A) linalool, (B) carvacrol and (C) thymol on lipase activity.
Fig 4
Fig 4
Absorption spectra of lipase as a function of (A) linalool, (B) carvacrol and (C) thymol concentration at 298.15 K and pH 7.4.
Fig 5
Fig 5
Absorption spectra of HSA as a function of (A) thymol, (B) carvacrol, and (C) linalool concentrations at 298.15 K and pH 7.4.
Fig 6
Fig 6
Emission spectra of lipase on (A) linalool, (B) carvacrol and (C) thymol at different concentrations.
Fig 7
Fig 7
Emission spectra of HSA with (A) linalool, (B) carvacrol and (C) thymol at different concentrations.
Fig 8
Fig 8
Far-UV CD spectra at 24hrs lipase in absence and presence of (A) linalool, (B) carvacrol and (C) thymol at 298.15 K and pH 7.4.
Fig 9
Fig 9
A. Far-UV CD spectra at 24hrs HSA in absence and presence of linalool, (B) carvacrol and (C) thymol at 298.15 K and pH 7.4.
Fig 10
Fig 10
Docking results of lipase-linalool system (a) Structure of lipase showing the subdomain and binding sites of linalool. The lipase is represented as a cartoon. (b) The 2D detailed view shows the interaction between linalool and its neighbouring residues. The green circles are residues participating in hydrogen bonds, charge or polar interactions. The pink circles are residues participating in alkyl and pi- alkyl bonds. (c) The 3D detailed view shows the interaction between linalool and its neighbouring residues Tyr 114, Ile112, Ala 126, Pro123, Leu284, Met127 and Ala 121. (d). HB Plot of linalool in the site of lipase domain. The black dots represent protein and red dots represent interaction. Docking results of lipase-carvacrol system (e) Structure of lipase showing the subdomain and binding sites of carvacrol. The lipase is represented as a cartoon. (f) The 2D detailed view shows the interaction between carvacrol and its neighbouring residues. The green circles are residues participating in hydrogen bonds, charge or polar interactions. The pink circles are residues participating in alkyl and pi- alkyl bonds. (g) The 3D detailed view shows the interaction between carvacrol and its neighbouring residues Tyr110, Tyr 192, Ala113 and Ile 112. (h). HB Plot of carvacrol in the site of lipase domain. The black dots represent protein and red dots represent interaction. Docking results of lipase-thymol system (i) Structure of lipase showing the subdomain and binding sites of thymol. The lipase is represented as a cartoon. (j) The 2D detailed view shows the interaction between thymol and its neighbouring residues. The green circles are residues participating in hydrogen bonds, charge or polar interactions. The pink circles are residues participating in alkyl and pi- alkyl bonds. (k) The 3D detailed view shows the interaction between thymol and its neighbouring residues Leu 108, Asp 134, Tyr 110, Ala 138, Ile 135, Val 145 and Trp 384. (l). HB Plot of thymol in the site of lipase domain. The black dots represent protein and red dots represent interaction.
Fig 11
Fig 11
Docking results of HSA-linalool system (a) Structure of HSA showing the subdomain and binding sites of linalool. The HSA is represented as a cartoon. (b) The 2D detailed view shows the interaction between linalool and its neighbouring residues. The green circles are residues participating in hydrogen bonds, charge or polar interactions. The pink circles are residues participating in alkyl and pi- alkyl bonds. (c) The 3D detailed view shows the interaction between linalool and its neighbouring residues Ala 194, Lys 190, Arg 197, His 146, Pro 147 and Tyr 148. (d). HB Plot of linalool in the site of HSA domain. The black dots represent protein and red dots represent interaction. Docking results of HSA-carvacrol system (e) Structure of HSA showing the subdomain and binding sites of carvacrol. The HSA is represented as a cartoon. (f) The 2D detailed view shows the interaction between carvacrol and its neighbouring residues. The green circles are residues participating in hydrogen bonds, charge or polar interactions. The pink circles are residues participating in alkyl and pi- alkyl bonds. (g) The 3D detailed view shows the interaction between carvacrol and its neighbouring residues Ser 193, Arg 197, His 146, Arg 145, Tyr 148 and Pro 147. (h). HB Plot of carvacrol in the site of HSA domain. The black dots represent protein and red dots represent interaction. Docking results of HSA-thymol system (i) Structure of HSA showing the subdomain and binding sites of thymol. The HSA is represented as a cartoon. (j) The 2D detailed view shows the interaction between thymol and its neighbouring residues. The green circles are residues participating in hydrogen bonds, charge or polar interactions. The pink circles are residues participating in alkyl and pi- alkyl bonds. (k) The 3D detailed view shows the interaction between thymol and its neighbouring residues Arg 197, His 146, Asp 108 and Ala 194. (l). HB Plot of thymol in the site of HSA domain. The black dots represent protein and red dots represent interaction.

References

    1. Kesavan S, Holland KT, Ingham E. The effects of lipid extraction on the immunomodulatory activity of Malassezia species in vitro. Medical Mycology. 2000;38(3):239–47. doi: 10.1080/mmy.38.3.239.247 - DOI - PubMed
    1. Schaller M, Borelli C, Korting HC, Hube B. Hydrolytic enzymes as virulence factors of Candida albicans. Mycoses. 2005;48(6):365–77. doi: 10.1111/j.1439-0507.2005.01165.x - DOI - PubMed
    1. Zore GB, Thakre AD, Jadhav S, Karuppayil SM. Terpenoids inhibit Candida albicans growth by affecting membrane integrity and arrest of cell cycle. Phytomedicine. 2011;18(13):1181–90. doi: 10.1016/j.phymed.2011.03.008 - DOI - PubMed
    1. Alviano W, Mendonça‐Filho R, Alviano D, Bizzo H, Souto‐Padrón T, Rodrigues M, et al.. Antimicrobial activity of Croton cajucara Benth linalool‐rich essential oil on artificial biofilms and planktonic microorganisms. Oral microbiology and immunology. 2005;20(2):101–5. doi: 10.1111/j.1399-302X.2004.00201.x - DOI - PubMed
    1. de Castro RD, de Souza TMPA, Bezerra LMD, Ferreira GLS, Costa EMMdB, Cavalcanti AL. Antifungal activity and mode of action of thymol and its synergism with nystatin against Candida species involved with infections in the oral cavity: an in vitro study. BMC complementary and alternative medicine. 2015;15:417-. doi: 10.1186/s12906-015-0947-2 . - DOI - PMC - PubMed

Publication types