. 2022 May 27;376(6596):eabe1505.
doi: 10.1126/science.abe1505. Epub 2022 May 27.

Chromatin profiles classify castration-resistant prostate cancers suggesting therapeutic targets

Affiliations

Chromatin profiles classify castration-resistant prostate cancers suggesting therapeutic targets

Fanying Tang et al. Science. .

Abstract

In castration-resistant prostate cancer (CRPC), the loss of androgen receptor (AR) dependence leads to clinically aggressive tumors with few therapeutic options. We used ATAC-seq (assay for transposase-accessible chromatin sequencing), RNA-seq, and DNA sequencing to investigate 22 organoids, six patient-derived xenografts, and 12 cell lines. We identified the well-characterized AR-dependent and neuroendocrine subtypes, as well as two AR-negative/low groups: a Wnt-dependent subtype, and a stem cell-like (SCL) subtype driven by activator protein-1 (AP-1) transcription factors. We used transcriptomic signatures to classify 366 patients, which showed that SCL is the second most common subtype of CRPC after AR-dependent. Our data suggest that AP-1 interacts with the YAP/TAZ and TEAD proteins to maintain subtype-specific chromatin accessibility and transcriptomic landscapes in this group. Together, this molecular classification reveals drug targets and can potentially guide therapeutic decisions.


Conflict of interest statement

Competing interests: Y.C. holds interest and receives royalties from ORIC pharmaceuticals.

C.N.S. Disclosures: Pfizer, Merck, AstraZeneca, Astellas Pharma, Bayer, Bristol Myers Squibb, Genzyme, Gilead, Incyte, Impact Pharma, Merck, Medscape, MSD, Pfizer, Roche, UroToday. L.E.D. is an advisory board member and holds equity in Mirimus Inc.. L.E.D. has consulted on gene editing and knockdown technologies for Volastra Therapeutics, Frazier Healthcare, FogPharma, and Revolution Medicines. F.T is an employee at AbbVie, L.P. is an employee at Loxo Oncology at Lilly and K.E. is an employee at Illumina. This work was completed prior to their employment at industry. They are acting on their own, and these endeavors are not in any manner affiliated with their current affiliations.

Figures
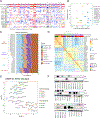
Fig. 1.
Fig. 1.. Classification of metastatic prostate cancer into four molecular subtypes from chromatin accessibility.
(A) Top: Genomic aberrations in the prostate onco-genome from the SU2C CRPC patient samples (10) and MSKPCa organoids. Bottom: Copy number landscape of the 15 patient-derived organoid lines and ten matching tumor tissues using MSK-IMPACT sequencing data. Shades of red and blue represent extent of gain and loss. (B) Number of mutations and fraction of copy number altered genome of the ten organoids and their matching patient tumor tissues. (C) Feature distribution of the mapped ATAC-seq peaks across all samples. (D) Correlation heatmap based on the normalized number of reads of the top 1% variable peaks across all samples. The ATAC-seq group and the sample source are indicated for each sample. The colors of the four ATAC-seq groups are kept consistent throughout the paper. (E) Unsupervised UMAP on the top 1% variable accessible peaks across all samples. (F) Immunoblot showing the expression of AR, SYP and GAPDH (control) across the 35 organoids, PDXs and cell lines.
Fig. 2.
Fig. 2.. Transcriptomic and genomic characterization of the four CRPC subtypes defined by ATAC-seq.
(A) Unsupervised UMAP on the mRNA expression values of the 1,000 most variably expressed genes across all samples. (B) Enrichment scores and P-values from GSEA indicate that the four signals are significantly positively enriched in specific subtypes but not in others. (C) Heatmap shows the relative expression of subtype-specific marker genes and basal/luminal genes across all samples. The ATAC-seq group and signature scores of the four representative pathways for each sample are shown at the top. (D) OncoPrint shows the genomic alterations of the 35 samples with DNA-sequencing data. MSKPCa8~20, 22 and 24 were sequenced with MSK- IMPACT. The SNVs and CNVs for cell lines (LNCaP, 22Rv1, VCaP, H660, DU145 and PC3) were collected from CCLE (Cancer Cell Line Encyclopedia). Whole-exome sequencing (WES) was performed for other samples.
Fig. 3.
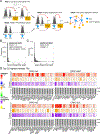
Fig. 3.. Identification of the key transcription factors (TFs) of each subtype.
(A) Schematic illustrating the construction of sample-specific regulatory networks using ATAC-seq and RNA-seq data. (B) Distribution of the number of genes linked per peak. (C) Distribution of the number of peaks linked per gene. (D) Rank order of the top 25 TFs for each of the four subtypes. For each TF, the relative contributions of 3 metrics to TF rank are shown (Expr, expression). In CRPC-SCL, FOSL1, BATF, FOSL1, JUNB, JDP2, FOS, MAFF, FOSB and ATF3 belong to the AP-1 family.
Fig. 4.
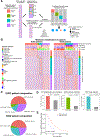
Fig. 4.. Classification of CRPC patients using transcriptomic signatures for the four subtypes.
(A) Schematic illustrating the assignment of each patient to one of the 4 groups using nearest template prediction. (B) Heatmaps showing relative expression of signature genes in SU2C and WCM patients. Top annotations indicate the AR score, NE score, pathology classification and molecular subtypes of each patient. (C) Patient compositions for SU2C and WCM cohorts. (D) AR amplification and mutation, WNT pathway component mutations and RB1 deep deletion are enriched in CRPC-AR, CRPC-WNT and CRPC-NE SU2C patients respectively (two-sided Fisher’s exact test). (E) CRPC-SCL patients exhibit shorter time on ARSI treatment compared to CRPC-AR SU2C patients.
Fig. 5.
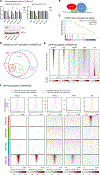
Fig. 5.. AP-1 works together with YAP, TAZ and TEAD in CRPC-SCL.
(A) Percentage of GFP-positive MSKPCa3 (left) or MSKPCa2 (right) expressing CRISPR guides against FOSL1 or sgR26 (negative control) or sgRPA3 (positive control). Mean ± SEM, multiple unpaired t-test comparing between passages (p1 vs. p0, p2 vs. p0, p3 vs. p0), n=2 for MSKPCa3, n=2 for MSKPCa2 (***p<0.001, **p<0.01, *p<0.05). Knockout of FOSL1 was confirmed in MSKPCa3 by Western blot. (B) Schematic showing the co-operation of AP-1 with YAP/TAZ and TEAD in CRPC-SCL samples. (C) GSEA plot showing enrichment of YAP/TAZ signature in CRPC-SCL organoids and cell lines compared to other samples. (D) Venn diagram showing the overlaps of FOSL1, TEAD, YAP and TAZ ChIP-seq peaks in MSKPCa3. Overlaps with more than 1,000 peaks are marked and those between YAP/FOSL1 (48 peaks) and YAP/FOSL1/TEAD (4 peaks) are not shown. (E) ChIP-seq signal of FOSL1, TAZ, TEAD1 and YAP in MSKPCa3, and AR (GSE61852) from LNCaP on the consensus peak set. (F) ChIP-seq signal of FOSL1, TAZ, TEAD1 and YAP in MSKPCa3, and AR (GSE61852) from LNCaP on subtype-specific ATAC-seq peaks. FOSL1, TEAD1, YAP and TAZ ChIP-seq peaks for MSKPCa3 show stronger signal at CRPC-SCL-specific ATAC-seq peaks while AR (GSE61852) ChIP-seq peaks have stronger signal in CRPC-AR-specific peaks.
Fig. 6.
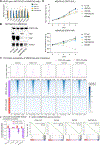
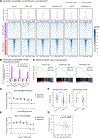
Fig. 6.. Impact of FOSL1, YAP, TAZ and YAP/TAZ knockdown.
(A) qPCR showing that double knockdown (KD) of YAP/TAZ by siRNA in MSKPCa3 leads to decreased expression of downstream target genes and FOSL1. Mean ± SD. Two-tailed unpaired t-test, n=3. Non-targeting (NT) siRNA serves as the negative control (****p<0.0001, **p<0.01, *p<0.05). (B) Western blot (WB) confirming the KD efficiency and the decrease of FOSL1 expression 72h after transfection in MSKPCa3. (C) Cell growth curves of MSKPCa3 and MSKPCa2 following siRNA KD. Mean ± SD, Two-tailed unpaired t test, n=8 for MSKPCa3, n=4 for MSKPCa2, ****p<0.0001, **p<0.01. (D) Chromatin accessibility changes upon FOSL1, TAZ, YAP and YAP/TAZ knockdown at CRPC-AR and CRPC-SCL peaks. (E) Average percentage of chromatin accessibility changes upon FOSL1, TAZ, YAP and YAP/TAZ knockdown compared to control at CRPC-AR and CRPC-SCL peaks (***p<0.001 based on permutation). (F) GSEA plots showing negative enrichment of YAP/TAZ target genes in MSKPCa3 upon KD of FOSL1, TAZ, YAP and YAP/TAZ.
Fig. 7.
Fig. 7.. Evidence of the role of the AP-1, YAP and TAZ in CRPC-SCL using overexpression, small molecule inhibition and patient transcriptomes.
(A) Chromatin accessibility changes upon FOSL1, TAZ/FOSL1, TAZ, YAP/FOSL1 and YAP overexpression in LNCaP cells at CRPC-AR and CRPC-SCL peaks. (B) Average percentage of chromatin accessibility changes upon FOSL1, TAZ/FOSL1, TAZ, YAP/FOSL1 and YAP overexpression in LNCaP comparing to control at CRPC-AR and CRPC-SCL peaks (***p<0.001 based on permutation). (C) OE of FOSL1 in LNCaP cells shows upregulation of CRPC-SCL signature genes. (D) Effect of verteporfin on MSKPCa2 (CRPC-AR) and MSKPCa3 (CRPC-SCL) cell growth. (E) Effect of T-5224 on MSKPCa2 and MSKPCa3 cell growth. (F) YAP/TAZ activity (sum of z-scores) is significantly higher in CRPC-SCL patients (one-tailed Wilcoxon rank-sum test). CRPC-SCL were compared to the other groups (****p<0.0001, **p<0.01). (G) YAP/TAZ activity is negatively correlated with AR expression across the 266 SU2C patients with Corr=−0.201 and P-value < 0.001.

Comment in

  • Uro-Science.
    Atala A. Atala A. J Urol. 2023 Jan;209(1):289-291. doi: 10.1097/JU.0000000000003033. Epub 2022 Oct 21. J Urol. 2023. PMID: 36268621 No abstract available.

References

    1. Watson PA, Arora VK, Sawyers CL, Emerging mechanisms of resistance to androgen receptor inhibitors in prostate cancer. Nat. Rev. Cancer 15, 701–711 (2015). - PMC - PubMed
    1. Quintanal-Villalonga Á et al., Lineage plasticity in cancer: a shared pathway of therapeutic resistance. Nat. Rev. Clin. Oncol 17, 360–371 (2020). - PMC - PubMed
    1. Rickman DS, Beltran H, Demichelis F, Rubin MA, Biology and evolution of poorly differentiated neuroendocrine tumors. Nat. Med 23, 664–673 (2017). - PubMed
    1. Beltran H et al., The Role of Lineage Plasticity in Prostate Cancer Therapy Resistance. Clin Cancer Res 25, 6916–6924 (2019). - PMC - PubMed
    1. Bluemn EG et al., Androgen Receptor Pathway-Independent Prostate Cancer Is Sustained through FGF Signaling. Cancer Cell 32, 474–4896 (2017). - PMC - PubMed

MeSH terms