. 2022 Jul 11;32(13):2980-2987.e5.
doi: 10.1016/j.cub.2022.05.020. Epub 2022 May 25.

Innate heuristics and fast learning support escape route selection in mice

Affiliations

Innate heuristics and fast learning support escape route selection in mice

Federico Claudi et al. Curr Biol. .

Abstract

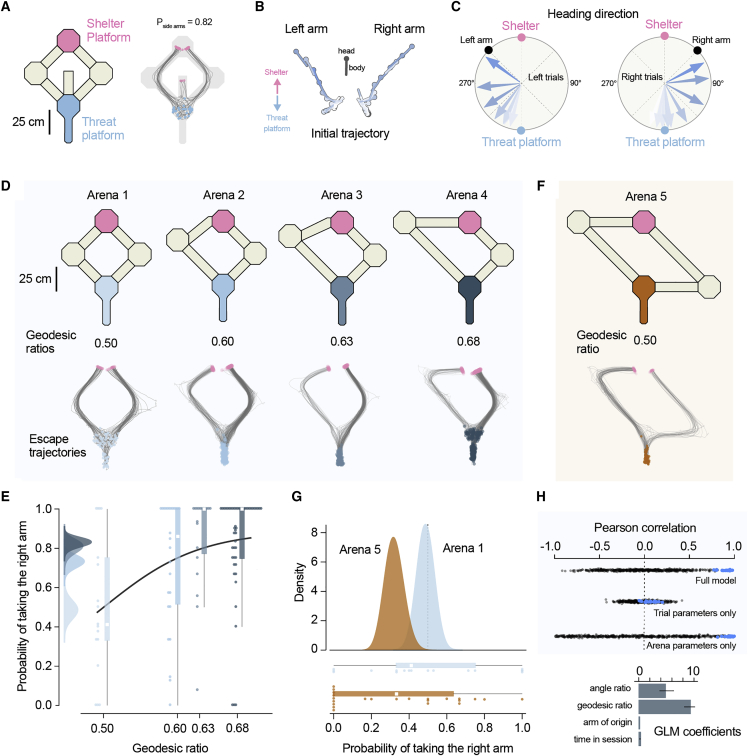
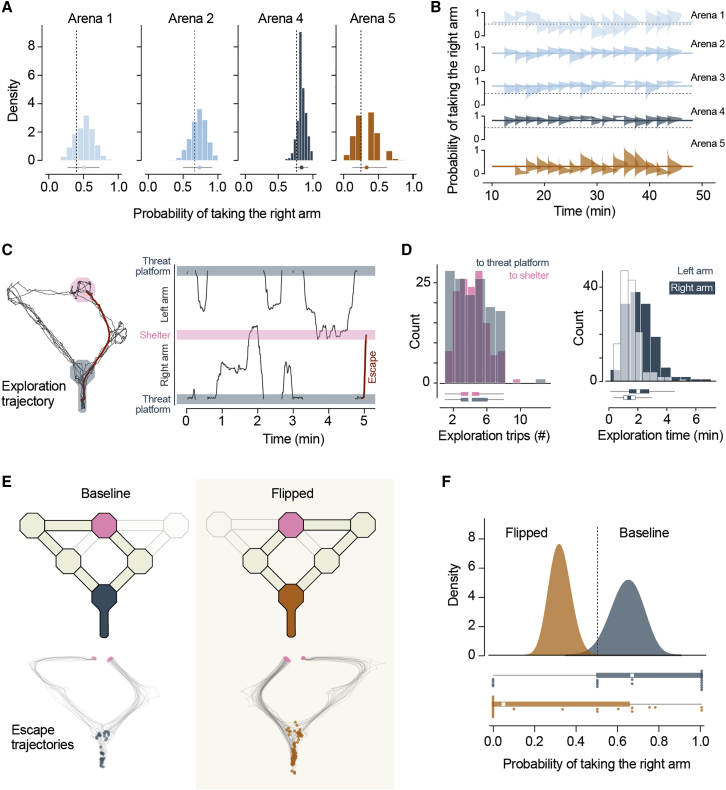
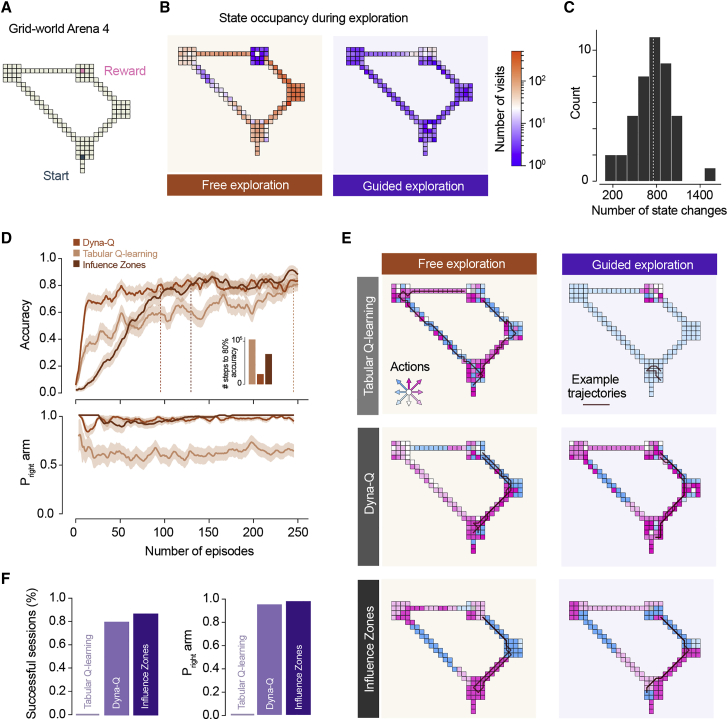
When faced with imminent danger, animals must rapidly take defensive actions to reach safety. Mice can react to threatening stimuli in ∼250 milliseconds1 and, in simple environments, use spatial memory to quickly escape to shelter.2,3 Natural habitats, however, often offer multiple routes to safety that animals must identify and choose from.4 This is challenging because although rodents can learn to navigate complex mazes,5,6 learning the value of different routes through trial and error during escape could be deadly. Here, we investigated how mice learn to choose between different escape routes. Using environments with paths to shelter of varying length and geometry, we find that mice prefer options that minimize path distance and angle relative to the shelter. This strategy is already present during the first threat encounter and after only ∼10 minutes of exploration in a novel environment, indicating that route selection does not require experience of escaping. Instead, an innate heuristic assigns survival value to each path after rapidly learning the spatial environment. This route selection process is flexible and allows quick adaptation to arenas with dynamic geometries. Computational modeling shows that model-based reinforcement learning agents replicate the observed behavior in environments where the shelter location is rewarding during exploration. These results show that mice combine fast spatial learning with innate heuristics to choose escape routes with the highest survival value. The results further suggest that integrating prior knowledge acquired through evolution with knowledge learned from experience supports adaptation to changing environments and minimizes the need for trial and error when the errors are costly.

Keywords: escape; fast learning; innate behavior; mouse; reinforcement learning; route selection; shelter.


Conflict of interest statement

Declaration of interests The authors declare no competing interests.

Figures

Figure 1
Figure 1
Escape route choice is determined by path distance and angle to shelter (A) Left: schematic view of arena 1 with a dead-end central arm. Right: movement tracking traces for all escape trials (grey). Blue and pink circles mark the start and end of each escape run, respectively. (B) Example trajectories on the threat platform for two escapes initiated in the left and right arm. The position of the head and body of the mouse is shown at 250 ms intervals. Color shows time elapsed from stimulus onset (later time points have darker shades of blue). (C) Average heading direction on the threat platform for left and right escapes. Each arrow shows the average heading directions at eight time points equally spaced between stimulus onset and exiting the threat platform (pooled across trials and animals). Color shows time elapsed from stimulus onset (later time points have darker shades of blue). (D) Top: arena schematic and corresponding geodesic ratio. Bottom: tracking traces from all trials in each arena with starting (blue) and end (pink) locations shown. (E) Probability of escape along the right path (Pright) in arenas 1 to 4. Scatter dots are Pright of individual mice, and boxplot shows median and interquartile range for all trials pooled for each arena. The left panel shows the posterior distributions of Pright from the Bayesian model (STAR Methods). (F) Top: schematic view of arena 5, with the same geodesic ratio of arena 1 but with a different angle ratio between the two arms. Bottom: tracking traces from all trials in arena 5 with start (orange) and end (pink) locations indicated. (G) Top: posterior distribution for Pright computed with the Bayesian model for all trials in arenas 1 and 5. Bottom: Pright of individual mice (scatter dots) with median and interquartile range for pooled data. (H) Top: cross-validated Pearson correlation between predicted Pright and observed choice behavior. Data shown for the full model and two partial models—trial parameters only (arm of origin and time) and arena parameters only (arm length and angle). Blue dots are fits to the data; black dots are fits to shuffled data. Bottom: coefficient weights for the four predictor variables included in the GLM (mean and standard deviation over repeated tests; STAR Methods). See also Figures S1 and S2 and Video S1, S2, and S4.
Figure 2
Figure 2
Route learning does not require escape experience and is flexible (A) Distributions of Pright for data subsets randomly sampled from all experienced trials in each arena (mean and 95th percentile confidence shown underneath). Dashed line shows Pright for naïve pooled across mice. (B) Change in Pright over time (within single experimental sessions). The posterior distribution of Pright calculated from trials binned by time in the experiment is shown for arenas 1–5 (trials pooled across animals). Solid line shows the Pright for the entire duration of the session. (C) Left: example movement trajectory during arena exploration. Right: the same trajectory on the left, linearized to show the position of the mouse in the arena over time. Red trace shows the trajectory for the first escape following the exploration period. (D) Left: histogram for the number of shelter-to-threat and threat-to-shelter trips during exploration across all experiments in arenas 1–5. Right: histogram for total time exploring the left and right arms, pooled across all arenas. (E) Top: schematics of the dynamic arena in baseline and flipped configurations. Bottom: movement tracking trajectories for escapes in the baseline and flipped conditions (blue and orange dots show initial location; pink dots show final position). (F) Top: Bayesian model posterior estimates of Pright for trials from the baseline and flipped conditions. Bottom: scatter dots show Pright for individual mice, and boxplot shows median and interquartile range for pooled trials. See also Video S3.
Figure 3
Figure 3
Model-based reinforcement agents with limited experience choose the shortest escape route (A) Schematic of the grid world arena used for RL simulations. (B) Heatmap for the number of visits to each state during ε-greedy (left) and guided (right) exploration (data from two representative simulations). (C) Distribution of number of state changes during guided exploration across sessions. (D) Learning curves for simulations under ε-greedy exploration. Top: accuracy for the different model classes tested (fraction of agents that reaches the goal state during the evaluation trial; traces are mean and standard error of the mean across multiple model instances). Dotted lines mark when 80% success rate is reached; inset shows number of training steps to reach 80% accuracy. Bottom: probability of choosing the right arm in successful trials during training for each RL model class. (E) Illustration of the policies for the different RL simulations after training. Inset arrows show all possible actions, and the respective colors are shown in the arena to represent the best action that each class of RL models learned for every state in the arena. Lines show two example trajectories from trained agents attempting to navigate from the start to the goal location. (F) Left: performance of agents trained under the guided exploration regime. Top: outcome (success or failure) for each class of RL algorithm across 42 sessions. Right: probability of taking the right arm in successful sessions. See also Figure S3 and Video S3.

References

    1. Evans D.A., Stempel A.V., Vale R., Ruehle S., Lefler Y., Branco T. A synaptic threshold mechanism for computing escape decisions. Nature. 2018;558:590–594. doi: 10.1038/s41586-018-0244-6. - DOI - PMC - PubMed
    1. Vale R., Evans D.A., Branco T. Rapid Spatial Learning Controls Instinctive Defensive Behavior in Mice. Curr. Biol. 2017;27:1342–1349. doi: 10.1016/j.cub.2017.03.031. - DOI - PMC - PubMed
    1. Shamash P., Olesen S.F., Iordanidou P., Campagner D., Banerjee N., Branco T. Mice learn multi-step routes by memorizing subgoal locations. Nat. Neurosci. 2021;24:1270–1279. doi: 10.1038/s41593-021-00884-8. - DOI - PubMed
    1. Cooper W., Jr., Cooper W.E., Jr., Blumstein D.T. Cambridge University Press; 2015. Escaping From Predators: An Integrative View of Escape Decisions.
    1. De Camp J.E. Relative distance as a factor in the white rat’s selection of a path. Psychobiology. 1920;2:245–253. doi: 10.1037/h0075411. - DOI

Publication types

LinkOut - more resources