. 2022 Sep 12;3(5):100330.
doi: 10.1016/j.xplc.2022.100330. Epub 2022 May 5.

A chromosome-level, haplotype-phased Vanilla planifolia genome highlights the challenge of partial endoreplication for accurate whole-genome assembly

Affiliations

A chromosome-level, haplotype-phased Vanilla planifolia genome highlights the challenge of partial endoreplication for accurate whole-genome assembly

Quentin Piet et al. Plant Commun. .

Abstract

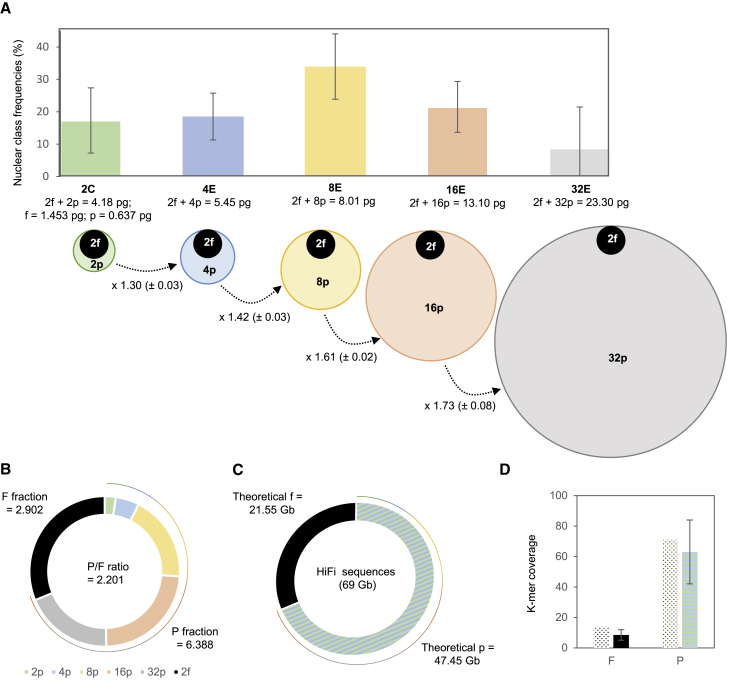
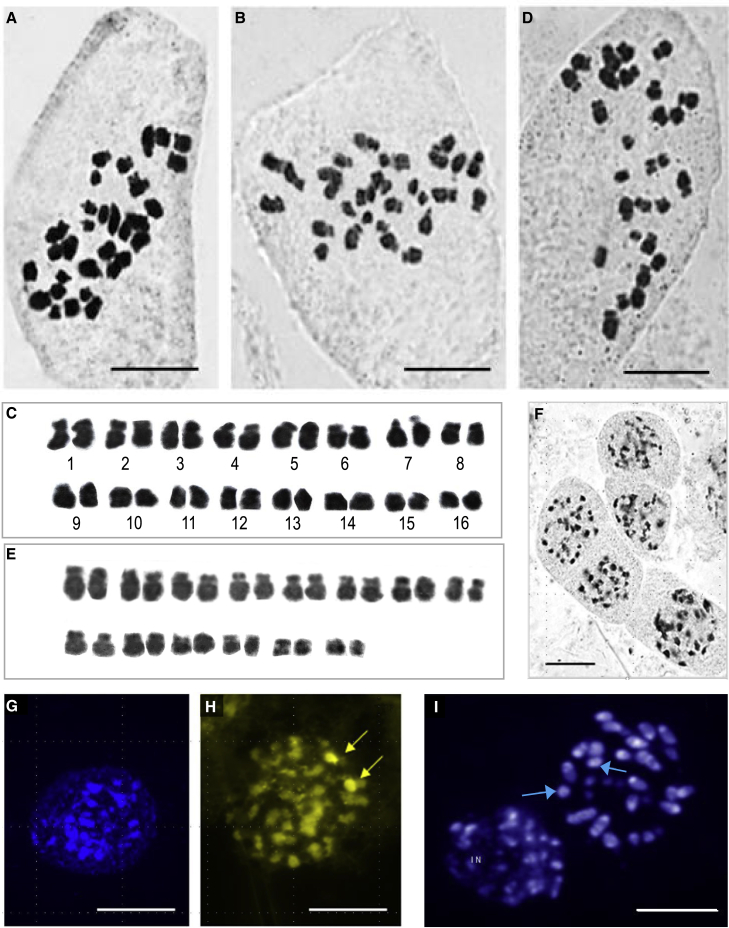
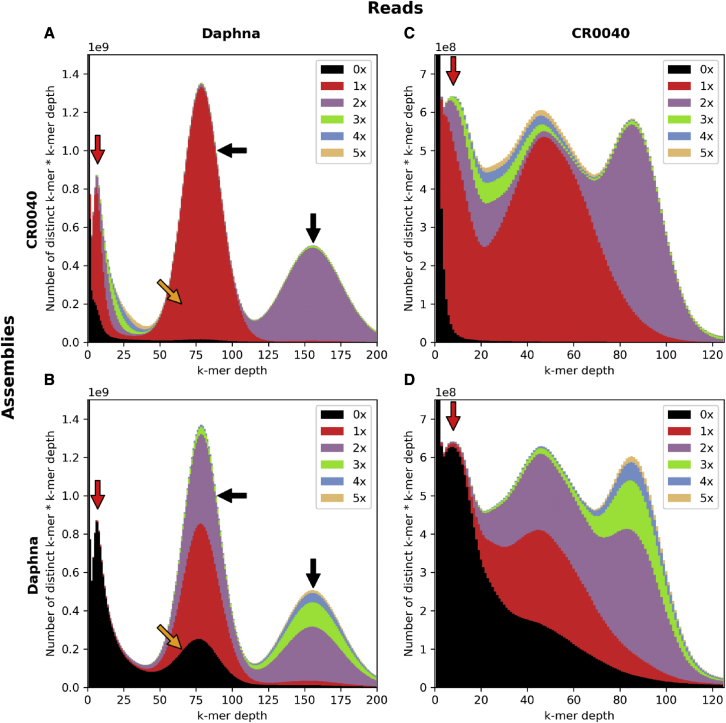
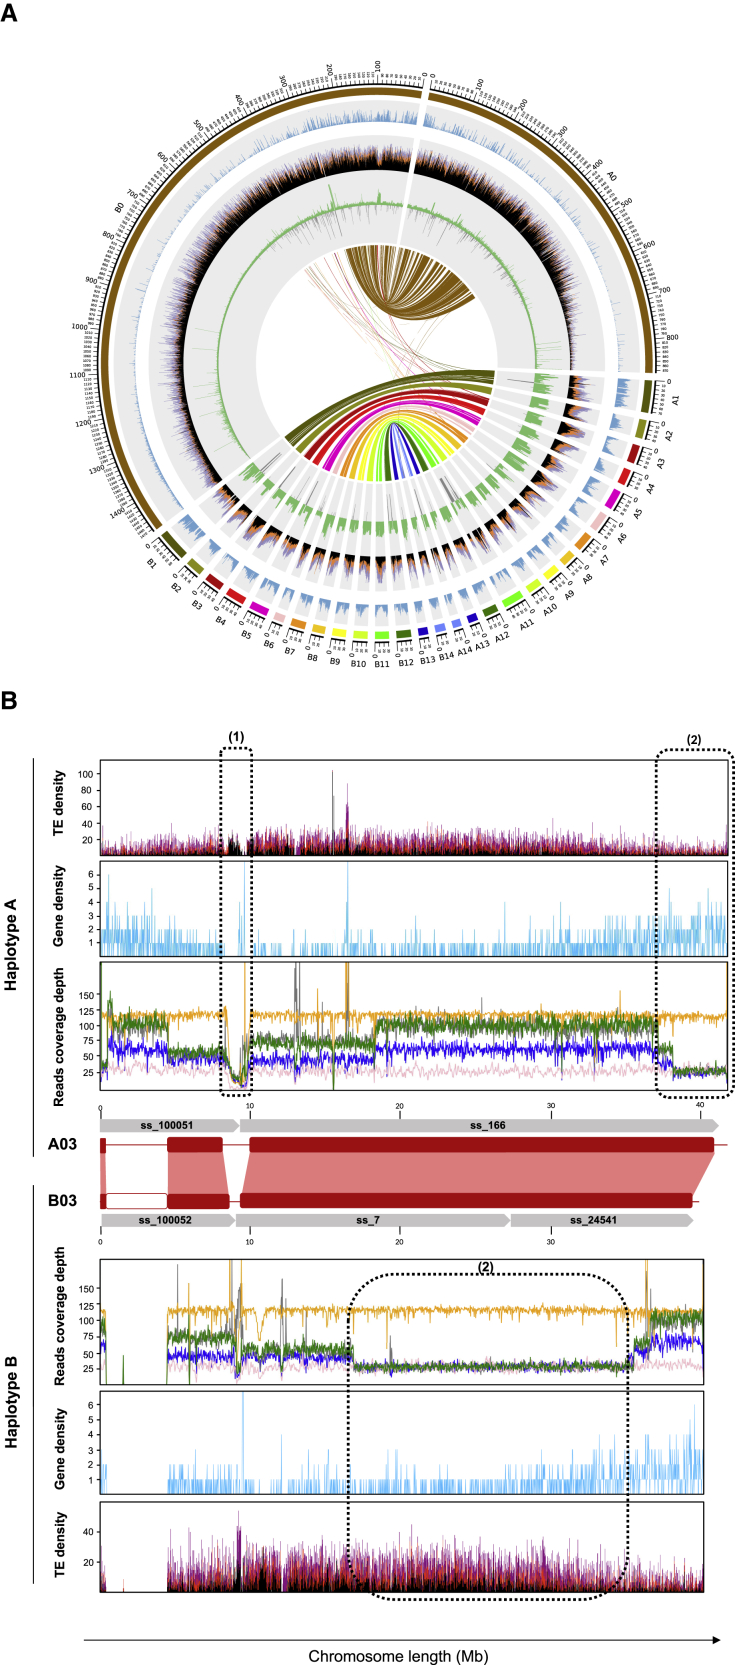
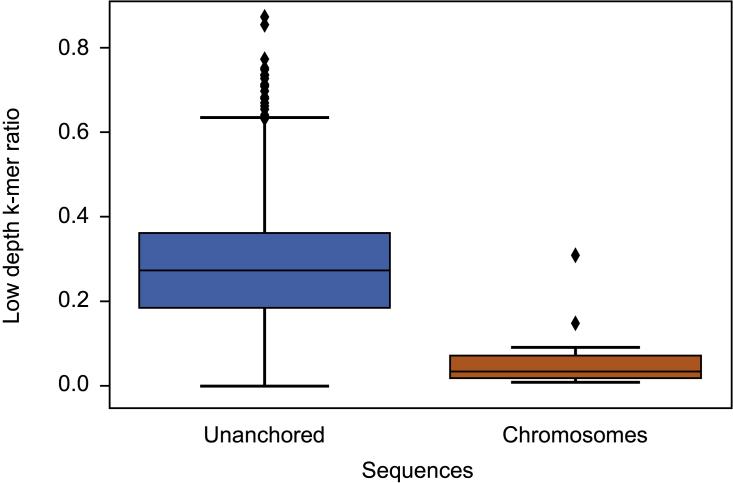
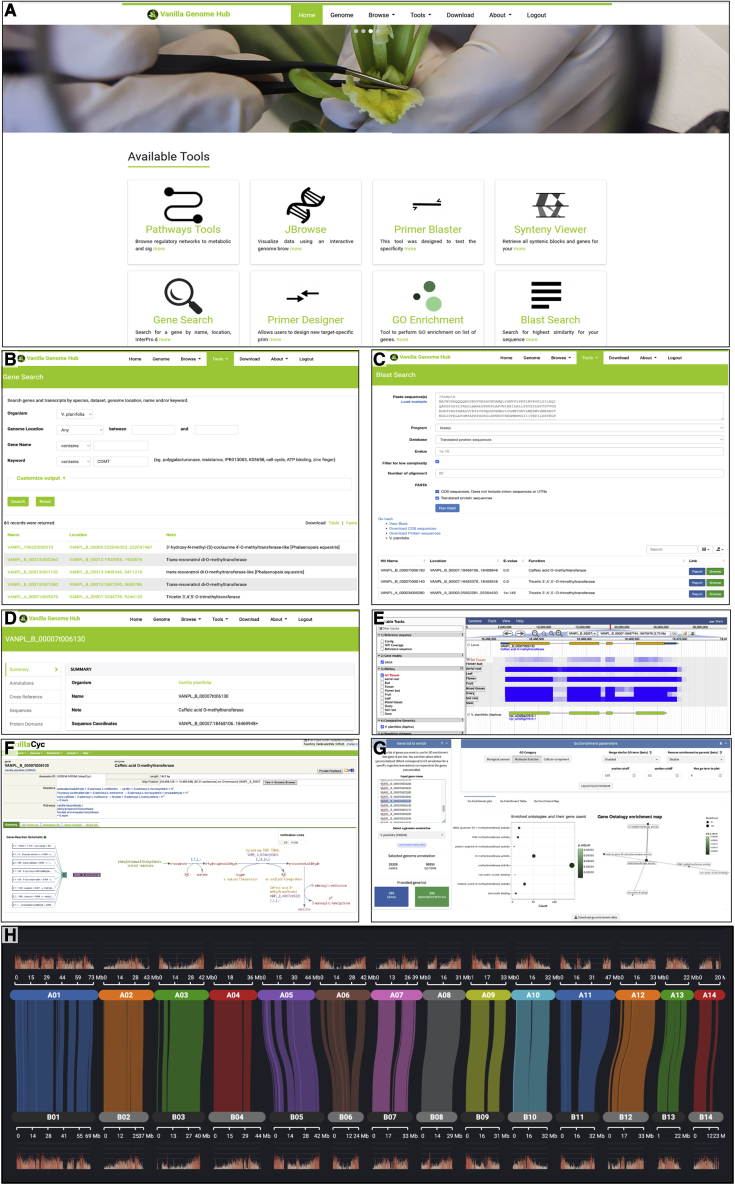
Vanilla planifolia, the species cultivated to produce one of the world's most popular flavors, is highly prone to partial genome endoreplication, which leads to highly unbalanced DNA content in cells. We report here the first molecular evidence of partial endoreplication at the chromosome scale by the assembly and annotation of an accurate haplotype-phased genome of V. planifolia. Cytogenetic data demonstrated that the diploid genome size is 4.09 Gb, with 16 chromosome pairs, although aneuploid cells are frequently observed. Using PacBio HiFi and optical mapping, we assembled and phased a diploid genome of 3.4 Gb with a scaffold N50 of 1.2 Mb and 59 128 predicted protein-coding genes. The atypical k-mer frequencies and the uneven sequencing depth observed agreed with our expectation of unbalanced genome representation. Sixty-seven percent of the genes were scattered over only 30% of the genome, putatively linking gene-rich regions and the endoreplication phenomenon. By contrast, low-coverage regions (non-endoreplicated) were rich in repeated elements but also contained 33% of the annotated genes. Furthermore, this assembly showed distinct haplotype-specific sequencing depth variation patterns, suggesting complex molecular regulation of endoreplication along the chromosomes. This high-quality, anchored assembly represents 83% of the estimated V. planifolia genome. It provides a significant step toward the elucidation of this complex genome. To support post-genomics efforts, we developed the Vanilla Genome Hub, a user-friendly integrated web portal that enables centralized access to high-throughput genomic and other omics data and interoperable use of bioinformatics tools.

Keywords: genome hub; optical mapping; partial endoreplication; vanilla; whole-genome sequencing.


Figures

Figure 1
Figure 1
Endoreplicated and non-endoreplicated fractions in the CR0040 Vanilla planifolia genome. (A) The histogram represents the distribution of nuclei in V. planifolia nodal tissues according to the partial endoreplication state of cells, from 2C (green) to 4E (blue), 8E (yellow), 16E (orange), and 32E (gray). The disks below represent the endoreplicated (colored) and non-endoreplicated (black) DNA content for each class of nuclei, proportionally to their mass (pg). The lowercase f and p denote the respective DNA quantities of the F fraction (fixed proportion of the haploid genome that cannot endoreplicate) and the P fraction (part that participates in endoreplication). The mean and the standard deviation (SD) of the interpeak ratio have been indicated below the dotted arrows. (B) F and P fractions and P/F ratio values obtained by flow cytometry and detailed for the P fraction for each nuclear class (2C, green; 4E, blue; 8E, yellow; 16E, orange; and 32E, gray). (C) Theoretical F and P fractions expected from HiFi sequencing and from flow-cytometry data. (D) Theoretical (dotted) and experimental k-mer coverages for F (black) and P (hatched) fractions.
Figure 2
Figure 2
Cytogenetic analysis of Vanilla planifolia CR0040. (A–D) Orcein staining: (A and B) mitotic metaphases with 2n = 32 chromosomes; (C) karyotype corresponding to (B); (D) hypoaneuploid mitotic metaphase with 2n = 28 chromosomes; (E) karyotype corresponding to (D); (F) interphase nuclei showing heterochromatic chromocenters; (G) DAPI-stained interphase nucleus showing unspecific heterochromatin; (H) chromomycin fluorochrome staining with two CMA+ regions (arrows) corresponding to rDNA sites; (I) Hoechst-stained AT-rich DNA in metaphase and interphase nucleus (IN), with two fully heterochromatinized chromosomes (arrows). Scale bars represent 10 μm.
Figure 3
Figure 3
Assembly k-mer content comparison between CR0040 PacBio HiFi long reads and Daphna Illumina short reads using spectra-cn graph. (A–D) The x axis represents k-mer multiplicity (counts), and the y axis indicates the number of distinct k-mers multiplied by their counts. Because of different sequencing depths between read sets, the y axis upper values are 109 for (A) and (B) and 108 for (C) and (D). The area colors indicate the number of k-mer copies found in the assembly (black: 0× or missing k-mers, red: 1×, purple: 2×, green: 3×, blue: 4×, and orange: 5×). Four spectra-cn plots are presented: (A) Daphna reads versus CR0040 assembly, (B) Daphna reads versus Daphna assembly, (C) CR0040 reads versus CR0040 assembly, and (D) CR0040 reads versus Daphna assembly. The red arrows point toward a low-coverage k-mer distribution not expected in a diploid genome assembly spectra-cn graph. The black arrows point toward the heterozygous (on the left) and homozygous (on the right) k-mer distributions expected in a diploid genome assembly. The orange arrows point toward missing k-mers in the heterozygous k-mer distribution. The lower the black distribution at this location, the fewer k-mers are missing in the assembly.
Figure 4
Figure 4
Overview of the assembled vanilla genome. (A) Circos plot of the genomic content along V. planifolia haplotypes A and B and the relationship between them. All tracks are divided into 500 kb genomic windows. From the outside to the inside of the circular representation, ideograms of 28 chromosomes and two random mosaic chromosomes that contain the unanchored scaffolds are shown. Gene density (blue) and interspersed repeat RepeatMasker hit density (black: retroelements; orange: long terminal repeat/Copia; purple: long terminal repeat/Gypsy) are shown. Sequencing depth was obtained by mapping CR0040 PacBio HiFi reads on the assembly (green) and N density (gray). Syntenic blocks across haplotypes are connected by lines in the innermost part of the figure. (B) Sequencing depth along the CR0040 A03 and B03 chromosomes (red rectangles) obtained by mapping Daphna Illumina (yellow) and ONT (pink) reads and CR0040 PacBio HiFi (blue), Nanopore (green), and Illumina (gray) reads onto the CR0040 assembly. Synteny between homologous chromosomes is represented by red boxes. Gaps (N stretches) that explain sudden drops in sequencing depth are shown with white blocks. (1) Low level of sequencing depth for all data is shown. (2) Inverted level of sequencing depth for CR0040 between haplotypes A and B and constant level of sequencing depth for both Daphna haplotypes are shown. Gene and retrotransposon distributions along the chromosomes are represented by a blue line chart and a stacked histogram (Copia: red; Gypsy: purple; other retrotransposons: black), respectively.
Figure 5
Figure 5
Ratio of k-mers within unanchored and anchored CR0040 genome. This boxplot shows the ratio of k-mers with a depth less than 15 in our HiFi reads within unanchored sequences (blue) and within chromosomes (orange).
Figure 6
Figure 6
Overview (screen shots) of some interoperable vanilla genome analysis tools integrated into the Vanilla Genome Hub. (A) Main menu. (B) Gene search (Tripal MegaSearch). (C) Sequence homology search (Blast). (D) Gene report (Tripal). (E) Genome Browser (JBrowse). (F) Metabolic pathway visualization (Pathway Tools). (G) Gene Ontology enrichment (DIANE). (H) Comparison of genomic sequences (SynVisio).

References

    1. Armstrong R.L., Penke T., Chao S.K., Gentile G.M., Strahl B.D., Matera A.G., McKay D.J., Duronio R.J. H3K9 promotes under-replication of pericentromeric heterochromatin in Drosophila salivary gland polytene chromosomes. Genes. 2019;10:93. doi: 10.3390/genes10020093. - DOI - PMC - PubMed
    1. Bhosale R., Boudolf V., Cuevas F., Lu R., Eekhout T., Hu Z.B., Van Isterdael G., Lambert G.M., Xu F., Nowack M.K., et al. A spatiotemporal DNA endoploidy map of the Arabidopsis root reveals roles for the endocycle in root development and stress adaptation. Plant Cell. 2018;30:2330–2351. doi: 10.1105/tpc.17.00983. - DOI - PMC - PubMed
    1. Bory S. Université de La Réunion; France: 2007. Diversity of Vanilla planifolia in the Indian Ocean and its Related Species : Genetics, Cytogenetics and Epigenetics Aspect.
    1. Bory S., Catrice O., Brown S., Leitch I.J., Gigant R., Chiroleu F., Grisoni M., Duval M.F., Besse P. Natural polyploidy in Vanilla planifolia (Orchidaceae) Genome. 2008;51:816–826. doi: 10.1139/G08-068. - DOI - PubMed
    1. Bourdon M., Pirrello J., Cheniclet C., Coriton O., Bourge M., Brown S., Moise A., Peypelut M., Rouyere V., Renaudin J.P., et al. Evidence for karyoplasmic homeostasis during endoreduplication and a ploidy-dependent increase in gene transcription during tomato fruit growth. Development. 2012;139:3817–3826. doi: 10.1242/dev.084053. - DOI - PubMed

Publication types

LinkOut - more resources