. 2022 May;10(5):e004297.
doi: 10.1136/jitc-2021-004297.

Bufalin stimulates antitumor immune response by driving tumor-infiltrating macrophage toward M1 phenotype in hepatocellular carcinoma

Affiliations

Bufalin stimulates antitumor immune response by driving tumor-infiltrating macrophage toward M1 phenotype in hepatocellular carcinoma

Zhuo Yu et al. J Immunother Cancer. 2022 May.

Abstract

Background: Immunotherapy for hepatocellular carcinoma (HCC) exhibits limited clinical efficacy due to immunosuppressive tumor microenvironment (TME). Tumor-infiltrating macrophages (TIMs) account for the major component in the TME, and the dominance of M2 phenotype over M1 phenotype in the TIMs plays the pivotal role in sustaining the immunosuppressive character. We thus investigate the effect of bufalin on promoting TIMs polarization toward M1 phenotype to improve HCC immunotherapy.

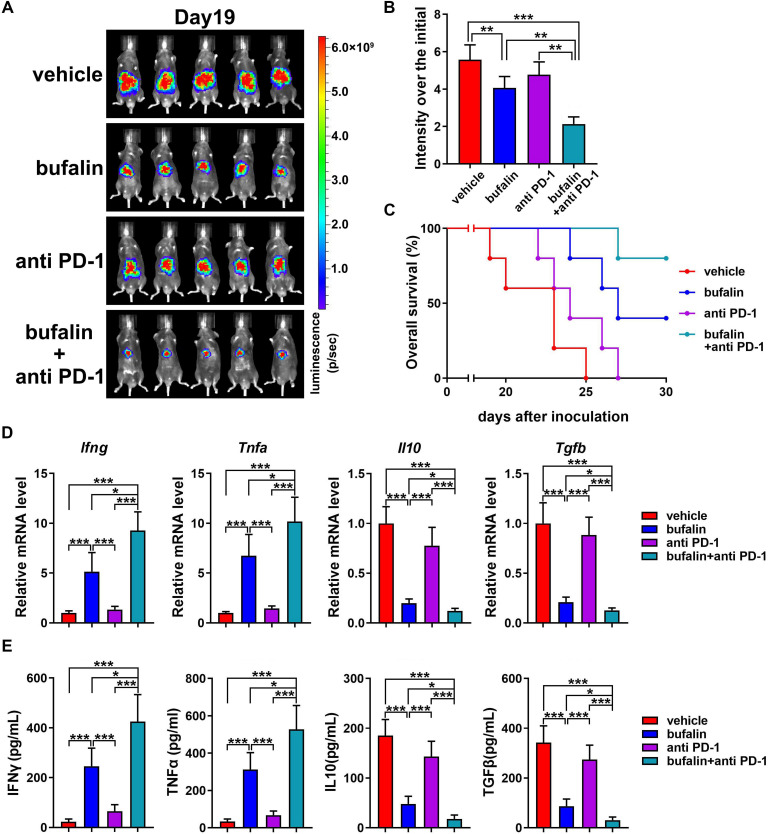
Methods: The impact of bufalin on evoking antitumor immune response was evaluated in the immunocompetent mouse HCC model. The expression profiling of macrophage-associated genes, surface markers and cytokines on bufalin treatment in vitro and in vivo were detected using flow cytometry, immunofluorescence, western blot analysis, ELISA and RT-qPCR. Cell signaling involved in M1 macrophage polarization was identified via the analysis of gene sequencing, and bufalin-governed target was explored by immunoprecipitation, western blot analysis and gain-and-loss of antitumor immune response. The combination of bufalin and antiprogrammed cell death protein 1 (anti-PD-1) antibody was also assessed in orthotopic HCC mouse model.

Results: In this study, we showed that bufalin can function as an antitumor immune modulator that governs the polarization of TIMs from tumor-promoting M2 toward tumor-inhibitory M1, which induces HCC suppression through the activation of effector T cell immune response. Mechanistically, bufalin inhibits overexpression of p50 nuclear factor kappa B (NF-κB) factor, leading to the predominance of p65-p50 heterodimers over p50 homodimers in the nuclei. The accumulation of p65-p50 heterodimers activates NF-κB signaling, which is responsible for the production of immunostimulatory cytokines, thus resulting in the activation of antitumor T cell immune response. Moreover, bufalin enhances the antitumor activity of anti-PD-1 antibody, and the combination exerts synergistic effect on HCC suppression.

Conclusions: These data expound a novel antitumor mechanism of bufalin, and facilitate exploitation of a new potential macrophage-based HCC immunotherapeutic modality.

Keywords: drug therapy, combination; immunotherapy; liver neoplasms; macrophages; tumor microenvironment.


Conflict of interest statement

Competing interests: None declared.

Figures

Figure 1
Figure 1
Bufalin induces antihepatocellular carcinoma (anti-HCC) immunity through the recruitment of macrophages. (A) Schematic diagram showed different treatments of HCC-bearing nude mice and C57BL/6 mice. (B) Nude mice and C57BL/6 mice treated by irradiation or splenectomy were given bufalin or vehicle after 1 week of the inoculation of Hepa1-6 cells in the liver (n=5 per group). Representative liver images are shown, and tumor growth was monitored on bufalin treatment. Scale bar=10 mm. (C) Inhibitory rates of tumor growth by bufalin in nude mice or C57BL/6 mice were calculated relative to vehicle treatment. (D) Pro-inflammatory and anti-inflammatory cytokines in the liver were measured by ELISA analysis. (E) The subsets of liver-infiltrating immune cells were measured. (F) Tumor growth was detected in HCC-bearing C57BL/6 mice treated with vehicle, liposomes, bufalin, clodronate liposomes (CL) and the combination of bufalin and CL, respectively. All data are shown as mean±SEM. NS, no significant; *p<0.05, **p<0.01, ***p<0.001.
Figure 2
Figure 2
Bufalin drives the polarization of the recruited macrophages to M1 phenotype. (A) Tumor-infiltrating macrophages (TIMs) were isolated from the liver of hepatocellular carcinoma (HCC)-bearing C57BL/6 mice treated with vehicle or bufalin. The proportion of M1 and M2 macrophages were determined by flow cytometry (FACS). (B) The expression of M1-assocated costimulatory molecules of CD80, CD11c, major histocompatibility complex (MHC)-II and CCR7 on the surface of macrophages was detected by FACS. (C) Different regulation of M1-associated and M2-associated genes from HCC tissues on vehicle or bufalin treatment was shown in hierarchical cluster heatmap. (D) Quantitative RT-PCR analysis was performed to examine the mRNA level of M1-associated and M2-associated molecules from HCC tissues on vehicle or bufalin treatment. (E) Representative histopathology and immunohistochemistry of resected HCC tissues were presented to show HCC development and tumor-infiltrating macrophages (TIMs) polarization. Scale bar=20 µm. Data are presented as mean±SEM. **P<0.01.
Figure 3
Figure 3
Bufalin drives the conversion of M2 to M1 macrophages. (A) Schematic diagram showed the polarization of macrophages affected by bufalin. (B) Bone marrow-derived macrophages (BMDMs) were treated with common medium or Hepa1-6 conditioned medium (CM) in the presence of bufalin or vehicle. The proportion of M1 and M2 macrophages were determined by flow cytometry (FACS). (C) Representative immunofluorescence images (×200-fold) show the expression of CD206 and CD86 in the BMDMs on vehicle or bufalin treatment. 4′,6-Diamidino-2-phenylindole was used to counterstain the nuclei. Scale bar=50 µm. (D) The levels of interleukin (IL)-12 and IL-10 in the supernatant of vehicle-primed or bufalin-primed macrophages were measured by ELISA, and the IL-12/IL-10 ratio was calculated. (E) The transcription level of M1-associated and M2-associated cytokines was detected in the BMDMs on bufalin treatment. (F) The transcription level of M1-associated and M2-associated molecules was detected in Hepa1-6 CM-treated BMDMs followed by bufalin treatment. (G) FACS was performed to detect the expression of M1-associated and M2-associated molecules in Hepa1-6 CM-treated BMDMs followed by bufalin treatment. Data are shown as mean±SEM. *P<0.05, **p<0.01, ***p<0.001.
Figure 4
Figure 4
Bufalin provokes T cell activation and hepatocellular carcinoma (HCC) suppression via driving M1 polarization. (A) Schematic diagram showed the activity of CD4+ or CD8+ T cells affected by bufalin-primed macrophages or control. (B) The isolated CD4+ or CD8+ T cells were labeled with carboxyfluorescein succinimidyl ester (CFSE) and co-cultured with vehicle-primed or bufalin-primed bone marrow-derived macrophages (BMDMs) or alone in the presence or absence of anti-CD3 and anti-CD28 antibodies. The percentage of CFSElow proliferative CD4+ and CD8+ T cells were determined by flow cytometry (FACS). (C) The secretion of interferon (IFN)-γ and tumor necrosis factor (TNF)-α from CD4+ or CD8+ T cells was examined by ELISA. (D) The mRNA level of T-bet in CD4+ and CD8+ T cells co-cultured with bufalin-primed BMDMs was detected by quantitative RT-PCR. (E) The protein level of T-bet in CD4+ and CD8+ T cells co-cultured with bufalin-primed BMDMs was detected by western blot analysis. (F) The protein level of ICOS and granzyme B in CD8+ T cells co-cultured with bufalin-primed BMDMs was detected by western blot analysis. (G) The expression of IL-2, IFN-γ, IL-4 and IL-13 released by CD4+ T cells co-cultured with bufalin-primed BMDMs were determined by ELISA. Data are shown as mean±SEM. *P<0.05, **p<0.01, ***p<0.001.
Figure 5
Figure 5
Bufalin inhibits p50 nuclear factor kappa B (NF-κB) expression to drive M1 polarization. (A) Signaling pathway enrichment analysis of different expressed genes in bufalin-primed bone marrow-derived macrophages (BMDMs) was performed by KEGG. (B) Gene set enrichment analysis showed the positive significant connection of NF-κB signaling activation with bufalin treatment compared with vehicle control. (C) The transcription level of pro-inflammatory and anti-inflammatory cytokines was detected in the vehicle-treated or bufalin-treated BMDMs in the presence or absence of cardamonin (CA). (D) Representative immunofluorescence image (×200-fold) show the expression and distribution of p65 and p50 NF-κB in vehicle-treated or bufalin-treated BMDMs in the presence or absence of JSH-23. Scale bar=50 µm. (E) The expression of p50 and p65 NF-κB in the nuclei and cytoplasm of the BMDMs on vehicle or bufalin treatment was detected by western blot analysis. Lamin and β-actin were used as loading control in the nuclei and cytoplasm, respectively. (F) Ubiquitination of p50 in vehicle-treated or bufalin-treated BMDMs were detected by western blot analysis. Equal amount of protein was immunoprecipitated by anti-p50 antibody and immunoblotted by anti-ubiquitin antibody. Data are shown as mean±SEM. *P<0.05, **p<0.01, ***p<0.001.
Figure 6
Figure 6
Overexpression of p50 nuclear factor kappa B (NF-κB) blocks the macrophage-dependent T cell activation induced by bufalin. (A) The transcription level of M1-associated pro-inflammatory cytokines and stimulatory factors was detected in the vehicle-treated or bufalin-treated bone marrow-derived macrophages (BMDMs) transfected with p50-expressing plasmid or vector control. (B) Flow cytometry (FACS) was performed to detect the effect of p50 overexpression on reversing bufalin-driven M1 polarization to M2 macrophage. (C) Tumor volumes were detected in the hepatocellular carcinoma (HCC)-bearing C57BL/6 mice on vehicle or bufalin treatment with or without p50 NF-κB delivery for 5 weeks (n=5). (D) Overall survival of the above mice with different indicated treatment was assessed. (E) The effect of p50 overexpression on the proportion of M1 and M2 macrophages in the liver tumor was determined by FACS in HCC-bearing mice with different treatments. (F) The effect of p50 overexpression on the percentage of CD4+ and CD8+ T cells in the liver tumor was examined by FACS in HCC-bearing mice with different treatments. (G) The transcription level of the chemokines Cxcr3, Ccr5, Cxcr6 and Ccl5, or (H) of antitumor cytokines Ifng and Il2, and stimulatory molecules Icos and Gzmb was detected by quantitative RT-PCR in the liver tumor on vehicle or bufalin treatment with or without p50 overexpression. Data were presented as mean±SEM. *P<0.05, **p<0.01, ***p<0.001.
Figure 7
Figure 7
Bufalin enhances the antitumor efficacy in the combination with antiprogrammed cell death protein 1 (anti-PD-1) antibody (Ab). (A) Hepatocellular carcinoma (HCC)-bearing C57BL/6 mice were treated with vehicle, bufalin, anti-PD-1 Ab and the combination. Bioluminescence images of livers in various groups are shown at day 19 after HCC cell inoculation (n=5). (B) Tumor volume in various groups was measured at the end of the experiments. (C) Overall survival of HCC-bearing mice in various groups was assessed. (D) The transcription level and (E) the expression of inflammatory cytokines interferon (IFN)-γ, tumor necrosis factor (TNF)-α, interleukin (IL)-10 and transforming growth factor (TGF)-β in the liver tumor with different treatment were measured by quantitative RT-PCR and ELISA, respectively. Data are presented as mean±SEM. *P<0.05; **p<0.01; ***p<0.001.

References

    1. Siegel RL, Miller KD, Jemal A. Cancer statistics, 2020. CA Cancer J Clin 2020;70:7–30.10.3322/caac.21590 - DOI - PubMed
    1. Huang A, Yang X-R, Chung W-Y, et al. . Targeted therapy for hepatocellular carcinoma. Signal Transduct Target Ther 2020;5:146.10.1038/s41392-020-00264-x - DOI - PMC - PubMed
    1. Yoh T, Seo S, Taura K, et al. . Surgery for recurrent hepatocellular carcinoma: achieving long-term survival. Ann Surg 2021;273:792–9.10.1097/SLA.0000000000003358 - DOI - PubMed
    1. Forner A, Reig M, Bruix J. Hepatocellular carcinoma. Lancet 2018;391:1301–14.10.1016/S0140-6736(18)30010-2 - DOI - PubMed
    1. Kurebayashi Y, Ojima H, Tsujikawa H, et al. . Landscape of immune microenvironment in hepatocellular carcinoma and its additional impact on histological and molecular classification. Hepatology 2018;68:1025–41.10.1002/hep.29904 - DOI - PubMed

Publication types