. 2022 May 1;36(9-10):566-581.
doi: 10.1101/gad.349393.122. Epub 2022 May 26.

Unique role for lncRNA HOTAIR in defining depot-specific gene expression patterns in human adipose-derived stem cells

Affiliations

Unique role for lncRNA HOTAIR in defining depot-specific gene expression patterns in human adipose-derived stem cells

Edina Erdos et al. Genes Dev. .

Abstract

Accumulation of fat above the waist is an important risk factor in developing obesity-related comorbidities independently of BMI or total fat mass. Deciphering the gene regulatory programs of the adipose tissue precursor cells within upper body or abdominal (ABD) and lower body or gluteofemoral (GF) depots is important to understand their differential capacity for lipid accumulation, maturation, and disease risk. Previous studies identified the HOX transcript antisense intergenic RNA (HOTAIR) as a GF-specific lncRNA; however, its role in adipose tissue biology is still unclear. Using three different approaches (silencing of HOTAIR in GF human adipose-derived stem cells [GF hASCs], overexpression of HOTAIR in ABD hASCs, and ChIRP-seq) to localize HOTAIR binding in GF hASC chromatin, we found that HOTAIR binds and modulates expression, both positively and negatively, of genes involved in adipose tissue-specific pathways, including adipogenesis. We further demonstrate a direct interaction between HOTAIR and genes with high RNAPII binding in their gene bodies, especially at their 3' ends or transcription end sites. Computational analysis suggests HOTAIR binds preferentially to the 3' ends of genes containing predicted strong RNA-RNA interactions with HOTAIR. Together, these results reveal a unique function for HOTAIR in hASC depot-specific regulation of gene expression.

Keywords: HOTAIR; RNAPII; RNA–RNA interaction; adipose-derived stem cells; fat distribution; subcutaneous adipose tissue; transcriptome.


Figures

Figure 1.
Figure 1.
HOTAIR regulates genes related to EMT, TNFα signaling, adipogenesis, and G2M/E2F target pathways in hASCs. (A,B) Volcano plots show differentially expressed genes (DEGs) after HOTAIR silencing (si) in GF-derived hASCs (A) and HOTAIR overexpression (oe) in ABD-derived hASCs (B). N = 4 subjects, P-value < 0.05. Genes repressed or activated by HOTAIR are colored yellow or blue, respectively. (C) UpSet plot showing the common DEGs after HOTAIR silencing in GF hASCs and overexpression in ABD hASCs. (Yellow) Genes repressed by HOTAIR, (blue) genes activated by HOTAIR. (D) Heat map representation of the expression levels of genes repressed (yellow) or activated (blue) by HOTAIR associated with epithelial–mesenchymal transition (EMT), TNFα signaling, adipogenesis, and G2M/E2F target pathways. Key genes are highlighted, and a comprehensive list is in Supplemental Table S1.
Figure 2.
Figure 2.
Genomic characterization of HOTAIR ChIRP-seq peaks. (A) Bar graph representing the genomic distribution of the 36,612 HOTAIR ChIRP peaks in GF-derived hASCs. (B) Motif enrichment analysis for the top 10,000 HOTAIR ChIRP peaks. Enriched motif matrices are presented along with the P-value. The percentages of each motif found in the target (% of target) and background (% of bg) genomic regions are indicated. The HOMER similarity score is indicated in parentheses after the name. (C) Heat map representation of the read density around the center of HOTAIR ChIRP-seq peaks (±500 bp), with genomic distribution (right) grouped by the presence (red, 1) or absence (gray, 2) of the polyadenylation signal motif. (D) Heat map showing gene-associated HOTAIR ChIRP-seq signal at gene-coding regions, including 2 kb upstream of TSSs and 2 kb downstream from TESs. (E) Plot showing the significant pathways related to the top 5000 genes, with ChIRP-seq peaks ranked by RPKM (reads per kilobase per million). Gene set ratios are represented along with the P-value. Pathways with P-value < 0.01 are represented.
Figure 3.
Figure 3.
Chromatin features of HOTAIR direct and indirect target genes in GF hASCs. (A) ChromHMM heat map representation of data from an independent set of the same four GF hASCs used for the silencing experiment in Figure 1. Signals around the 4774 DEGs after HOTAIR silencing (from Fig. 1A) were analyzed and separated into those with HOTAIR (left) or without HOTAIR (right) ChIRP-seq peaks in their gene bodies. (Enh-Biv) Enhancer bivalent, (EnhG) enhancer, (Repr) repressed, (TssA) active transcription start site, (TssAFlnk) active transcription start site-flanking regions, (TssBiv) bivalent transcription start site, (Tx) transcription. (B) Screenshot showing HOTAIR ChIRP, RNAPII, H3K4me2, and H3K27me3 binding sites at IGFBP4 and EGR1 genes in GF hASCs. (C) Motif enrichment analysis at the promoters of DEGs after silencing overlapping with (+HOTAIR) or without (−HOTAIR) HOTAIR ChIRP peaks. Enriched motif matrices are presented along with the P-value. The percentages of each motif found in the target (% of target) and background (% of bg) genomic regions are indicated. HOMER similarity score is indicated in parentheses after the name. (D) Histograms show HOTAIR binding (ChIRP-seq), RNAPII binding, H3K27me3 signal, and H3K2me3 signal (ChIP-seq) around the DEGs from A. +HOT or −HOT indicates genes from the left or right graphs in A, respectively. (TES) Transcription end site. (E) Box plots show H3K27me3, H3K4me2, RNAPII ChIP-seq, and HOTAIR ChIRP-seq average read densities around the TSSs (top) or TESs (bottom) of the DEGs from B. Unpaired two-sample Wilcoxon test. (****) P-value < 0.0001, (ns) not significant. (TSS) Transcription start site, (TES) transcription end site. (F) Box plots represent the HOTAIR RPKM from the ChIRP-seq (Y-axis) of genes relative to their expression level (X-axis), separated into three quantiles representing overall high, medium, or low expression in control GF hASCs. N = 4. Data for the DEGs affected by HOTAIR silencing from Figure 1 are represented. Unpaired two-sample Wilcoxon test. (****) P-value < 0.0001, (**) P-value < 0.01.
Figure 4.
Figure 4.
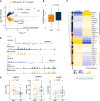
Key genes associated with HOTAIR regulation and differential RNAPII binding between ABD (orange) and GF (dark blue) hASCs. (A) Volcano plot representing the 208 genes with HOTAIR ChIRP-seq peaks and differential RNAPII bindings between ABD hASCs and GF hASCs. P < 0.05. (B) Box plot showing the HOTAIR RPKM at genes with differential RNAPII binding between ABD and GF hASCs. N = 4 subjects. Unpaired two-sample Wilcoxon test was used for statistical analysis. (ABD) ABD-RNAPII binding-specific genes, (GF) GF-RNAPII binding-specific genes. (C) Heat map showing DEGs affected by HOTAIR (silencing or overexpression from Fig. 1) associated with differential RNAPII binding between ABD (orange) and GF (dark blue) hASCs. An asterisk marks genes involved in the TNFα signaling pathway at P = 0.0074. (D) IGV genome browser view of HOTAIR ChIRP-seq peaks in GF hASCs (light blue) and RNAPII peaks in GF (dark blue) and ABD hASCs (orange) around ENPP2 and ABCA1 genes. (E) Box plots depict ABCA1, ENPP2, and THRB expression levels in ABD and GF hASCs in each subject based on RNA-seq data. N = 18 subjects. Paired-sample Wilcoxon tests were used for statistical analysis. Lines are drawn connecting values from ABD versus GF hASCs from the same individual.
Figure 5.
Figure 5.
Genes associated with RNA–RNA interactions in 3′ UTRs overlap with presence of HOTAIR ChIRP peaks. (A) Bar graphs show the location of RNA–RNA interactions between HOTAIR and the full transcriptome. +HOT or −HOT indicates genes with or without HOTAIR ChIRP-seq peaks, respectively. (UTR5) Untranslated region on the 5′ side, (UTR3) untranslated region on the 3′ side, (ncRNA) noncoding RNA, (CDS) coding sequence. (B) Violin plots show the sum of the local interaction energies (SumEnergy) between HOTAIR and other RNA based on the location of predicted interactions. Differences are shown between genes with HOTAIR (+HOT) or without HOTAIR (−HOT) ChIRP signals. Unpaired two-sample Wilcoxon test was used. (C) Histograms represent the normalized HOTAIR ChIRP-seq, RNAPII, H3K27me3, and H3K4me2 ChIP-seq signals around genes with predicted RNA–RNA interactions in 3′ UTRs in control GF hASCs. (D) Box plot showing the expression level of genes with predicted RNA–RNA interactions in 3′ UTRs in control GF hASCs. N = 4. +HOT or −HOT indicates genes with or without HOTAIR ChIRP-seq peaks, respectively. Unpaired two-sample Wilcoxon test was used.
Figure 6.
Figure 6.
Regulatory mechanisms of HOTAIR lncRNA with hnRNPA2B1 in adipose-derived stem cells. (A) Heat map showing 5409 differentially expressed genes after silencing hnRNPA2B1 (si-hnRNP) in HEK293T cells (raw data from Huelga et al. 2012). (B) Venn diagram showing the number of unique and common DEGs after hnRNPA2B1 silencing in HEK293T and after HOTAIR silencing in GF hASCs. The bar graph shows the percentage of common DEGs with or without HOTAIR ChIRP peaks. (C) Histograms represent the normalized HOTAIR ChIRP-seq, RNAPII, and hnRNPA2B1 ChIP-seq signals around common DEGs after hnRNPA2B1 and HOTAIR silencing. Differences are shown between DEGs with HOTAIR (+HOT) and without HOTAIR (−HOT) ChIRP signals. (D) Screenshot showing HOTAIR ChIRP, hnRNPA2B1, and RNAPII ChIP-seq signals at the COL1A1 gene in GF hASCs. (E) Histograms represent the normalized hnRNPA2B1 ChIP-seq signals around genes with predicted RNA–RNA interactions in 3′ UTRs in GF hASCs from Figure 5. Differences are shown between DEGs with HOTAIR (+HOT) and without HOTAIR (−HOT) ChIRP signals. (F) Bar graph showing ChIP-qPCR for hnRNPA2B1 binding at DEGs after HOTAIR silencing with HOTAIR ChIRP binding sites in 3′ UTRs from four GF hASCs. N = 4. IgG was used as control. Unpaired t-test was used. P < 0.05 was significant. (G) Schematic representation of one of the potential HOTAIR lncRNA-mediated gene expressions with the “matchmaker” hnRNPA2B1 protein. In this model, HOTAIR recognizes chromatin by binding to the nascent mRNA.

References

    1. Anveden Å, Sjöholm K, Jacobson P, Palsdottir V, Walley AJ, Froguel P, Al-Daghri N, McTernan PG, Mejhert N, Arner P, et al. 2012. ITIH-5 expression in human adipose tissue is increased in obesity. Obesity 20: 708–714. 10.1038/oby.2011.268 - DOI - PubMed
    1. Baglioni S, Cantini G, Poli G, Francalanci M, Squecco R, Di Franco A, Borgogni E, Frontera S, Nesi G, Liotta F, et al. 2012. Functional differences in visceral and subcutaneous fat pads originate from differences in the adipose stem cell. PloS one 7: e36569. 10.1371/journal.pone.0036569 - DOI - PMC - PubMed
    1. Balas MM, Hartwick EW, Barrington C, Roberts JT, Wu SK, Bettcher R, Griffin AM, Kieft JS, Johnson AM. 2021. Establishing RNA–RNA interactions remodels lncRNA structure and promotes PRC2 activity. Sci Adv 7: eabc9191. 10.1126/sciadv.abc9191 - DOI - PMC - PubMed
    1. Barish GD, Yu RT, Karunasiri MS, Becerra D, Kim J, Tseng TW, Tai LJ, Leblanc M, Diehl C, Cerchietti L, et al. 2012. The Bcl6–SMRT/NCoR cistrome represses inflammation to attenuate atherosclerosis. Cell Metab 15: 554–562. 10.1016/j.cmet.2012.02.012 - DOI - PMC - PubMed
    1. Boney CM, Moats-Staats BM, Stiles AD, D'Ercole AJ. 1994. Expression of insulin-like growth factor-I (IGF-I) and IGF-binding proteins during adipogenesis. Endocrinology 135: 1863–1868. 10.1210/endo.135.5.7525256 - DOI - PubMed

Publication types

Substances