. 2022 Jun;43(6):872-880.
doi: 10.3174/ajnr.A7529. Epub 2022 May 26.

Nonlesional Sources of Contrast Enhancement on Postgadolinium "Black-Blood" 3D T1-SPACE Images in Patients with Multiple Sclerosis

Affiliations

Nonlesional Sources of Contrast Enhancement on Postgadolinium "Black-Blood" 3D T1-SPACE Images in Patients with Multiple Sclerosis

L Danieli et al. AJNR Am J Neuroradiol. 2022 Jun.

Abstract

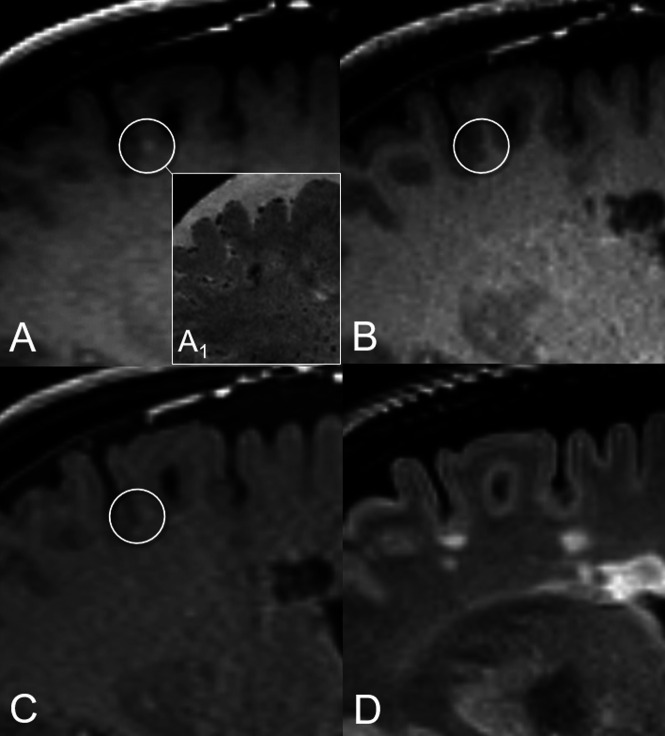
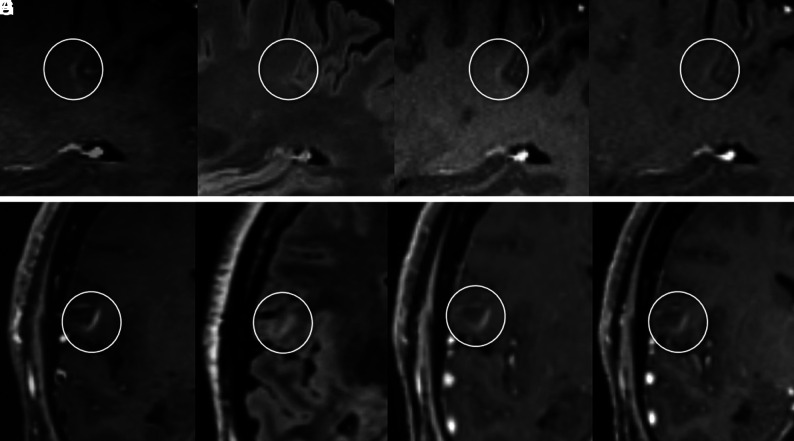
Background and purpose: We hypothesized that 3D T1-TSE "black-blood" images may carry an increased risk of contrast-enhancing lesion misdiagnosis in patients with MS because of the misinterpretation of intraparenchymal vein enhancement. Thus, the occurrence of true-positive and false-positive findings was compared between standard MPRAGE and volumetric interpolated brain examination techniques.

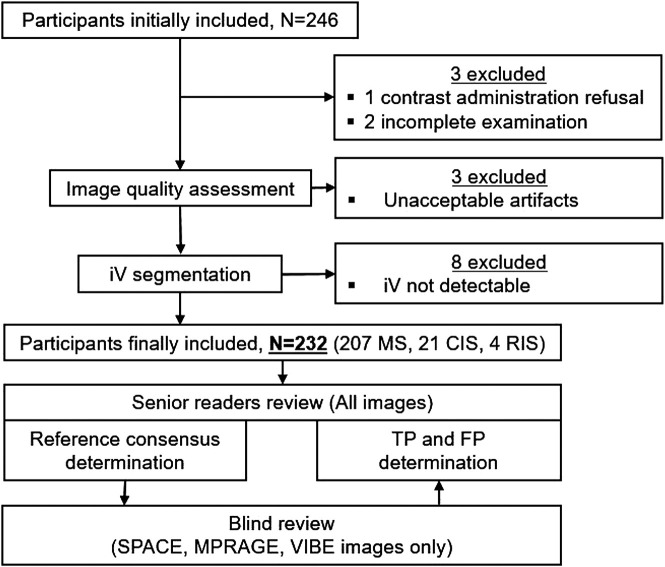
Materials and methods: Sampling perfection with application-optimized contrasts by using different flip-angle evolution (SPACE) images obtained from 232 patients with MS, clinically isolated syndrome, or radiologically isolated syndrome were compared with standard MPRAGE and volumetric interpolated brain examination images. The intraparenchymal vein contrast-to-noise ratio was estimated at the level of the thalami. Contrast-enhancing lesions were blindly detected by 2 expert readers and 1 beginner reader. True- and false-positives were determined by senior readers' consensus. True-positive and false-positive frequency differences and patient-level diagnosis probability were tested with the McNemar test and OR. The contrast-to-noise ratio and morphology were compared using the Mann-Whitney U and χ2 tests.

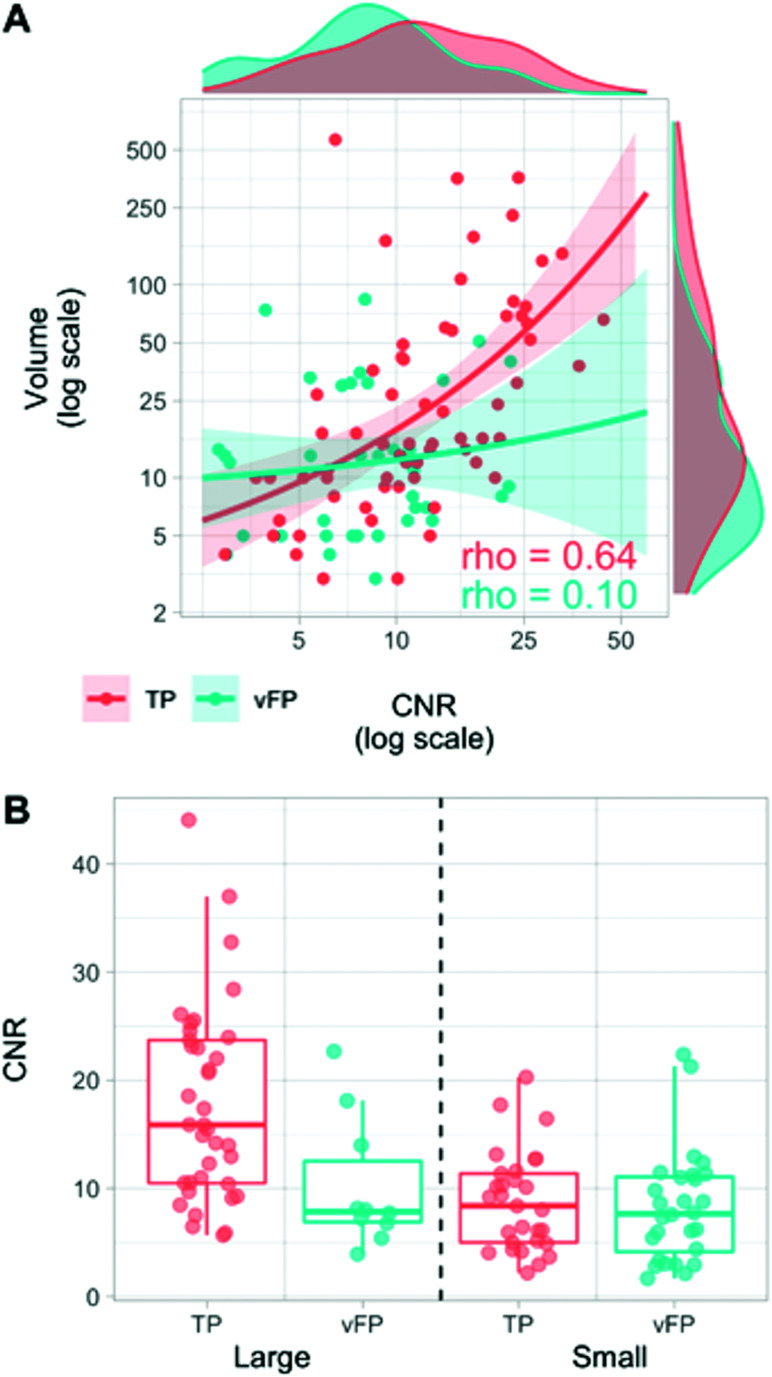
Results: The intraparenchymal vein contrast-to-noise ratio was higher in SPACE than in MPRAGE and volumetric interpolated brain examination images (P < .001, both). There were 66 true-positives and 74 false-positives overall. SPACE detected more true-positive and false-positive results (P range < .001-.07) but did not increase the patient's true-positive likelihood (OR = 1 1.29, P = .478-1). However, the false-positive likelihood was increased (OR = 3.03-3.55, P = .008-.027). Venous-origin false-positives (n = 59) with contrast-to-noise ratio and morphology features similar to small-sized (≤14 mm3 P = .544) true-positives occurred more frequently in SPACE images (P < .001).

Conclusions: Small intraparenchymal veins may confound the diagnosis of enhancing lesions on postgadolinium black-blood SPACE images.


Figures

FIG 1.
FIG 1.
Flow chart shows the included and excluded participants and the TP and FP determination procedure including blinded readers' and senior readers' image review. CIS indicates clinically isolated syndrome; RIS, radiologically isolated syndrome.
FIG 2.
FIG 2.
Illustrative case of nodular vFP enhancement. A tiny juxtacortical enhancement source on SPACE (circle in A), corresponding to a triangle-shaped hypointensity on the high-resolution susceptibility-weighted image (A1), is not detected on MPRAGE and VIBE images (circles in B and C, respectively). The corresponding FLAIR T2-weighed image (D) shows no evidence of demyelinating lesions at this level. This vFP was reported by ER 1 and the BR.
FIG 3.
FIG 3.
The upper panel shows an open-ring vFP enhancement consistent with a developmental venous anomaly and mimicking a TP enhancing juxtacortical CEL on SPACE images. Characteristic arcuate enhancement on SPACE image with subtle margins (circles) in the juxtacortical white matter (A), associated with faint hyperintensity on FLAIR T2 image (B), is barely visible on MPRAGE (C) and VIBE (D) images. This vFP was reported by the BR only. TP CELs with morphology similar to that of A on SPACE image (E) exhibits characteristic T2-FLAIR hyperintensity (F). In this case, CEL enhancement is clearly detected on MPRAGE (G) and VIBE (H) images as well.
FIG 4
FIG 4
A, Relationships between CNR and volume variables in TP (red) and vFP (cyan) findings. Higher CNR and larger volume values are more frequently represented in TP than in vFP (marginal density plots). The variables are significantly correlated in TP (ρ = 0.644, P < .001), but not in vFP (ρ = 0.096, P = .568). B, Boxplots represent CNR value-distribution differences between TP and vFP after median split categorization into small (≤14 mm3) and large (>14 mm3). CNR values are lower in vFP compared with TP in the large category only, but similar in the small category.

References

    1. Thompson AJ, Baranzini SE, Geurts J, et al. . Multiple sclerosis. Lancet 2018;391:1622–36 10.1016/S0140-6736(18)30481-1 - DOI - PubMed
    1. Lublin FD, Reingold SC, Cohen JA, et al. . Defining the clinical course of multiple sclerosis: the 2013 revisions. Neurology 2014;83:278–86 10.1212/WNL.0000000000000560 - DOI - PMC - PubMed
    1. Río J, Rovira À, Tintoré M, et al. . Disability progression markers over 6-12 years in interferon-β-treated multiple sclerosis patients. Mult Scler 2018;24:322–30 10.1177/1352458517698052 - DOI - PubMed
    1. Gasperini C, Prosperini L, Tintoré M, et al. ; the MAGNIMS Study Group. Unraveling treatment response in multiple sclerosis: a clinical and MRI challenge. Neurology 2019;92:180–92 10.1212/WNL.0000000000006810 - DOI - PMC - PubMed
    1. Bermel RA, You X, Foulds P, et al. . Predictors of long-term outcome in multiple sclerosis patients treated with interferon β. Ann Neurol 2013;73:95–103 10.1002/ana.23758 - DOI - PubMed

Publication types

MeSH terms