. 2022 May 26;13(1):2940.
doi: 10.1038/s41467-022-30619-7.

Depletion of skeletal muscle satellite cells attenuates pathology in muscular dystrophy

Affiliations

Depletion of skeletal muscle satellite cells attenuates pathology in muscular dystrophy

Justin G Boyer et al. Nat Commun. .

Abstract

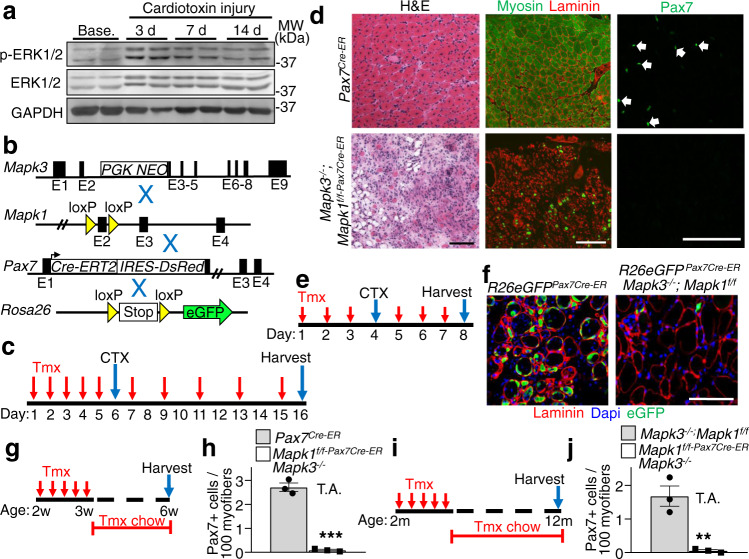
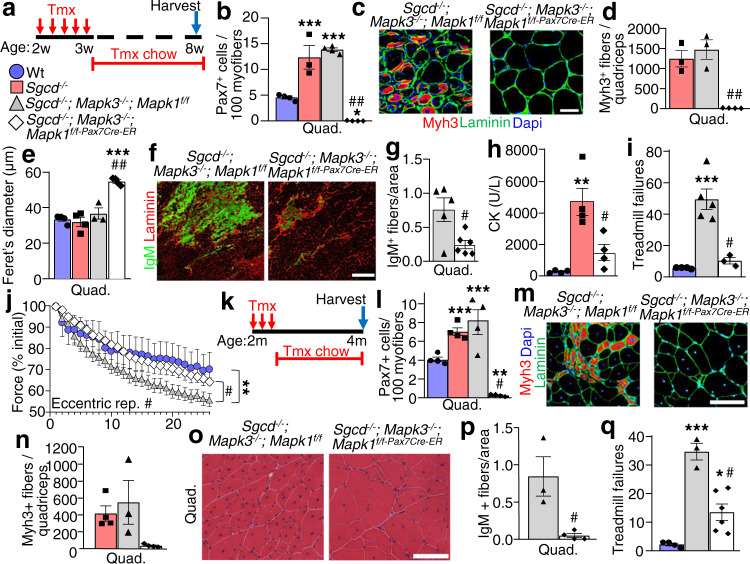
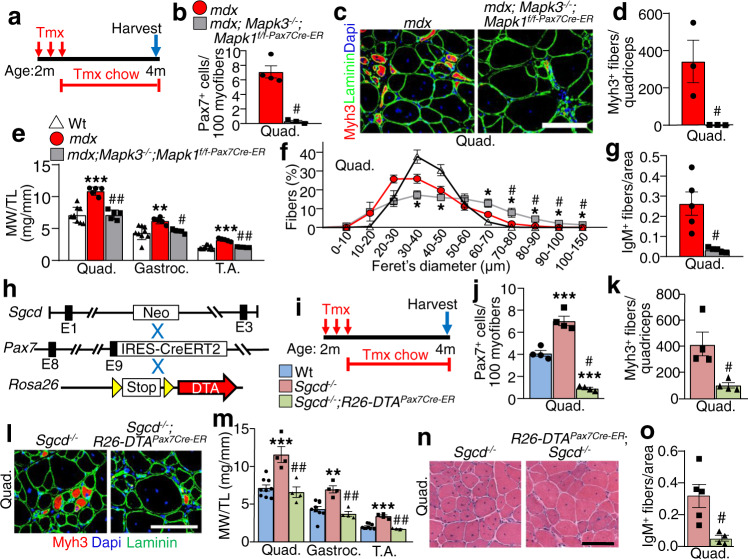
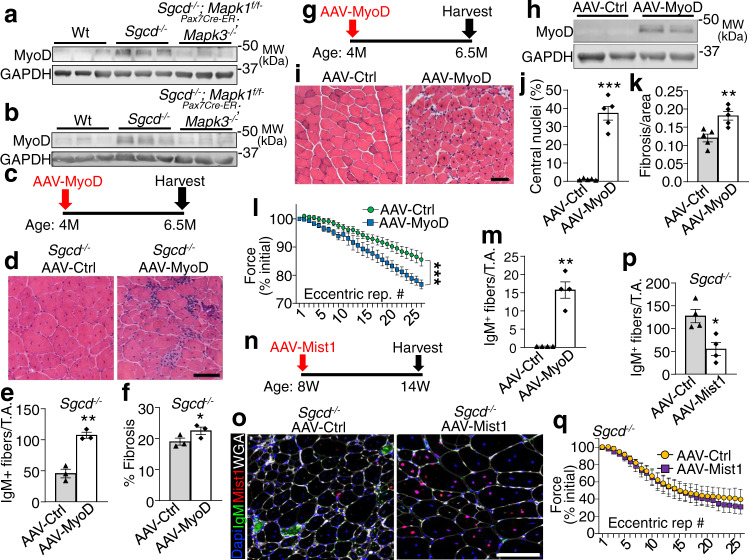
Skeletal muscle can repair and regenerate due to resident stem cells known as satellite cells. The muscular dystrophies are progressive muscle wasting diseases underscored by chronic muscle damage that is continually repaired by satellite cell-driven regeneration. Here we generate a genetic strategy to mediate satellite cell ablation in dystrophic mouse models to investigate how satellite cells impact disease trajectory. Unexpectedly, we observe that depletion of satellite cells reduces dystrophic disease features, with improved histopathology, enhanced sarcolemmal stability and augmented muscle performance. Mechanistically, we demonstrate that satellite cells initiate expression of the myogenic transcription factor MyoD, which then induces re-expression of fetal genes in the myofibers that destabilize the sarcolemma. Indeed, MyoD re-expression in wildtype adult skeletal muscle reduces membrane stability and promotes histopathology, while MyoD inhibition in a mouse model of muscular dystrophy improved membrane stability. Taken together these observations suggest that satellite cell activation and the fetal gene program is maladaptive in chronic dystrophic skeletal muscle.


Conflict of interest statement

These authors, R.J.K. and C.W.W., declare the following competing interest; Owners of Myologica, a contract research organization specialized in assessing physiologic muscle function in the mouse. The remaining authors declare no competing interests.

Figures

Fig. 1
Fig. 1. Erk1/2 are required for satellite cell viability upon activation.
a Western blot analysis for the indicated proteins using tibialis anterior (TA) lysate from samples taken at baseline (Base.) and following 3, 7 and 14 days (d) after cardiotoxin (CTX) administration. Results from two different mice are shown. b Schematic representation of breeding of Mapk3−/− and Mapk1-loxP(f)-targeted mice with the Pax7Cre-ERT2 mouse as well as with the Cre-dependent R26eGFP reporter mouse. c Schematic showing the timing of tamoxifen (Tmx) and CTX treatments in 2-month-old mice. d Representative images of TA muscle sections from mice of the indicated genotypes stained with H&E (left panels), anti-myosin antibody (MF-20, green) and anti-laminin antibody (red, middle panels) or with anti-Pax7 antibody (green, right panels) 10 days post-CTX injury. Scale bars = 100 μm. Samples from 3 different mice were analyzed. e Experimental scheme showing mice injected with Tmx for 3 days, then with CTX on day 4, followed by 3 more days of Tmx injections. f Representative histological sections showing eGFP fluorescence (green) and immunostained for laminin (red) 4 days post-CTX injection in mice of the indicated genotypes. Nuclei are stained with Dapi (blue). Scale bar = 100 μm. Samples from 3 different mice were analyzed. g Schematic representation of the Tmx treatment regimen. Two-week-old mice received Tmx injections for 5 consecutive days and were placed on Tmx chow after weaning. h Quantification of Pax7+ satellite cells from uninjured TA muscle sections from mice of the indicated genotypes. n = 3 mice per group. Significance was determined using a two-tailed Student’s t test, ***P < 0.001. i Schematic representation of Tmx treatment. Two-month-old mice received daily Tmx injection for 5 consecutive days and were subsequently placed on Tmx chow for 10 months. j Quantification of satellite cell numbers from uninjured TA muscle sections from 1-year-old mice of the indicated genotypes. n = 3 mice per group. Significance was determined using a two-tailed Student’s t test, **P = 0.005. Data represent mean ± SEM for all graphs.
Fig. 2
Fig. 2. Loss of satellite cells reduces muscle damage in Sgcd−/− mice.
a Schematic showing 2-week-old mice receiving a daily Tmx injection for 5 consecutive days and then placed on Tmx chow after weaning until 8 weeks, which applies to all the data in panels bj. b Quantification of Pax7+ satellite cells in muscle sections from the quadriceps (Quad) of mice with the indicated genotypes. n = 3 mice for Sgcd−/− samples and n = 4 mice for all other genotypes. One-way ANOVA with Tukey’s multiple comparisons test was used to determine significance, ***P < 0.001 vs Wt, ##P < 0.001 vs disease controls. c Representative quad muscle sections immunostained for Myh3 (red) and laminin (green) in 2-month-old mice of the indicated genotypes. Dapi stained nuclei are in blue. Scale bar = 50 μm. d Quantification of the number of Myh3 positive fibers in Quad muscle sections of mice with the indicated genotypes. n = 3 mice for Sgcd−/− and Sgcd−/−; Mapk3−/−; Mapk1f/f samples and n = 4 mice for Sgcd–/–; Mapk3−/−; Mapk1f/f-Pax7Cre-ER samples. One-way ANOVA with Tukey’s multiple comparisons test was used to determine significance, ##P < 0.001 vs disease controls. e Average minimal feret’s diameter of myofibers measured from muscle sections of the Quad in mice with the indicated genotypes. n = 4 Wt mice; 4 Sgcd−/− mice; 3 Sgcd−/−; Mapk3−/−; Mapk1f/f; mice and 4 Sgcd−/−; Mapk3−/−; Mapk1f/f-Pax7Cre-ER mice. A 1-way ANOVA with Tukey’s multiple comparisons test was used to determine significance, ***P < 0.001 vs Wt, ##P < 0.001 vs disease controls. f Representative histological sections of the Quad muscle immunostained for immunoglobulin M (IgM) (green) and for laminin (Red) in mice of the indicated genotypes. Scale bar = 500 μm. g Quantification of IgM positive fibers in Quad muscle sections from mice of the indicated genotypes. n = 5 mice, Sgcd−/−; Mapk3−/−; Mapk1f/f; n = 6 mice, Sgcd−/−; Mapk3−/−; Mapk1f/f-Pax7Cre-ER. Significance was determined using a two-tailed Student’s t test, #P = 0.01. h Average blood creatine kinase (CK) levels from mice of the indicated genotypes at 8 weeks of age. n = 4 mice in each group. One-way ANOVA with Tukey’s multiple comparisons test was used to determine significance, and **P < 0.01 vs Wt, #P < 0.05 vs Sgcd−/−. i Quantification of the number of shock pad visits calculated over 20 min from the start of the protocol. n = 4 Wt mice; n = 5 Sgcd−/−; Mapk3−/−; Mapk1f/f mice; n = 3 Sgcd−/−; Mapk3−/−; Mapk1f/f-Pax7Cre-ER mice. A 1-way ANOVA with Tukey’s multiple comparisons test was used to determine significance, ***P < 0.001 vs Wt, #P < 0.01 vs Sgcd−/−; Mapk3−/−; Mapk1f/f. j Percent change in force transduction for the hindlimb muscles subjected to continuous repetitive eccentric contractions in the 3 genotypes of mice shown based on the key in panel “a”. The x-axis shows number of progressive repetitive (rep) contractions. A two-way repeated measures ANOVA with a Holm-Sidak post-hoc test was used to determine significance. n = 6 Wt mice; n = 7 Sgcd−/−; Mapk3−/−; Mapk1f/f mice; n = 4 Sgcd−/−; Mapk3−/−; Mapk1f/f-Pax7Cre-ER mice. **P < 0.01 vs Wt, #P < 0.01 vs disease control. k Schematic representation of the Tmx treatment regimen, which applies to all the data in panels lq. Two-month-old mice received a daily Tmx injection for 5 consecutive days and were subsequently placed on Tmx chow until 4 months of age. l Quantification of Pax7+ satellite cells in muscle sections from the Quad of mice with the indicated genotypes. n = 4 mice for all groups. A 1-way ANOVA with Tukey’s multiple comparisons test was used to determine significance, **P < 0.01 vs Wt, ***P < 0.01 vs Wt, #P < 0.001 vs disease controls. m Representative Quad muscle sections immunostained for Myh3 (red) and laminin (green) in 4-month-old mice of the indicated genotypes. Dapi stained nuclei are in blue. Scale bar = 100 μm. n Quantification of the number of Myh3 positive fibers in Quad muscle sections of mice with the indicated genotypes. n = 4 Sgcd−/− and Sgcd–/–; Mapk3−/− and Mapk1f/f-Pax7Cre-ER mice and n = 3 Sgcd−/−; Mapk3−/−; Mapk1f/f mice. o Representative H&E-stained sections of the Quad muscle from 4-month-old mice of the indicated genotypes. Scale bar = 100 μm. p Quantification of IgM positive fibers in Quad muscle sections from mice of the indicated genotypes. n = 3 Sgcd−/−; Mapk3−/−; Mapk1f/f mice and n = 4 Sgcd−/−; Mapk3−/−; Mapk1f/f-Pax7Cre-ER mice. Significance was determined using a two-tailed Student’s t test, #P = 0.01. q Quantification of the number of shock pad visits calculated 10 min from the start of the protocol. n = 4 Wt mice; n = 3 Sgcd−/−; Mapk3−/−; Mapk1f/f mice and n = 6 Sgcd−/−; Mapk3−/−; Mapk1f/f-Pax7Cre-ER mice. A 1-way ANOVA with Tukey’s multiple comparisons test was used to determine significance, *P < 0.05 vs Wt, ***P < 0.001 vs Wt, #P < 0.001 vs Sgcd−/−; Mapk3−/−; Mapk1f/f. Data represent mean ± SEM for all graphs.
Fig. 3
Fig. 3. Satellite cell ablation mitigates disease severity in dystrophic mice.
a Schematic representation of the Tmx treatment regimen in mdx mice. Two-month-old mice received daily Tmx injection for 5 days and were subsequently placed on Tmx chow until 4 months of age. b Quantification of Pax7+ satellite cells from Quad muscle sections from 4-month-old mice of the indicated genotypes. n = 4 mdx mice and n = 3 mdx; Mapk3−/−; Mapk1f/f-Pax7Cre-ER mice. Significance was determined using a two-tailed Student’s t test, #P = 0.001. c Representative Quad muscle sections immunostained for Myh3 (red) and laminin (green) in 4-month-old mice of the indicated genotypes. Dapi stained nuclei are in blue. Scale bar = 100 μm. d Quantification of the number of Myh3 positive myofibers in Quad muscle sections of mice with the indicated genotypes. n = 3 mice per group. Significance was determined using a two-tailed Student’s t test, #P = 0.04. e Muscle weights (MW) normalized to tibia length (TL) from mice of the indicated genotypes at 4 months of age. n = 9 Wt mice and n = 5 mdx and mdx; Mapk3−/−; Mapk1f/f-Pax7Cre-ER mice. A 1-way ANOVA with Tukey’s multiple comparisons test was used to determine significance, **P < 0.01 vs Wt, ***P < 0.001 vs Wt, #P = 0.01 vs mdx, ##P < 0.001 vs mdx. The 4-month Wt weight data are also shown in “m” and in Supplementary Fig. 3b. f Minimal feret’s myofiber diameter distribution from the Quad muscle of 4-month-old mice with the indicated genotypes. n = 4 Wt mice; n = 3 mdx and mdx; Mapk3−/−; Mapk1f/f-Pax7Cre-ER mice. A 1-way ANOVA with Tukey’s multiple comparisons test was used to determine significance, *P < 0.05 vs Wt, #P < 0.05 vs mdx. The 4-month Wt feret’s diameter data are also shown in Supplementary Fig. 3d. g Quantification of IgM positive fibers in quad muscle sections from mice of the indicated genotypes. n = 5 mice per group. Significance was determined using a two-tailed Student’s t test, #P = 0.004. h Schematic of breeding the Tmx-inducible Pax7Cre-ERT2 mice with Rosa26-DTA targeted mice. These lines were crossed onto the δ-sarcoglycan–null (Sgcd–/–) background. i Schematic representation of the Tmx treatment regimen. Two-month-old mice received Tmx injections for five consecutive days and were subsequently placed on Tmx chow until harvest at 4 months of age. The key shows the 3 genotypes examined by color for the remaining panels. j Quantification of Pax7+ satellite cells in muscle sections from the Quad of mice with the indicated genotypes. n = 4 mice per group. A 1-way ANOVA with Tukey’s multiple comparisons test was used to determine significance, ***P < 0.001 vs Wt, #P < 0.001 vs Sgcd−/−. The 4 month Wt and Sgcd−/− Pax7 positive counts are also shown in Fig. 2l. k Quantification of the number of Myh3 positive fibers in Quad muscle sections of mice with the indicated genotypes. n = 4 for both groups. Significance was determined using a two-tailed Student’s t test, #P = 0.01. The 4 month Sgcd−/− Myh3 positive fiber counts are also shown in Fig. 2n. l Representative Quad muscle sections immunostained for Myh3 (red) and laminin (green) in 4-month-old mice of the indicated genotypes. Dapi stained nuclei are in blue. Scale bar = 100 μm. m Muscle weights (MW) normalized to tibia length (TL) from mice of the indicated genotypes at 4 months of age. n = 9 Wt mice; n = 4 Sgcd−/− and Sgcd−/−; R26-DTAPax7Cre-ER mice. A 1-way ANOVA with Tukey’s multiple comparisons test was used to determine significance, **P < 0.01 vs Wt, ***P < 0.001 vs Wt, ##P < 0.001 vs Sgcd−/−. n Representative H&E-stained sections of the Quad muscle from 4-month-old mice of the indicated genotypes. Scale bar = 100 μm. o Quantification of IgM positive fibers in muscle sections from mice of the indicated genotypes. n = 5 Sgcd−/− mice and n = 4 Sgcd−/−; R26-DTAPax7Cre-ER mice. Significance was determined using a two-tailed Student’s t test, #P = 0.01. Data represent mean ± SEM for all graphs.
Fig. 4
Fig. 4. Ectopic MyoD expression destabilizes the sarcolemma in vivo.
Western blotting for MyoD protein expression using Quad lysate from 2- or 4-month-old mice of indicated genotypes treated with Tmx starting at 2 (a) or 8 (b) weeks of age. GAPDH is shown as loading control. Results from three different mice are shown. c Schematic for AAV-MyoD or AAV-control injection into Sgcd−/− mice at 4 months of age, harvested by 6.5 months. d H&E-stained TA muscle histological sections from Sgcd−/− mice injected with the indicated recombinant virus. Scale bar = 100 μm. e IgM positive fibers quantified in TA muscle histological sections with prior AAV-MyoD or AAV-control infection in Sgcd−/− mice. n = 3 mice per group, **P < 0.01 vs AAV-Ctrl, two-tailed Student’s t test. f Picrosirius red-stained histological section of the TA muscle for quantitation of fibrosis in Sgcd−/− mice with prior AAV-MyoD or AAV-control infection. n = 3 mice per group, *P < 0.05 vs AAV-Ctrl, two-tailed Student’s t test. g Schematic of recombinant AAV treatment in Wt mice. h Western blot for MyoD from TA muscle of Wt mice 2.5 months after AAV injection. GAPDH was run as a loading control. Results from two different mice are shown. i H&E-stained TA muscle histological sections from Wt mice injected with the indicated recombinant virus. Scale bar = 100 μm. j Quantitation of myofiber number with central nucleation in H&E-stained histological sections from the TA muscle with prior AAV-MyoD or AAV-control infection in Wt mice. n = 5 mice per group, ***P < 0.001 vs AAV-Ctrl, two-tailed Student’s t test. k Quantitation of fibrosis in picrosirius red-stained histological sections from the TA muscle in Wt mice with prior AAV-MyoD or AAV-control infection. n = 5 mice per group, **P = < 0.01 vs AAV-Ctrl, two-tailed Student’s t test. l Percent change in force transduction for TA muscles subjected to continuous repetitive eccentric contractions in Wt mice injected previously with AAV-MyoD or AAV-Ctrl. The x-axis shows number of progressive repetitive (rep) contractions. A two-way repeated measures ANOVA was used to determine significance, n = 12 mice for AAV-Ctrl, n = 11 mice for AAV-MyoD, ***P < 0.001 for interaction. m IgM positive fibers quantified in TA muscle histological sections with prior AAV-MyoD or AAV-control injection in Wt mice. n = 4 mice per group, **P < 0.001 vs AAV-Ctrl, two-tailed Student’s t test. n Schematic of recombinant AAV-Mist1 vs AAV-Ctrl TA muscle injection in Sgcd−/− mice at the indicated times. o Immunohistochemistry from the TA muscle of Sgcd−/− mice injected prior with AAV-Mist1 or AAV-Ctrl, stained for IgM (green), Mist1 (red), Dapi for nuclei (blue) or myofiber outlines with wheatgerm agglutinin (white). Scale bar = 100 μm. p IgM positive fibers quantified in TA muscle histological sections of Sgcd−/− mice with prior AAV-Mist1 or AAV-control injection. mice. n = 4 mice per group, *P < 0.05 vs AAV-Ctrl, two-tailed Student’s t test. q Percent change in force transduction in the hindlimb subjected to continuous repetitive eccentric contractions in Sgcd−/− mice injected previously with AAV-Mist1 or AAV-Ctrl. The x-axis shows number of progressive repetitive (rep) contractions. n = 7 mice for AAV-Ctrl, n = 8 mice for AAV-Mist1. Data represent mean ± SEM for all graphs.

References

    1. Yin H, Price F, Rudnicki MA. Satellite cells and the muscle stem cell niche. Physiol. Rev. 2013;93:23–67. doi: 10.1152/physrev.00043.2011. - DOI - PMC - PubMed
    1. Granata AL, et al. Gamma irradiation can reduce muscle damage in mdx dystrophic mice. Acta Neuropathol. 1998;96:564–568. doi: 10.1007/s004010050936. - DOI - PubMed
    1. Rossi G, et al. Nfix regulates temporal progression of muscle regeneration through modulation of myostatin expression. Cell Rep. 2016;14:2238–2249. doi: 10.1016/j.celrep.2016.02.014. - DOI - PMC - PubMed
    1. Rossi G, et al. Silencing Nfix rescues muscular dystrophy by delaying muscle regeneration. Nat. Commun. 2017;8:1055. doi: 10.1038/s41467-017-01098-y. - DOI - PMC - PubMed
    1. Jones NC, Fedorov YV, Rosenthal RS, Olwin BB. ERK1/2 is required for myoblast proliferation but is dispensable for muscle gene expression and cell fusion. J. Cell Physiol. 2001;186:104–115. doi: 10.1002/1097-4652(200101)186:1<104::AID-JCP1015>3.0.CO;2-0. - DOI - PubMed

Publication types