. 2022 May 26;13(1):2961.
doi: 10.1038/s41467-022-30604-0.

RNase H2, mutated in Aicardi-Goutières syndrome, resolves co-transcriptional R-loops to prevent DNA breaks and inflammation

Affiliations

RNase H2, mutated in Aicardi-Goutières syndrome, resolves co-transcriptional R-loops to prevent DNA breaks and inflammation

Agnese Cristini et al. Nat Commun. .

Abstract

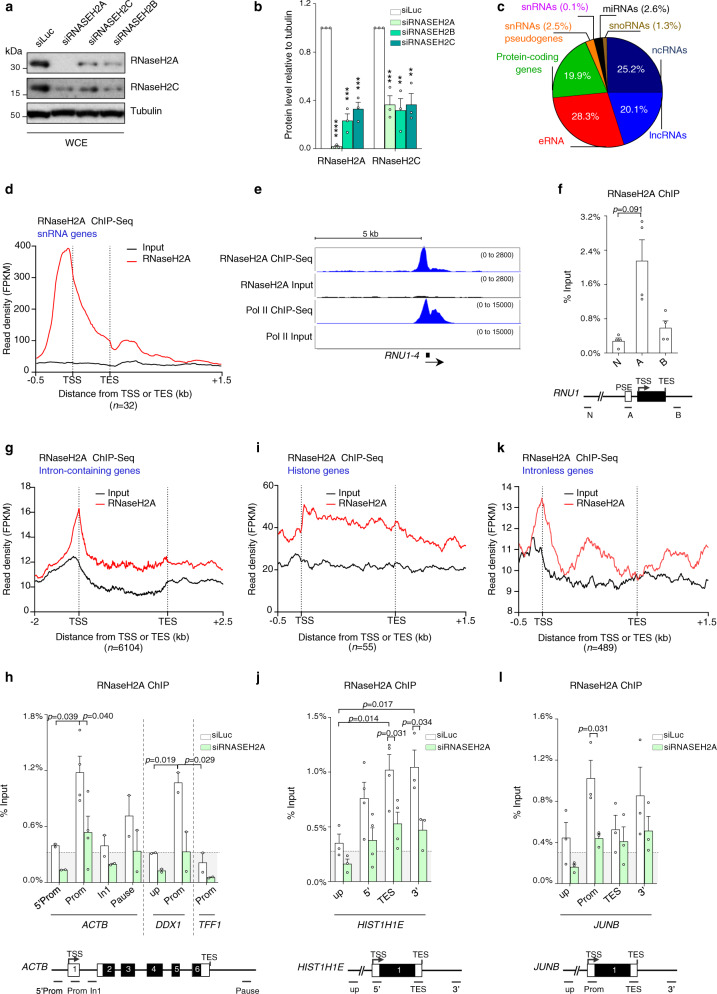
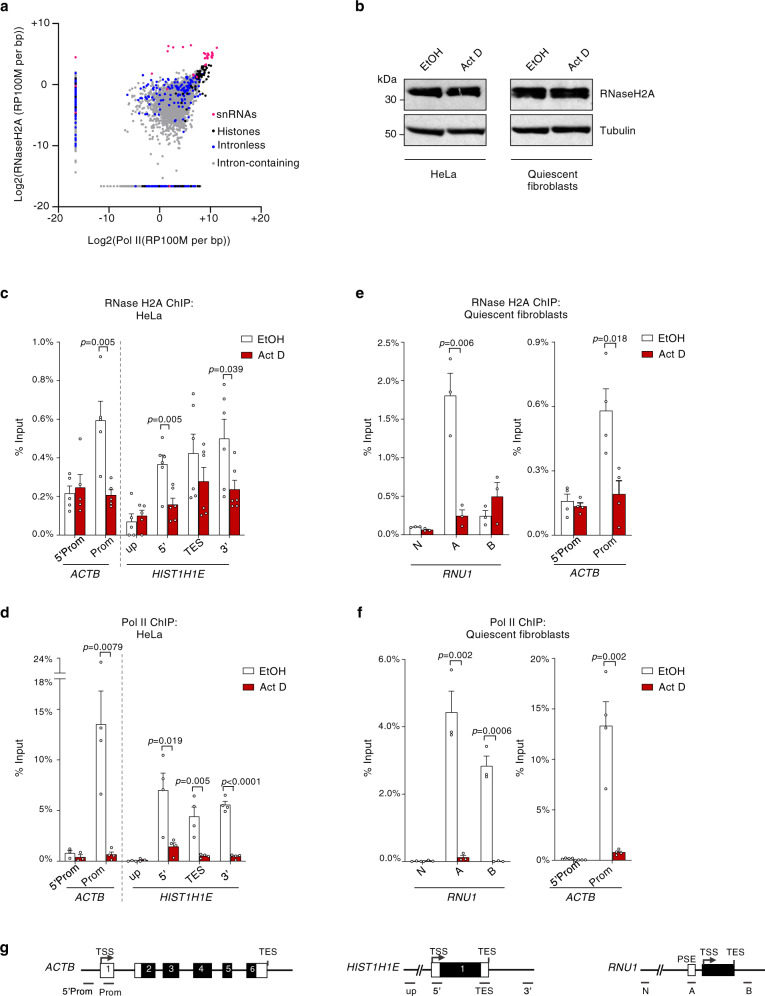
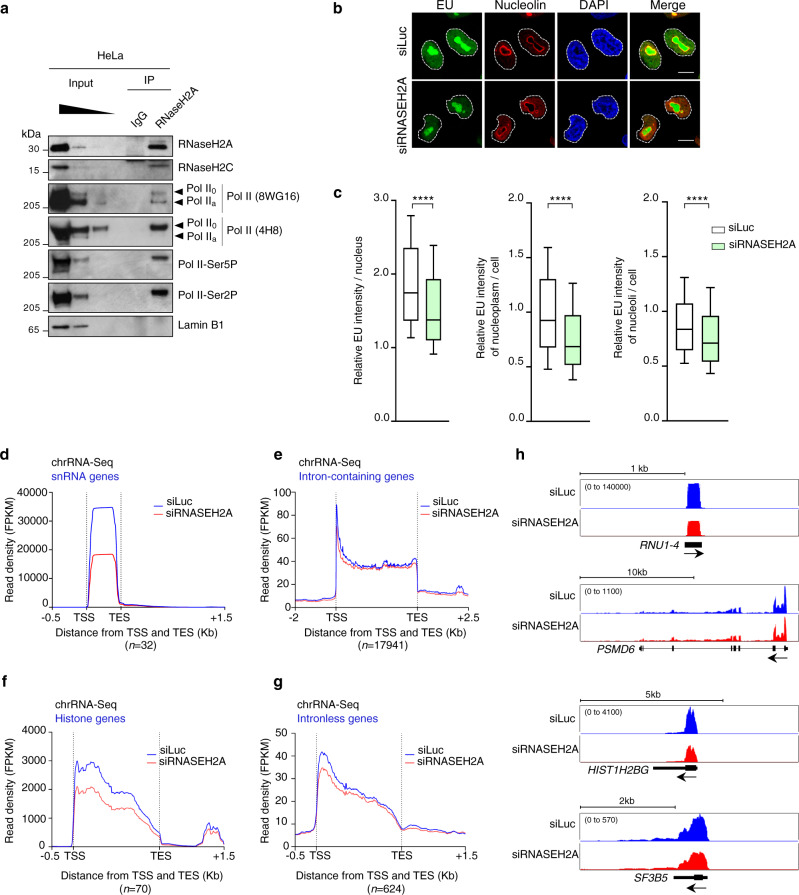
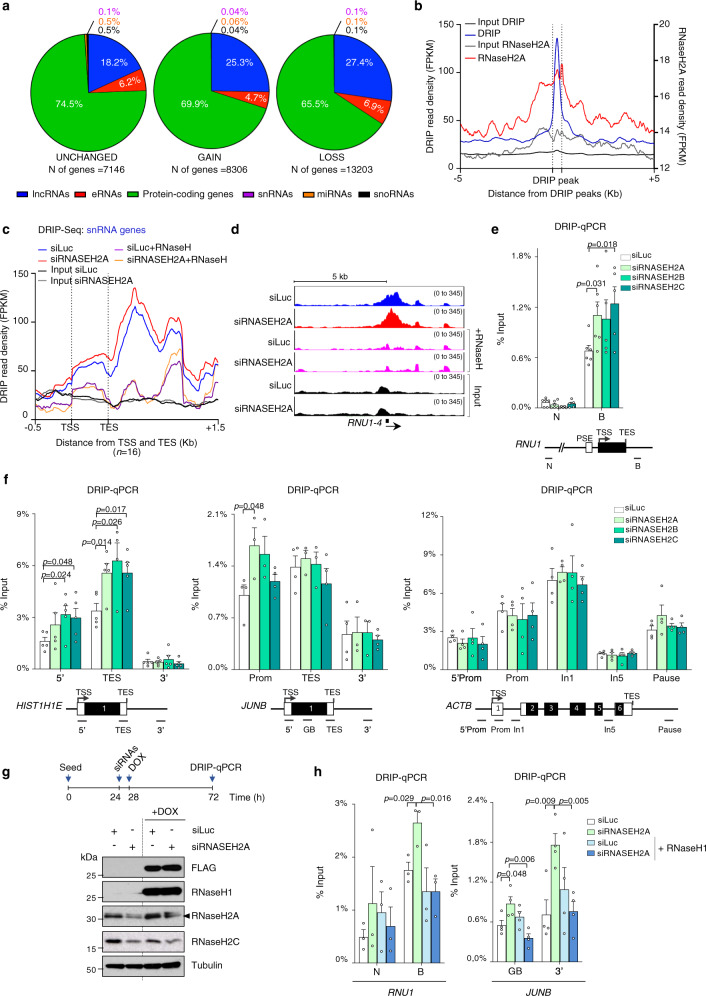
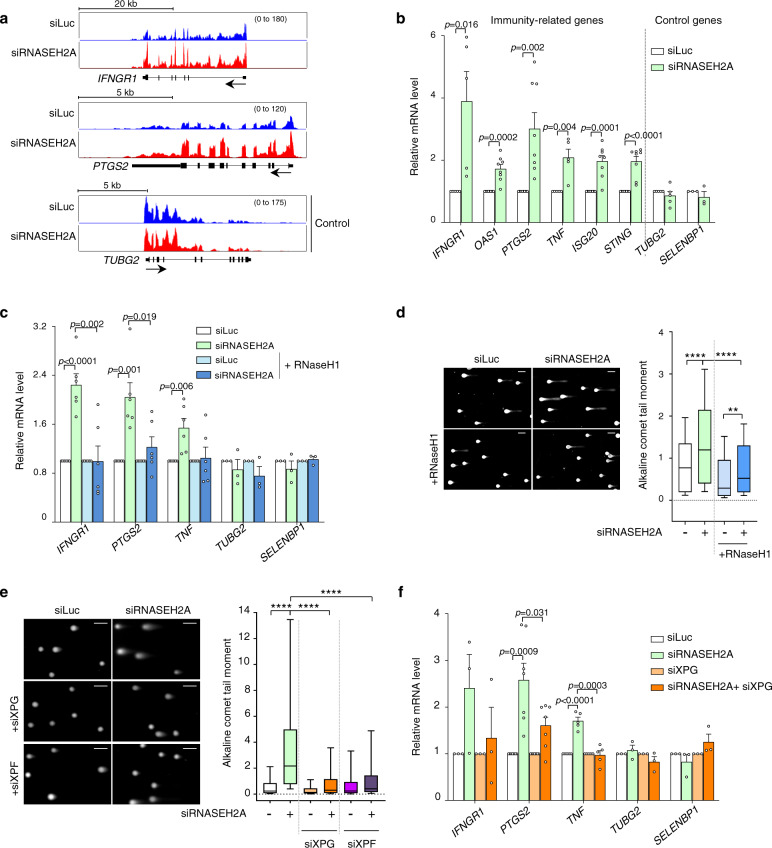
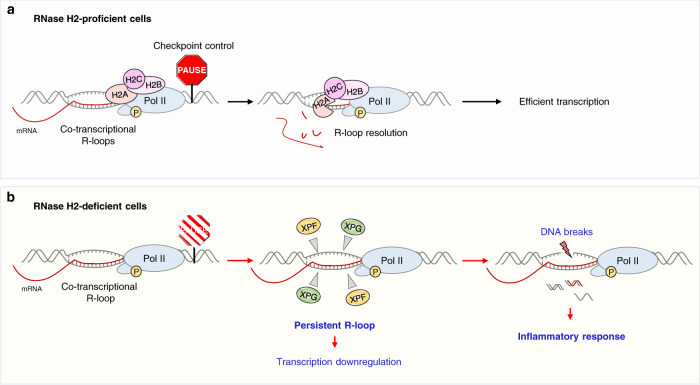
RNase H2 is a specialized enzyme that degrades RNA in RNA/DNA hybrids and deficiency of this enzyme causes a severe neuroinflammatory disease, Aicardi Goutières syndrome (AGS). However, the molecular mechanism underlying AGS is still unclear. Here, we show that RNase H2 is associated with a subset of genes, in a transcription-dependent manner where it interacts with RNA Polymerase II. RNase H2 depletion impairs transcription leading to accumulation of R-loops, structures that comprise RNA/DNA hybrids and a displaced DNA strand, mainly associated with short and intronless genes. Importantly, accumulated R-loops are processed by XPG and XPF endonucleases which leads to DNA damage and activation of the immune response, features associated with AGS. Consequently, we uncover a key role for RNase H2 in the transcription of human genes by maintaining R-loop homeostasis. Our results provide insight into the mechanistic contribution of R-loops to AGS pathogenesis.


Conflict of interest statement

The authors declare no competing interests.

Figures

Fig. 1
Fig. 1. RNase H2A binds active genes.
a, b Western blot of RNase H2A and H2C in the whole cell extract (WCE) in HeLa cells transfected with siLuc (white), siRNASEH2A, H2B and H2C (shades of green). Tubulin is a loading control. b Quantification of protein levels. Values are normalized to tubulin. n = 3 biologically independent experiments (means ± SEM). p-values from left to right: p < 0.0001, p = 0.0002, p = 0.0003, p = 0.001, p = 0.002, p = 0.002 (two-tailed unpaired t-test). c Distribution of RNase H2A ChIP-seq positive genes across the indicated genic compartments (n = 34,244). d Meta-analysis of read density (fragments per kilobase of transcript per million mapped reads, FPKM) for RNase H2A ChIP-seq on snRNA genes across −0.5 kb genomic region flanking transcription start site (TSS) and +1.5 kb transcription termination site (TES) in HeLa cells. All subsequent images show one representative replicate out of 2 with RNase H2A signal in red and input in black. Number of genes analyzed are shown in brackets. e RNase H2A and Pol II ChIP-seq profiles of RNU1-4 in HeLa cells. Numbers in brackets indicate the viewing range (FPKM). f RNase H2A ChIP-qPCR for RNU1 in HeLa cells. Values are expressed as percentage of input. n = 4 biologically independent experiments (means ± SEM). p-values were calculated using two-tailed unpaired t-test. All subsequent gene diagrams depict snRNA coding region or protein-coding gene exons (black), UTRs (white), introns (lines), TSS, TES and qPCR amplicons (below the diagram). PSE is proximal sequence element. g, i, k Meta-analysis of read density (FPKM) for RNase H2A ChIP-seq on different categories of genes in HeLa cells, with the window size of the presented plots adjusted to the gene size. Data are represented as in d. h, j, l RNase H2A ChIP-qPCR in HeLa cells transfected with siLuc (white bars) and siRNASEH2A (green bars) for different gene categories. Values represent percentage of input (means ± SEM). p-values were calculated using two-tailed unpaired t-test. h Intron-containing genes (ACTB, DDX1 and TFF1). n = 2 (n = 4 for ACTB Prom) biologically independent experiments. j Histone HIST1H1E gene. n = 3 (n = 4 for 5’ and TES) biologically independent experiments. l Intronless JUNB gene. n = 3 biologically independent experiments. Horizontal dotted line indicates background signal. Source data are provided as a Source data file.
Fig. 2
Fig. 2. RNase H2A binding is transcription-dependent.
a Scatterplot of RNase H2A versus Pol II ChIP signal across genes, defined as TSS to TES. Genes with RNase H2A or Pol II ChIP signal positive over the input are shown. snRNA (pink), histone (black), intronless (blue) and intron-containing (gray) genes are shown. b Western blot of RNase H2A in HeLa cells and quiescent fibroblasts treated with actinomycin D (Act D) and ethanol (vehicle). Tubulin is a loading control. Representative blots from n = 2 biologically independent experiments. c RNase H2A ChIP-qPCR and d Pol II ChIP-qPCR of ACTB and HIST1H1E genes in HeLa cells, treated with ethanol (vehicle; white bars) or actinomycin D (Act D; red bars). Values represent percentage of input (means ± SEM). p-values were calculated using two-tailed unpaired t-test. n = 5 or 6 biologically independent experiments in c. n = 3 or 4 biologically independent experiments in d. e RNase H2A ChIP-qPCR and f Pol II ChIP-qPCR of RNU1 and ACTB genes in WI38 hTERT cells (quiescent fibroblasts), treated with ethanol (vehicle; white bars) or actinomycin D (Act D; red bars). Values represent percentage of input (means ± SEM). p-values were calculated using two-tailed unpaired t-test. n = 3 (RNU1) or n = 4 (ACTB) biologically independent experiments. g Diagrams of the indicated genes. Source data are provided as a Source data file.
Fig. 3
Fig. 3. RNase H2A depletion affects transcription.
a Western blot of endogenous RNase H2A IP from HeLa WCE probed with the indicated antibodies. Arrows indicate hypo- (IIa) and hyper-phosphorylated (IIo) Pol II. IgG and Lamin B1 are negative controls. Representative blots from n = 2 biologically independent experiments. b IF analysis of EU incorporation in HeLa cells transfected with siLuc or siRNASEH2A. EU (green), nucleolin (red), DAPI (blue), Nucleolin + EU (merge); scale bars: 10 µm. Representative images from n = 2 biologically independent experiments. c Quantification of EU intensity per nucleus (left panel), nucleoplasm/cell (nucleus without nucleolus; middle panel) or nucleoli/cell (right panel) in HeLa cells transfected with siLuc (white) or siRNASEH2A (green). EU intensity is normalized to the average nucleoplasmic intensity in siLuc condition. Boxplot settings are: box: 25–75 percentile range; whiskers: 10–90 percentile range; horizontal bars: median; outliers not displayed. >20,000 nuclei were quantified per condition. Representative data from n = 3 biologically independent experiments. ****p < 0.0001 (two-tailed unpaired t-test). dg Meta-analysis for chrRNA-Seq on indicated categories of genes in HeLa cells following RNase H2A depletion with the window size of the presented plots adjusted to the gene size. siLuc (blue) and siRNASEH2A (red) tracks show the average signal of two replicates. h ChrRNA-seq profiles of RNU1-4, PMSD6, HIST1H2BG and SF3B5 genes in HeLa cells treated as in dg. Source data are provided as a Source data file.
Fig. 4
Fig. 4. RNase H2 depletion induces R-loop accumulation.
a Distribution of genes in the indicated genic compartments defined by DRIP-seq peaks in control and RNase H2A-depleted HeLa cells. Unchanged (left), increased/gained (middle) and decreased/lost (right) peaks in RNase H2A-depleted HeLa cells are shown. b Meta-analysis of DRIP-seq peaks (blue) enriched over both input and RNase H-treated control in siLuc samples (+/−250 bp around peak center). RNase H2A ChIP-seq data (red) are superimposed on DRIP peaks (+/−5 kb). c Meta-analysis of DRIP-seq on snRNA genes following RNase H2A depletion in HeLa cells with the window size of the presented plot adjusted to the gene size. siLuc (blue) and siRNASEH2A (red) tracks show an average signal of two replicates. RNase H-treated samples correspond to one replicate and are shown in orange and purple. d DRIP-seq profiles of RNU1-4 in HeLa cells treated as in c. e, f DRIP-qPCR for the indicated genes in HeLa cells following RNase H2A, H2B or H2C depletion (shades of green). Values are expressed as percentage of input (means ± SEM). p-values were calculated using two-tailed unpaired t-test. e snRNA RNU1 gene. n = 5 (siRNASEH2B and siRNASEH2C) and n = 6 (siLuc and siRNASEH2A) biologically independent experiments. f Histone HIST1H1E gene; n = 5 (n = 4 TES siRNASEH2B) biologically independent experiments (left panel). Intronless JUNB gene; n = 3 (siRNASEH2A and siRNASEH2B) and n = 4 (siLuc and siRNASEH2C) biologically independent experiments (middle panel). Intron-containing ACTB genes; n = 4 biologically independent experiments (right panel). Gene diagrams are shown on the bottom panel. g, h HEK293T RNase H1-FLAG-IRES-mCherry cells transfected with siLuc (white bars) or siRNASEH2A (green bars) and induced with doxycycline (+DOX) to over-express RNase H1 (shades of blue). g Schematic of the protocol (top panel), Western blot probed with the indicated antibodies (bottom panel). h DRIP-qPCR for the indicated genes. Values are expressed as percentage of input (means ± SEM); n = 3 (RNU1) and n = 4 (JUNB) biologically independent experiments. p-values were calculated using two-tailed unpaired t-test. Source data are provided as a Source data file.
Fig. 5
Fig. 5. R-loops contribute to activation of inflammatory response in RNase H2-depleted cells.
a ChrRNA-seq profiles for INFNGR1 (top), PTGS2 (middle) and TUBG2 (bottom) genes in HeLa cells transfected with siLuc (blue) and siRNASEH2A (red). TUBG2 is a control gene. Each track represents an average signal from two biologically independent experiments (n = 2). b qRT-PCR of indicated mRNAs in HeLa cells transfected with siLuc (white bars) or siRNASEH2A (green bars). Values are relative to siLuc cells (means ± SEM); n = 8 (OAS1, PTGS2, ISG20, STING), n = 5 (IFNGR1, TNF, TUBG2), n = 3 (SELENBP1) biologically independent experiments. p-values were calculated using two-tailed unpaired t-test. c HEK293T RNase H1-FLAG-IRES-mCherry cells transfected with siLuc (white bars) or siRNASEH2A (green bars) and induced with doxycycline (DOX) to over-express RNase H1 (shades of blue) as in Fig. 4g. qRT-PCR analysis of indicated mRNAs. Values are relative to siLuc or siLuc +DOX (means ± SEM); n = 6 (IFNGR1, PTGS2, TNF), n = 3 (TUBG2 and SELENBP1) biologically independent experiments. p-values were calculated using two-tailed unpaired t-test. d Alkaline comet assays in HEK293T RNase H1-FLAG-IRES-mCherry cells treated as in c. Representative images (left) and quantification of comet tail moment (right). Scale bars: 100 µm. Boxplot settings are: box: 25–75 percentile range; whiskers: 10–90 percentile range; horizontal bars: median; outliers not displayed. >500 nuclei were quantified per condition. Representative data from n = 4 biologically independent experiments. p-values: **p = 0.0065, ****p < 0.0001 (one-way ANOVA, Tukey’s multiple comparison test). e Alkaline comet assays in HeLa cells transfected with the indicated siRNAs (siXPG are in shades of orange, siXPF in shades of purple). Representative images (left) and quantification of comet tail moment (right). Scale bars: 100 µm. Boxplot settings are: box: 25–75 percentile range; whiskers: 10–90 percentile range; horizontal bars: median; outliers not displayed. Representative data from n = 3 biologically independent experiments. >400 nuclei were quantified per condition. ****p < 0.0001 (one-way ANOVA, Tukey’s multiple comparison test). f qRT-PCR analysis of indicated mRNAs (siRNASEH2A alone is in green, siXPG are in shades of orange). Some siRNA transfections were performed in parallel to siAQR and siXPF and have the same siLuc and siRNASEH2A controls as in Supplementary Figs. 7e and 8f. Values are relative to siLuc and siXPG cells (means ± SEM); n = 3 (IFNGR1, TUBG2, SELENBP1), n = 5 (TNF) and n = 7 (PTGS2) biologically independent experiments. p-values were calculated using two-tailed unpaired t-test. Source data are provided as a Source data file.
Fig. 6
Fig. 6. Model for the role of RNase H2 complex in R-loop resolution during transcription.
a RNase H2 binds actively transcribed genes and interacts with phosphorylated Pol II. If co-transcriptional R-loops exceed the physiological levels, RNase H2 resolves them, ensuring a checkpoint control to promote efficient transcription. b Lack of RNase H2 results in the lack of this checkpoint control and accumulation of R-loops at short genes, impaired transcription, XPF- and XPG-mediated R-loop cleavage and consequent DNA break formation which activates an inflammatory response, characteristic of AGS pathology.

References

    1. Cerritelli SM, Crouch RJ. Ribonuclease H: the enzymes in eukaryotes. FEBS J. 2009;276:1494–1505. doi: 10.1111/j.1742-4658.2009.06908.x. - DOI - PMC - PubMed
    1. Kellner V, Luke B. Molecular and physiological consequences of faulty eukaryotic ribonucleotide excision repair. EMBO J. 2020;39:e102309. doi: 10.15252/embj.2019102309. - DOI - PMC - PubMed
    1. Crossley MP, Bocek M, Cimprich KA. R-loops as cellular regulators and genomic threats. Mol. Cell. 2019;73:398–411. doi: 10.1016/j.molcel.2019.01.024. - DOI - PMC - PubMed
    1. Garcia-Muse T, Aguilera A. R loops: from physiological to pathological roles. Cell. 2019;179:604–618. doi: 10.1016/j.cell.2019.08.055. - DOI - PubMed
    1. Cerritelli SM, et al. Failure to produce mitochondrial DNA results in embryonic lethality in Rnaseh1 null mice. Mol. Cell. 2003;11:807–815. doi: 10.1016/S1097-2765(03)00088-1. - DOI - PubMed

Publication types

Supplementary concepts