. 2022 May 26;13(1):2939.
doi: 10.1038/s41467-022-30526-x.

Genomic analyses of 10,376 individuals in the Westlake BioBank for Chinese (WBBC) pilot project

Affiliations

Genomic analyses of 10,376 individuals in the Westlake BioBank for Chinese (WBBC) pilot project

Pei-Kuan Cong et al. Nat Commun. .

Abstract

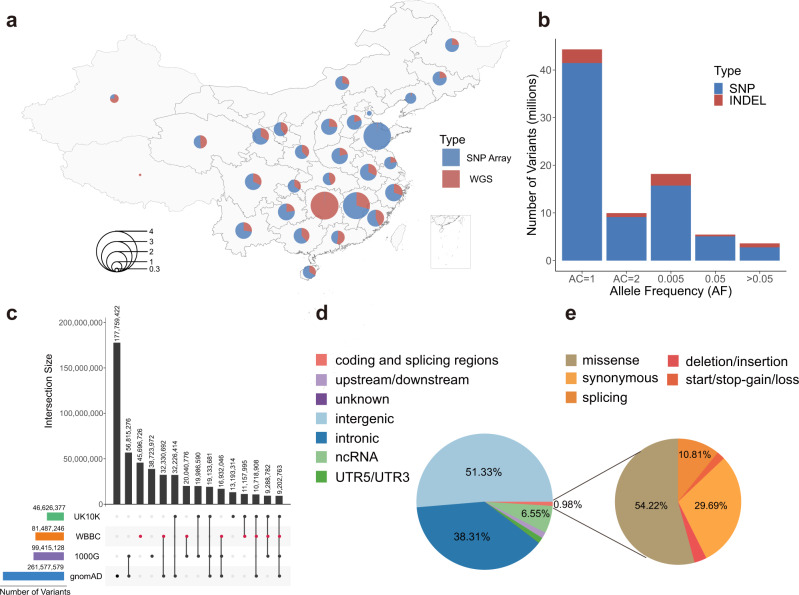
We initiate the Westlake BioBank for Chinese (WBBC) pilot project with 4,535 whole-genome sequencing (WGS) individuals and 5,841 high-density genotyping individuals, and identify 81.5 million SNPs and INDELs, of which 38.5% are absent in dbSNP Build 151. We provide a population-specific reference panel and an online imputation server ( https://wbbc.westlake.edu.cn/ ) which could yield substantial improvement of imputation performance in Chinese population, especially for low-frequency and rare variants. By analyzing the singleton density of the WGS data, we find selection signatures in SNX29, DNAH1 and WDR1 genes, and the derived alleles of the alcohol metabolism genes (ADH1A and ADH1B) emerge around 7,000 years ago and tend to be more common from 4,000 years ago in East Asia. Genetic evidence supports the corresponding geographical boundaries of the Qinling-Huaihe Line and Nanling Mountains, which separate the Han Chinese into subgroups, and we reveal that North Han was more homogeneous than South Han.


Conflict of interest statement

S.-H.Y., W.-W.Z., Y.S., and J.-Q.L. are employees of KingMed Diagnostics Co., Ltd. The other authors have no conflict of interest to declare.

Figures

Fig. 1
Fig. 1. The statistics of samples and variants in the WBBC.
a Sample distribution and statistics by geography. The proportion of samples sequenced by whole-genome sequencing (WGS) and those genotyped by high-density Infinium Asian Screening Array (ASA) were marked in red and blue, respectively. b The number of SNV and INDEL variants identified in the WBBC cohort in five frequency bins: AC = 1, AC = 2, AC > 2 and AF < 0.005, 0.005 ≤ AF ≤ 0.05, and AF > 0.05. c The number of variants in 22 autosomes and X chromosome in the WBBC, 1000 Genome Project (1000G), gnomAD, and UK10K datasets. The horizontal bar plot shows the total number of variants in each of the four datasets. The individual dots and connected dots indicate each dataset and a combination of two or more datasets, respectively. Each vertical bar represents the number of variants in each dataset or overlapping variants in those datasets. d Functional annotations of all variants that were absent in dbSNP Build 151. The proportion of each category was filled with a different color. e The pie chart only displayed the variants in the coding and splicing regions (10 bp from exon-intron boundary). Source data are provided as a Source Data file.
Fig. 2
Fig. 2. Whole-genome-wide recent selection signatures of the Han Chinese population by singleton density score (SDS) analysis.
a Manhattan plot of the natural selection signatures from the WGS data of the Han Chinese individuals. The y-axis represents the -log10 (P) of the two-tailed p values for standardized SDS z-scores. The horizontal red line indicates the significance threshold (p < 5 × 10−8). b The derived allele frequency (DAF) of SNVs with significant selection signatures for different populations. The WBBC-Han is all the Han Chinese individuals sequenced by whole-genome sequencing (WGS) in the WBBC cohort. North, Central, South, and Lingnan are the four Han subgroups. EAS, SAS, EUR, AMR, and AFR come from the 1000 Genome Project (1KG). c The inferred allele frequency trajectory for the derived alleles at rs3819197, rs1229984, and rs671 over the past 9500 years from the ancient individuals of East Asia. The dot indicates the allele frequency in each generation (25 years/generation). Source data are provided as a Source Data file.
Fig. 3
Fig. 3. Imputation performance of five reference panels in the Han Chinese.
a The average R-square (Rsq) and number of well-imputed (Rsq ≥ 0.8) variants in shared sites of five reference panels (729,958 SNPs). All shared variants were grouped into nine MAF bins. b, c The cumulative number and proportion of well-imputed variants in shared sites of five panels, there were 729,958 shared SNPs in total. d Non-reference allele (NR-allele) concordance rate distribution (imputed variants vs. array variants). Each dot represents an individual. The plots on the top and right are the corresponding density distributions. e, f The NR-allele genotype concordance rate for rare, low-frequency, and common variants and overall variants (imputed variants vs. WGS variants). A total of 184 unrelated samples with both sequencing and genotyping data were used for the evaluation. The concordance rates for each variants group with mean value ± SEM, and quartile for each panel were plotted. The 1KG means 1000G Phase 3 and EAS means East Asian group in 1000G Phase 3. All imputations were conducted on chromosome 2. Source data are provided as a Source Data file.
Fig. 4
Fig. 4. PCA and ADMIXTURE analysis of the Han Chinese populations and East Asians.
a A map of the People’s Republic of China showing its 34 administrative divisions. “NA” indicates that the Han Chinese samples were not recruited from that region. The Qinling-Huaihe River line lies in central China, while the Nanling Mountains are in southern China. b Principal component analysis (PCA) of the Han and Minority Chinese individuals from four sub-regions. The administrative divisions are shown by the distinct letters. Minority individuals are marked with “M”. The Han Chinese populations can be classified into four subgroups: North Han (cyan color), Central Han (dark-red color), South Han (purple color), and Lingnan Han (golden color). c ADMIXTURE analysis of 2056 Han Chinese individuals from 27 administrative divisions for the optimal K value = 3. Each vertical bar represents the average proportion of ancestral components in the regions. The length of each color indicates the percentage of inferred ancestry components from ancestral populations. The upper pie charts denote the average proportion of components across individuals from the four subgroups. d Plots of the first two principal components for modern and ancient East Asian individuals. Source data are provided as a Source Data file.
Fig. 5
Fig. 5. FST, IBD, genetic drift, and effective population size of the Han Chinese populations.
a A heatmap of pairwise FST between any two of the 27 administrative divisions in China. The bars on the top and left show the classification of administrative divisions in the four regions. b A heatmap of pairwise IBD segments count between administrative divisions in China. The number of IBD segments is normalized by the sample size of each province. c A maximum-likelihood tree of the Han Chinese in 27 administrative divisions. The plot is rooted in the northernmost province, and the x-axis represents estimated genetic drift. All administrative divisions in the tree are colored by different regions. d Dynamics of effective population sizes of the Han Chinese in four regions. The x-axis means the thousands of years before present. The left panel shows the results on a log-log scale from 1 million to 1000 years ago and the right panel shows the results on a linear scale over the past 20,000 years. e Wilcoxon rank-sum test (two-sided) results for the FST (left panel), normalized IBD segments (middle panel), and relative genetic drift (right panel) between pairwise Northern provinces and pairwise Southern provinces. The quartile for corresponding differences between pairwise provinces was plotted. A total of 12 Northern and 9 Southern provinces were included here. Source data are provided as a Source Data file.

References

    1. Timpson NJ, Greenwood CMT, Soranzo N, Lawson DJ, Richards JB. Genetic architecture: the shape of the genetic contribution to human traits and disease. Nat. Rev. Genet. 2018;19:110–124. doi: 10.1038/nrg.2017.101. - DOI - PubMed
    1. Nielsen R, et al. Tracing the peopling of the world through genomics. Nature. 2017;541:302–310. doi: 10.1038/nature21347. - DOI - PMC - PubMed
    1. Genetics for all. Nat. Genet. 51, 579 (2019). - PubMed
    1. Martin AR, et al. Clinical use of current polygenic risk scores may exacerbate health disparities. Nat. Genet. 2019;51:584–591. doi: 10.1038/s41588-019-0379-x. - DOI - PMC - PubMed
    1. Genome of the Netherlands Consortium. Whole-genome sequence variation, population structure and demographic history of the Dutch population. Nat. Genet. 2014;46:818–825. doi: 10.1038/ng.3021. - DOI - PubMed

Publication types