. 2022 Jun;24(6):928-939.
doi: 10.1038/s41556-022-00913-z. Epub 2022 May 26.

Pan-cancer pervasive upregulation of 3' UTR splicing drives tumourigenesis

Affiliations

Pan-cancer pervasive upregulation of 3' UTR splicing drives tumourigenesis

Jia Jia Chan et al. Nat Cell Biol. 2022 Jun.

Abstract

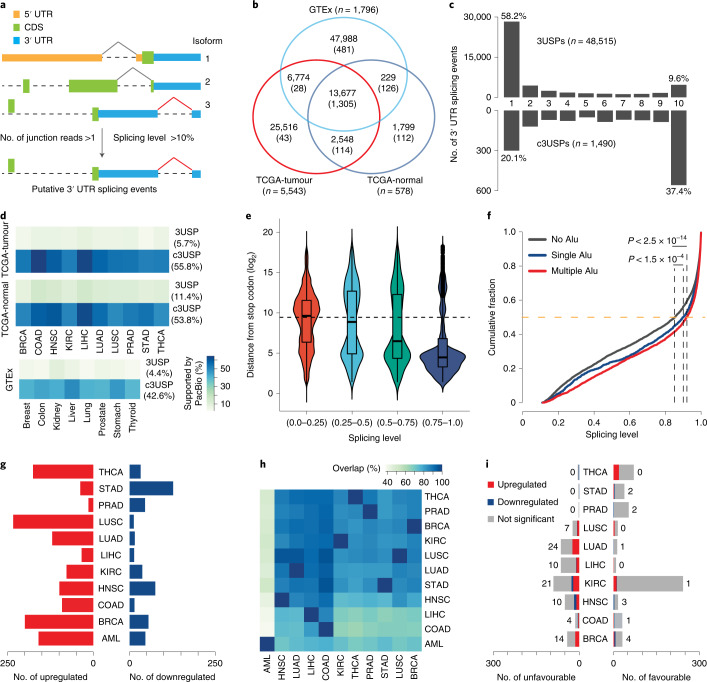
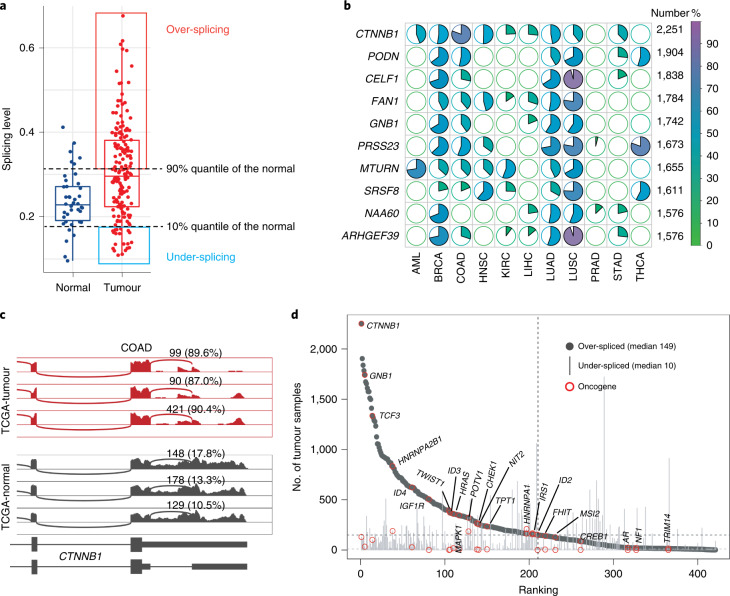
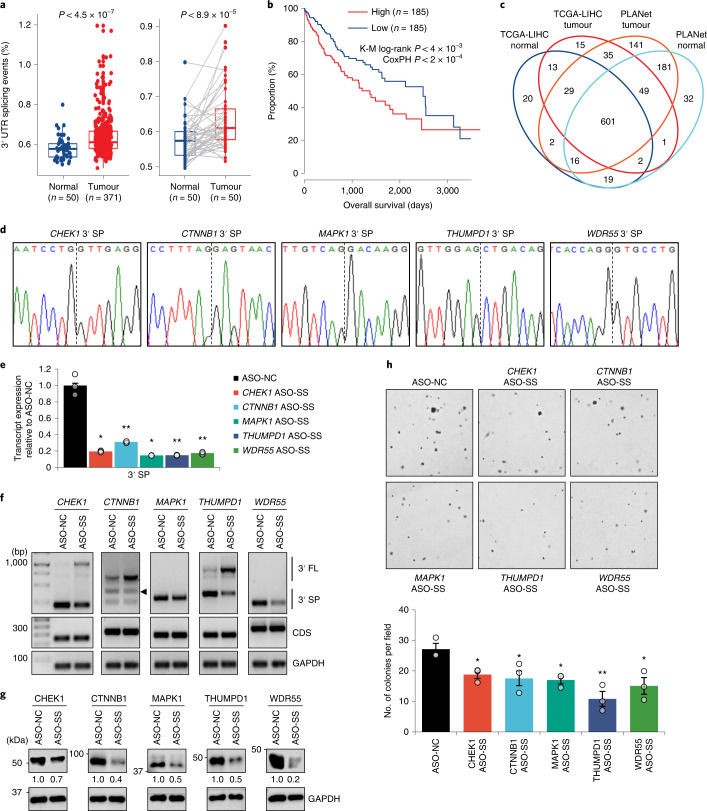
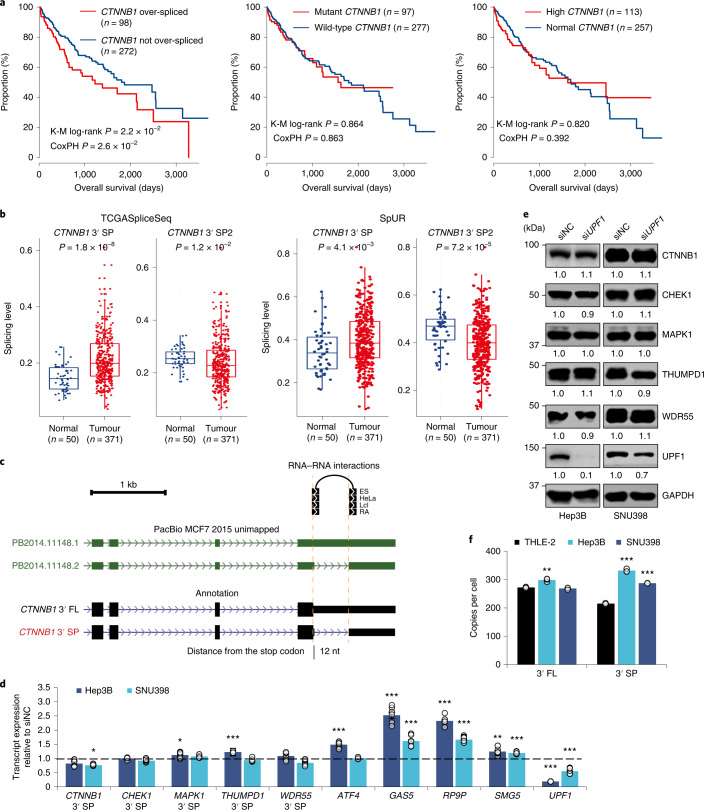
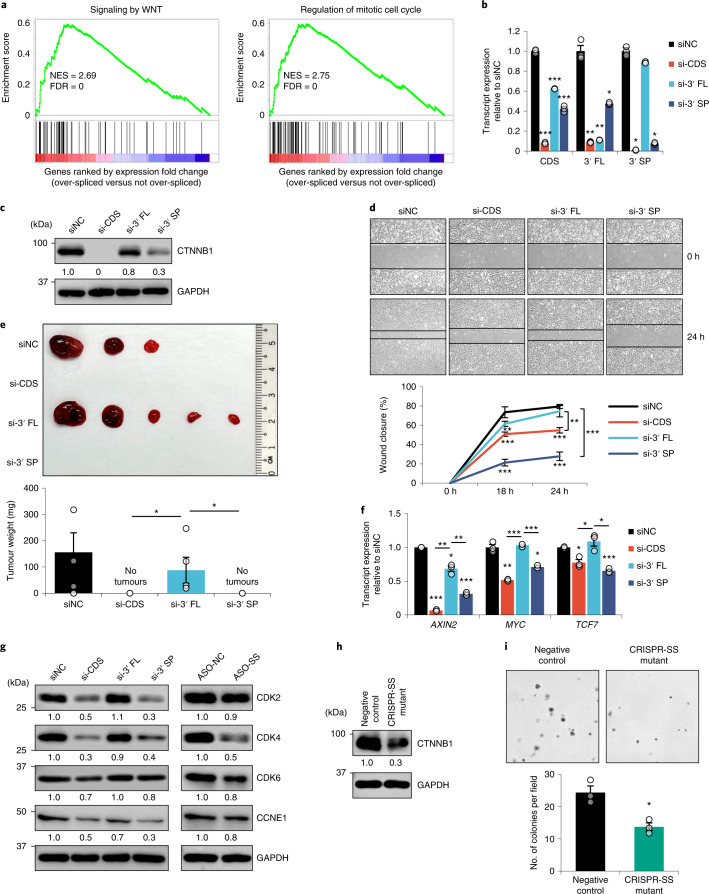
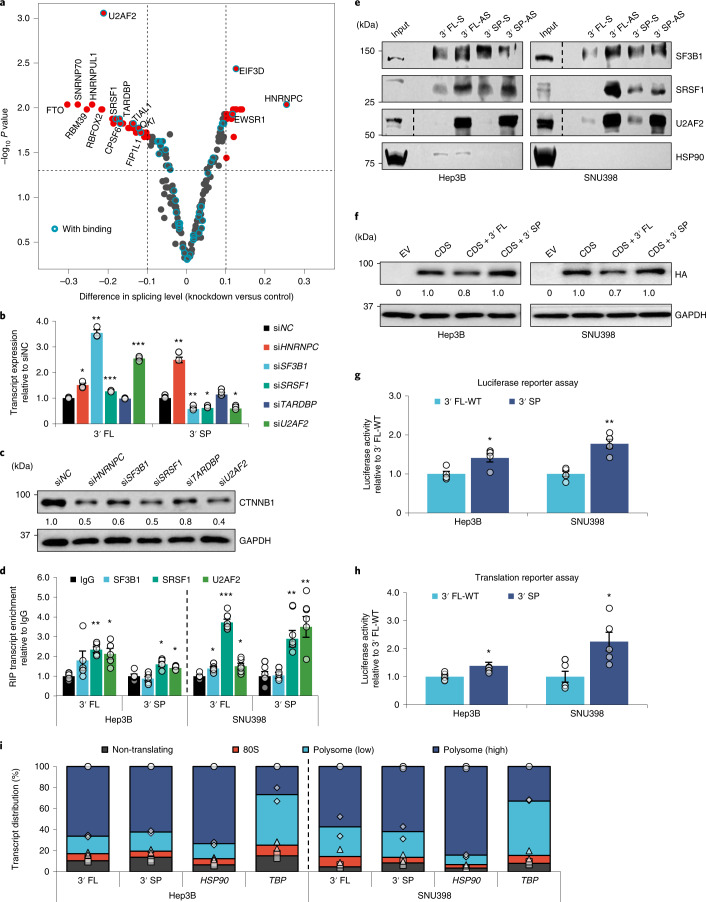
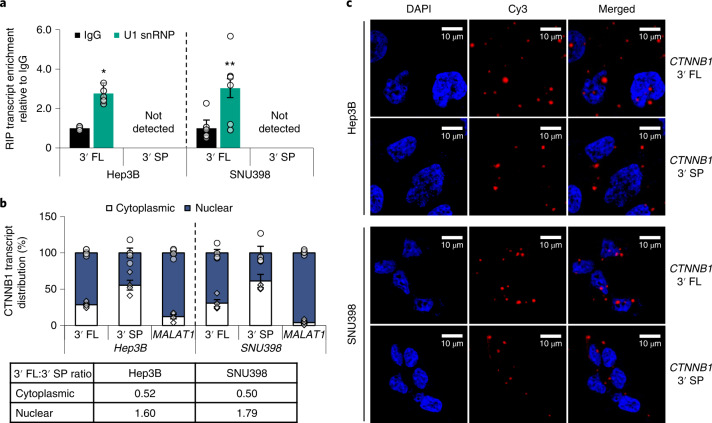
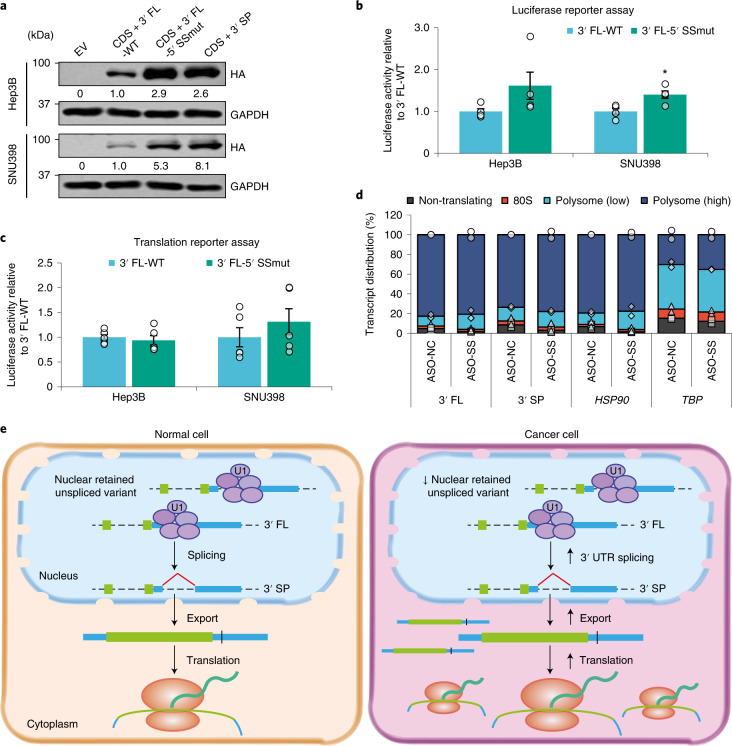
Most mammalian genes generate messenger RNAs with variable untranslated regions (UTRs) that are important post-transcriptional regulators. In cancer, shortening at 3' UTR ends via alternative polyadenylation can activate oncogenes. However, internal 3' UTR splicing remains poorly understood as splicing studies have traditionally focused on protein-coding alterations. Here we systematically map the pan-cancer landscape of 3' UTR splicing and present this in SpUR ( http://www.cbrc.kaust.edu.sa/spur/home/ ). 3' UTR splicing is widespread, upregulated in cancers, correlated with poor prognosis and more prevalent in oncogenes. We show that antisense oligonucleotide-mediated inhibition of 3' UTR splicing efficiently reduces oncogene expression and impedes tumour progression. Notably, CTNNB1 3' UTR splicing is the most consistently dysregulated event across cancers. We validate its upregulation in hepatocellular carcinoma and colon adenocarcinoma, and show that the spliced 3' UTR variant is the predominant contributor to its oncogenic functions. Overall, our study highlights the importance of 3' UTR splicing in cancer and may launch new avenues for RNA-based anti-cancer therapeutics.


Conflict of interest statement

The authors declare no competing interests.

Figures

Fig. 1
Fig. 1. Transcriptome-wide analysis reveals widespread 3′ UTR splicing.
a, Schematic for the identification of 3USPs. b, Venn diagram showing the overlap between 3USPs and c3USPs (in brackets) identified in TCGA-normal, TCGA-tumour and GTEx datasets. c, Bar plots showing the number of 3USPs and c3USPs detected in different numbers of TCGA cancer types. d, Heat map illustrating the percentages of 3USPs and c3USPs supported by PacBio data. e, Distribution of the distance from the stop codon for multiple groups of 3USPs classified by SPLs in TCGA-tumour. f, Cumulative distribution of SPLs of c3USPs in TCGA-tumour with or without Alu elements. P values: Wilcoxon test. g, Bar plots showing the number of significantly upregulated and downregulated c3USPs. h, Heat map illustrating percentages of the identified c3USPs overlapped across ten TCGA cancer types and AML. i, Bar plots showing the number of favourable (hazard ratio <1, P < 0.05) and unfavourable (hazard ratio >1, P < 0.05) c3USPs across ten cancers. Hazard ratios and P values: univariate Cox proportional hazards regression analysis. Source data
Fig. 2
Fig. 2. Pan-cancer analysis identifies CTNNB1 as the top dysregulated c3USP across 11 cancers.
a, Box plot illustrating the definition of over- and under-splicing for each significantly dysregulated c3USP event in each cancer type. Each dot represents one sample. The dashed lines indicate the 10% and 90% quantile of SPLs in the normal samples. b, The top ten 3USPs detected in the highest number of total tumour samples across 11 cancers. #, total number of over-spliced tumour samples; %, percentages in the colour key. c, Sashimi plot illustrating 3′ UTR splicing of the top dysregulated splicing event of CTNNB1 in the normal and tumour samples from COAD. d, Number of tumour samples with over- and under-spliced 3′ UTRs for genes with c3USP. Source data
Fig. 3
Fig. 3. Targeted inhibition of 3′ UTR splicing impedes HCC carcinogenesis.
a, Percentage of 3USPs relative to the total splicing events in all (left) and 50 matched normal-tumour samples (right) from TCGA-LIHC dataset. P values: Mann–Whitney U test. b, Kaplan–Meier (K-M) survival analysis of TCGA-LIHC samples (top and bottom half ranked by numbers of 3USPs). CoxPH, Cox proportional-hazards regression model. c, Venn diagram showing the overlap between c3USPs identified in TCGA and PLANet normal and tumour samples. d, Sanger sequencing validation of the 3′ UTR splice junctions. eh, Effect of ASO-mediated blocking of the 3′ UTR splice site on candidate transcript expression by qPCR (n = 3 independent experiments) (e), PCR (arrowhead, 3′ SP2; see Supplementary Note) (f), protein expression (g) and anchorage-independent growth (n = 3 independent experiments) (h) in Hep3B. ASO-NC, non-targeting control; ASO-SS, splice site ASO. In e and h: mean ± standard error of the mean (s.e.m.); unpaired Student’s t-test *P < 0.05, **P < 0.01 and ***P < 0.001. In f and g: data represent three independent experiments. Source data
Fig. 4
Fig. 4. Analysis of the CTNNB1 spliced 3′ UTR in HCC.
a, Survival analysis of TCGA-LIHC samples by CTNNB1 3′ UTR SPLs (left), somatic mutation status (middle) and transcript expression (right). n, number of patients analysed. K-M, Kaplan-Meier; CoxPH, Cox proportional-hazards regression model. b, SPLs of CTNNB1 3′ SP and 3′ SP2 in normal and HCC tumour samples from the TCGASpliceSeq database (left) and SpUR (right). n, number of RNA-seq samples analysed. c, Genome browser tracks depicting splicing in the CTNNB1 3′ UTR, PacBio long-read sequencing data, RNA–RNA interactions and distance between the splice junction and stop codon. d,e, Effect of UPF1 knockdown on candidate 3′ SP and positive controls (ATF4, GAS5, RP9P and SMG5) transcript (n = 3 independent experiments) (d) and candidate protein (data represent three independent experiments) (e) expression. f, CTNNB1 3′ FL and 3′ SP copy number quantification in THLE-2 and HCC cell lines, Hep3B and SNU398 (n = 3 independent experiments). siNC, siRNA non-targeting control. In d and f: mean ± s.e.m.; unpaired Student’s t-test *P < 0.05, **P < 0.01 and ***P < 0.001. Source data
Fig. 5
Fig. 5. 3′ UTR splicing of CTNNB1 promotes tumourigenesis.
a, GSEA comparing two groups of tumours showing the enrichment of upregulated genes from the gene sets of WNT signalling and mitotic cell cycle in the TCGA-LIHC tumour samples with CTNNB1 3′ UTR over-splicing. bf, Effect of siRNA-mediated knockdown of CTNNB1 CDS, 3′ FL and 3′ SP on CTNNB1 transcript (n = 3 independent experiments) (b) and protein (c) expression, cell migration (n = 3 independent experiments) (d), xenograft tumour growth (n = 5 mice) (e) and WNT target transcript expression (n = 3 independent experiments) (f) in Hep3B. g, Effect of siRNA-mediated CTNNB1 knockdown and ASO-mediated 3′ UTR splicing inhibition on the protein expression of cell cycle markers. h,i, Effect of the CRISPR–Cas9-mediated genomic mutation of the CTNNB1 3′ UTR splice site (CRISPR-SS mutant) on CTNNB1 protein expression (h) and anchorage-independent growth (n = 3 independent experiments) (i) in Hep3B. In b, df and i: mean ± s.e.m.; unpaired Student’s t-test *P < 0.05, **P < 0.01 and ***P < 0.001. In c, g and h: data represent three independent experiments. Source data
Fig. 6
Fig. 6. 3′ UTR splicing may enhance CTNNB1 expression to promote tumourigenesis.
a, Volcano plot showing changes in CTNNB1 3′ UTR splicing upon RBP knockdown. Putative binding was predicted using eCLIP-seq data. b,c, Effect of splicing RBP knockdowns on CTNNB1 transcript (n = 3 independent experiments) (b) and protein (c) expression in Hep3B. d, Enrichment of CTNNB1 transcripts by RBP RIP in Hep3B and SNU398 (n = 4 independent experiments). e, Enrichment of RBPs upon CTNNB1 3′ FL and 3′ SP pulldown using biotinylated probes. f, Effect of overexpressing CTNNB1 CDS, CDS + 3′ FL and CDS + 3′ SP on exogenous CTNNB1 protein expression. g,h, Luciferase activity of plasmid-transfected (n = 4 independent experiments) (g) and RNA-transfected (n = 5 independent experiments) (h) CTNNB1 reporter constructs. i, Polysome profiles for CTNNB1 3′ FL and 3′ SP in Hep3B and SNU398 (n = 2 independent experiments). HSP90 and TBP are housekeeping controls. S, sense; AS, antisense; EV, empty vector. In b, d, g and h: mean ± s.e.m.; unpaired Student’s t-test *P < 0.05, **P < 0.01 and ***P < 0.001. In c, e and f: data represent three independent experiments. Source data
Fig. 7
Fig. 7. 3′ UTR splicing-mediated cytoplasmic localization may enhance CTNNB1 expression.
a, Enrichment of the CTNNB1 3′ FL transcript by U1 snRNP RIP (n = 3 independent experiments). b, Subcellular distribution of CTNNB1 3′ FL and 3′ SP transcripts following nuclear–cytoplasmic fractionation of Hep3B and SNU398 cells. MALAT1 was used as a nuclear control. The 3′ FL:3′ SP transcript ratios in each cellular compartment are presented in the table below (n = 4 independent experiments). c, RNA–FISH showing transcript localization of CTNNB1 3′ FL and 3′ SP in Hep3B and SNU398. Data represent three independent experiments. In a and b: mean ± s.e.m.; unpaired Student’s t-test *P < 0.05, **P < 0.01 and ***P < 0.001. Source data
Fig. 8
Fig. 8. Upregulated 3′ UTR splicing may promote carcinogenesis.
a, Effect of overexpressing CTNNB1 CDS + 3′ FL-WT, CDS + 3′ FL-5′ SSmut and CDS + 3′ SP on exogenous CTNNB1 protein expression. Data represent three independent experiments. b,c, Luciferase activity of plasmid-transfected (n = 4 independent experiments) (b) and RNA-transfected (n = 5 independent experiments) (c) CTNNB1 3′ FL-WT and 3′ FL-5′ SSmut reporter constructs. d, Effect of ASO-mediated blocking of the CTNNB1 3′ UTR splice site on the polysome profiles for CTNNB1 (n = 2 independent experiments). HSP90 and TBP are housekeeping controls. e, Schematic depicting how increased 3′ UTR splicing may promote carcinogenesis. In b and c: mean ± s.e.m.; unpaired Student’s t-test *P < 0.05, **P < 0.01 and ***P < 0.001. Source data
Extended Data Fig. 1
Extended Data Fig. 1. Global analysis of 3’UTR splicing events with TCGA and GTEx datasets.
a, Heatmap illustrating the percentage overlap of c3USPs identified from TCGA-normal and GTEx samples. The rows and columns indicate the TCGA-normal and GTEx tissues, respectively. b, Boxplot showing the distribution of the percentage of 3’UTR splicing events identified in TCGA-normal that overlapped with those from GTEx, including 3USPs, c3USPs and their corresponding backgrounds. c-d, Bar plots showing the number of 3USPs and c3USPs detected in the TCGA-normal samples of different numbers of cancer types (c) and different tissues from GTEx (d). The x-axis indicate the number of cancer types (Supplementary Table 1). e, Proportion of novel c3USPs that are not annotated or reported in previous studies. f-j, Distribution of the distance from the stop codon for multiple groups of c3USPs (f-h) and 3USPs (i,j) classified by splicing levels in TCGA-tumor (f), TCGA-normal (g,i) and GTEx (h,j). k-l, Cumulative distribution of splicing levels of c3USPs in TCGA-normal (k) and GTEx (l) with or without Alu elements. P-values: Wilcoxon test. Source data
Extended Data Fig. 2
Extended Data Fig. 2. 3’UTR splicing is upregulated in cancer and correlated with poor prognosis.
a, Workflow of the analysis for each c3USP in each cancer type. b, Bar plot showing the number of genes with up and downregulated c3USPs. c, Bar plot illustrating the proportion of oncogenes and tumor suppressors in two groups of genes with either upregulated or downregulated c3USPs. P-values: hypergeometric test. d, Heatmap illustrating p-values derived from overlapping c3USPs between each two cancer types (hypergeometric test). P-values >0.001 are labeled. e, Bar plot showing the number of favorable and unfavorable prognostic c3USPs across different cancer types derived from the Kaplan-Meier method with a p < 0.05 cutoff. f, Bar plot illustrating the proportion of favorable and unfavorable markers in upregulated and downregulated c3USPs. g-i, Sashimi plots illustrating 3’UTR splicing of the top dysregulated splicing event of CTNNB1 in the normal and tumor samples from AML (g), TCGA-BRCA (h) and -LIHC (i). j, Number of 3’UTR splicing events in all (left), and 50 matched tumor-normal samples (right) from the TCGA-LIHC dataset. n: number of RNA-seq samples analyzed; P-values: Mann-Whitney U test. k, Kaplan-Meier survival analysis of TCGA-LIHC samples based on the segmentation numbers of total splicing events (top and bottom half of samples ranked by numbers). n: number of patients analyzed.
Extended Data Fig. 3
Extended Data Fig. 3. Targeted inhibition of 3’UTR splicing impedes HCC carcinogenesis.
a, Overlap of 3USPs identified from in-house and TCGA-LIHC data. b, Scatterplot illustrating the dysregulation of c3USPs from the PLANet and TCGA-LIHC datasets. c-f, Effect of ASO-mediated blocking of the 3’UTR splice site on candidate 3’SP transcript expression by qPCR (n = 3 independent experiments) (c), candidate 3’FL, 3’SP and CDS transcript expression by PCR (◄ 3’SP2, see Supplementary Note) (d), protein expression (e) and anchorage-independent growth (n = 3 independent experiments) (f) in HepG2. CDS: coding sequence; 3’FL: full length 3’UTR; 3’SP: spliced 3’UTR; ASO-NC: non-targeting control ASO; ASO-SS: splice site ASO. c,f, Mean ± SEM; unpaired Student’s t-test *p < 0.05, **p < 0.01, ***p < 0.001. d,e, Data shown represent three independent experiments. Source data
Extended Data Fig. 4
Extended Data Fig. 4. Targeted inhibition of 3’UTR splicing impedes HCC cell proliferation.
a-e, Effect of ASO-mediated blocking of the 3’UTR splice site on the protein expression of cell cycle markers (a), candidate transcript expression by qPCR (n = 3 independent experiments) (b), and PCR (◄ 3’SP2, see Supplementary Note) (c), candidate protein expression (d) and anchorage-independent growth (n = 3 independent experiments) (e) in Hep3B and HepG2. CDS: coding sequence; 3’FL: full length 3’UTR; 3’SP: spliced 3’UTR; ASO-NC: non-targeting control ASO; ASO-SS: splice site ASO. b,e, Mean ± SEM; unpaired Student’s t-test *p < 0.05, **p < 0.01, ***p < 0.001. a,c,d, Data shown represent three independent experiments. Source data
Extended Data Fig. 5
Extended Data Fig. 5. CTNNB1 3’SP2 does not affect CTNNB1 expression and HCC tumorigenesis.
a-c, Effect of siRNA-mediated knockdown of CTNNB1 3’SP2 on CTNNB1 transcript (n = 2 independent experiments) (a) and protein (b) expression, and anchorage-independent growth (n = 3 independent experiments) (c) in Hep3B and SNU398. d, Luciferase activity of reporter constructs with CTNNB1 3’FL, 3’SP and 3’SP2 (n = 3 independent experiments). e, PCR analysis of 3’FL and 3’SP expression in mouse adjacent normal and liver tumor samples (left). Alignment of the 3’UTR splice junctions and flanking regions of human CTNNB1 (hsCTNNB1 NCBI RefSeq) and the mouse CTNNB1 3’UTR splice variant (spliced-PCR, detected via Sanger sequencing of the PCR product) (right). CDS and 3’UTR in upper- and lowercase, human 5’ and 3’ exons in black and green, and mouse in blue and red, respectively. siNC: siRNA non-targeting control; CDS: coding sequence; 3’FL: full length; 3’SP: spliced 3’UTR. c,d, Mean ± SEM; unpaired Student’s t-test *p < 0.05, **p < 0.01, ***p < 0.001. b,e, Data shown represent three independent experiments. Source data
Extended Data Fig. 6
Extended Data Fig. 6. 3’UTR splicing of CTNNB1 promotes HCC tumorigenesis.
a, Gene set enrichment analysis (GSEA) showing the enrichment of upregulated genes from the WNT signaling and mitotic cell cycle gene sets in the PLANet tumor samples with CTNNB1 3’UTR over-splicing. b-g, Effect of siRNA-mediated knockdown of CTNNB1 CDS, 3’FL and 3’SP on CTNNB1 transcript (n = 3 independent experiments) (b) and protein expression (c) in SNU398, anchorage-independent growth in Hep3B and SNU398 (n = 3 independent experiments) (d), cell migration (n = 2 independent experiments) (e), WNT target transcript (n = 3 independent experiments) (f) and protein expression (g) in SNU398. h, Chromatograms depicting Sanger sequencing validation of the negative control and CRISPR-Cas9-mediated T > G mutation (highlighted) of the CTNNB1 3’UTR splice site (CRISPR-SS mutant) at the genomic level. The red arrow indicates the G > C mutation introduced to the PAM sequence to prevent further Cas9 cleavage. i, Effect of the CRISPR-SS mutation on CTNNB1 transcript expression (n = 3 independent experiments). siNC: siRNA non-targeting control; CDS: coding sequence; 3’FL: full length; 3’SP: spliced 3’UTR. b,d,f,i, Mean ± SEM; unpaired Student’s t-test *p < 0.05, **p < 0.01, ***p < 0.001. c,g, Data shown represent three independent experiments. Source data
Extended Data Fig. 7
Extended Data Fig. 7. 3’UTR splicing of CTNNB1 promotes HCC tumorigenesis.
a-d, Effect of siRNA-mediated knockdown of CTNNB1 CDS, 3’FL and 3’SP on CTNNB1 transcript expression by qPCR (n = 3 independent experiments) (a) and PCR (b), protein expression (c) and anchorage-independent growth (n = 3 independent experiments) (d). siNC: siRNA non-targeting control; CDS: coding sequence; 3’FL: full length 3’UTR; 3’SP: spliced 3’UTR. a,d, Mean ± SEM; unpaired Student’s t-test *p < 0.05, **p < 0.01, ***p < 0.001. b,c, Data shown represent three independent experiments. Source data
Extended Data Fig. 8
Extended Data Fig. 8. 3’UTR splicing of CTNNB1 promotes COAD tumorigenesis.
a, Proportion of 3’UTR splicing events in all (left), and 41 matched tumor-normal samples (right) from the TCGA-COAD dataset. P-values: Mann-Whitney U test; n: number of RNA-seq samples analyzed. b,c, Kaplan-Meier survival analysis of TCGA-COAD samples based on the segmentation numbers of 3USPs (b) and total splicing events (c) (top and bottom half of samples ranked by numbers). n: number of patients analyzed. d, Proportion of CTNNB1 3’UTR splicing events in all normal and tumor samples from the TCGA-COAD dataset. n: number of RNA-seq samples analyzed. e, Comparison of the CTNNB1 3’SP transcript expression between paired normal and COAD clinical samples (n = 12 patient samples). f-i, Effect of ASO-mediated blocking of the 3’UTR splice site on CTNNB1 transcript expression by qPCR (n = 3 independent experiments) (f), and PCR (g), protein expression (h) and anchorage-independent growth (n = 3 independent experiments) (i) in DLD-1. j-m, Effect of siRNA-mediated knockdown of CTNNB1 on CTNNB1 transcript (n = 3 independent experiments) (j), CTNNB1 and WNT target proteins (k) and WNT target transcript (n = 3 independent experiments) (l) expression, and anchorage-independent growth (n = 3 independent experiments) (m) in DLD-1. ASO-NC: non-targeting control ASO; ASO-SS: splice site ASO; CDS: coding sequence; 3’FL: full length 3’UTR; 3’SP spliced 3’UTR. e,f,i,j,l,m, Mean ± SEM; unpaired Student’s t-test *p < 0.05, **p < 0.01, ***p < 0.001. g,h,k, Data shown represent three independent experiments. Source data
Extended Data Fig. 9
Extended Data Fig. 9. 3’UTR splicing may enhance CTNNB1 protein expression in HCC.
a, Number of c3USPs that are significantly up/downregulated upon the knockdown of RBPs compared to controls. b-e, Effect of the knockdown of splicing factors on the individual RBP transcript expression (n = 3 independent experiments) (b) and CDS exon-exon junctions (n = 3 independent experiments) (c) in Hep3B and SNU398, CTNNB1 transcript (n = 3 independent experiments) (d) and CTNNB1 protein (data shown represent three independent experiments) (e) expression in SNU398. f, Schematic representation of the CTNNB1 CDS, CDS + 3’FL and CDS + 3’SP overexpression constructs. g, Effect of overexpressing CTNNB1 CDS, CDS + 3’FL and CDS + 3’SP on CTNNB1 transcript expression in Hep3B and SNU398 (n = 3 independent experiments). siNC: siRNA non-targeting control; CDS: coding sequence; 3’FL: full length 3’UTR; 3’SP: spliced 3’UTR. b-d,g, Mean ± SEM; unpaired Student’s t-test *p < 0.05, **p < 0.01, ***p < 0.001. Source data
Extended Data Fig. 10
Extended Data Fig. 10. 3’UTR splicing-mediated cytoplasmic localization enhances CTNNB1 expression.
a,b, Effect of overexpressing CTNNB1 CDS, CDS + 3’FL and CDS + 3’SP on endogenous CTNNB1 transcript (n = 3 independent experiments) (a) and exogenous CTNNB1 protein (b) expression in DLD-1. c, Luciferase activity of reporter constructs with CTNNB1 3’FL and 3’SP in DLD-1 (n = 3 independent experiments). d, Effect of actinomycin D (ActD) treatment on the transcript levels of exogenously expressed CTNNB1 CDS, CDS + 3’FL and CDS + 3’SP in Hep3B and SNU398 (n = 3 independent experiments). e,f, Effect of cycloheximide (CHX) (e) or MG132 (f) treatment on exogenously expressed CTNNB1 protein levels of in Hep3B and SNU398. g, Subcellular distribution of CHEK1 3’FL and 3’SP transcripts following nuclear-cytoplasmic fractionation of Hep3B and SNU398 cells (n = 3 independent experiments). MALAT1 was used as a nuclear control. The 3’FL:3’SP transcript ratios in each cellular compartment are shown in the table below. h, RNA-FISH showing transcript localization of CHEK1 3’FL and 3’SP in SNU398. EV: empty vector; CDS: coding sequence; 3’FL: full length 3’UTR; 3’SP spliced 3’UTR. a,c,d,g, Mean ± SEM; unpaired Student’s t-test *p < 0.05, **p < 0.01, ***p < 0.001. b,e,f,h, Data shown represent three independent experiments. Source data

References

    1. Mayr C. What are 3’ UTRs doing? Cold Spring Harb. Perspect. Biol. 2018;11:a034728. doi: 10.1101/cshperspect.a034728. - DOI - PMC - PubMed
    1. Kataoka K, et al. Aberrant PD-L1 expression through 3′-UTR disruption in multiple cancers. Nature. 2016;534:402–406. doi: 10.1038/nature18294. - DOI - PubMed
    1. Schuster SL, Hsieh AC. The untranslated regions of mRNAs in cancer. Trends Cancer. 2019;5:245–262. doi: 10.1016/j.trecan.2019.02.011. - DOI - PMC - PubMed
    1. Mayr C, Bartel DP. Widespread shortening of 3′ UTRs by alternative cleavage and polyadenylation activates oncogenes in cancer cells. Cell. 2009;138:673–684. doi: 10.1016/j.cell.2009.06.016. - DOI - PMC - PubMed
    1. Lianoglou S, Garg V, Yang JL, Leslie CS, Mayr C. Ubiquitously transcribed genes use alternative polyadenylation to achieve tissue-specific expression. Genes Dev. 2013;27:2380–2396. doi: 10.1101/gad.229328.113. - DOI - PMC - PubMed

Publication types

Substances