. 2022 Jun;7(6):820-830.
doi: 10.1038/s41564-022-01127-7. Epub 2022 May 26.

Chromosome organization affects genome evolution in Sulfolobus archaea

Affiliations

Chromosome organization affects genome evolution in Sulfolobus archaea

Catherine Badel et al. Nat Microbiol. 2022 Jun.

Abstract

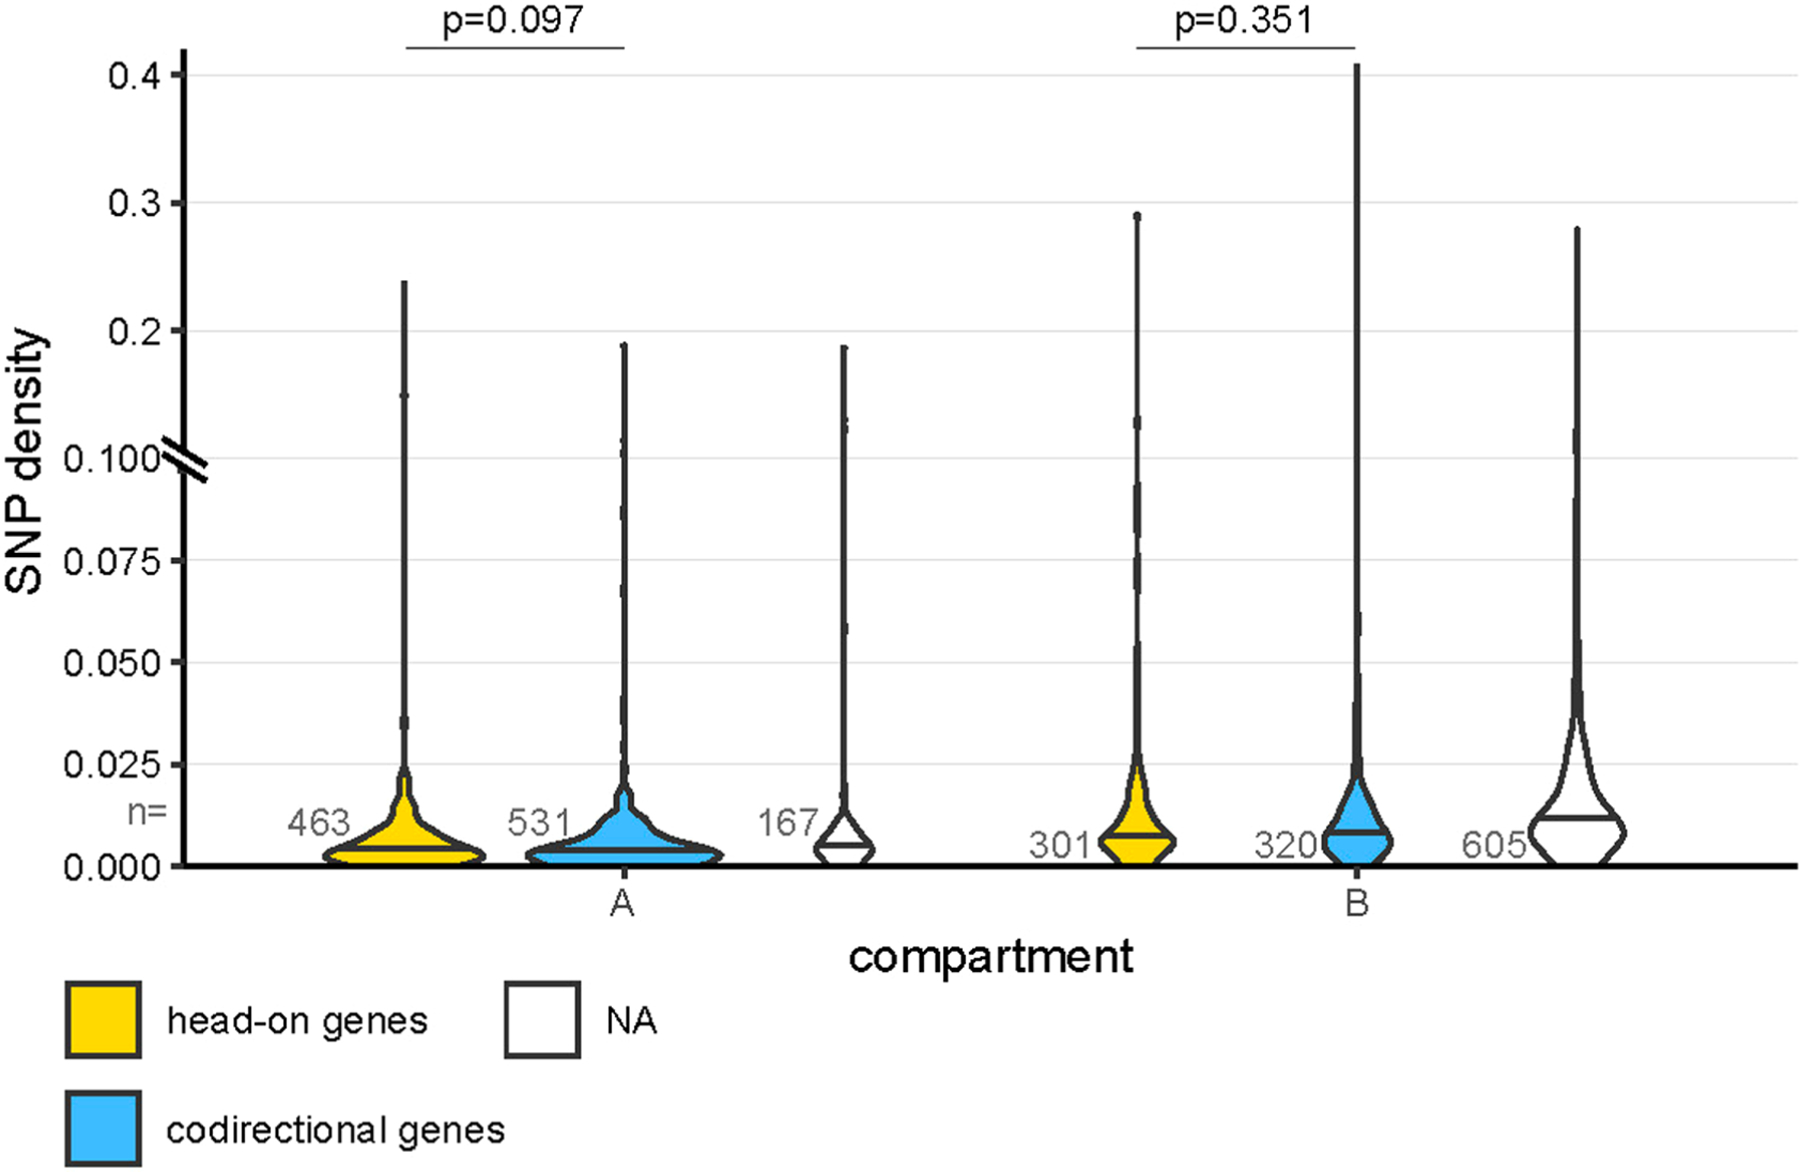
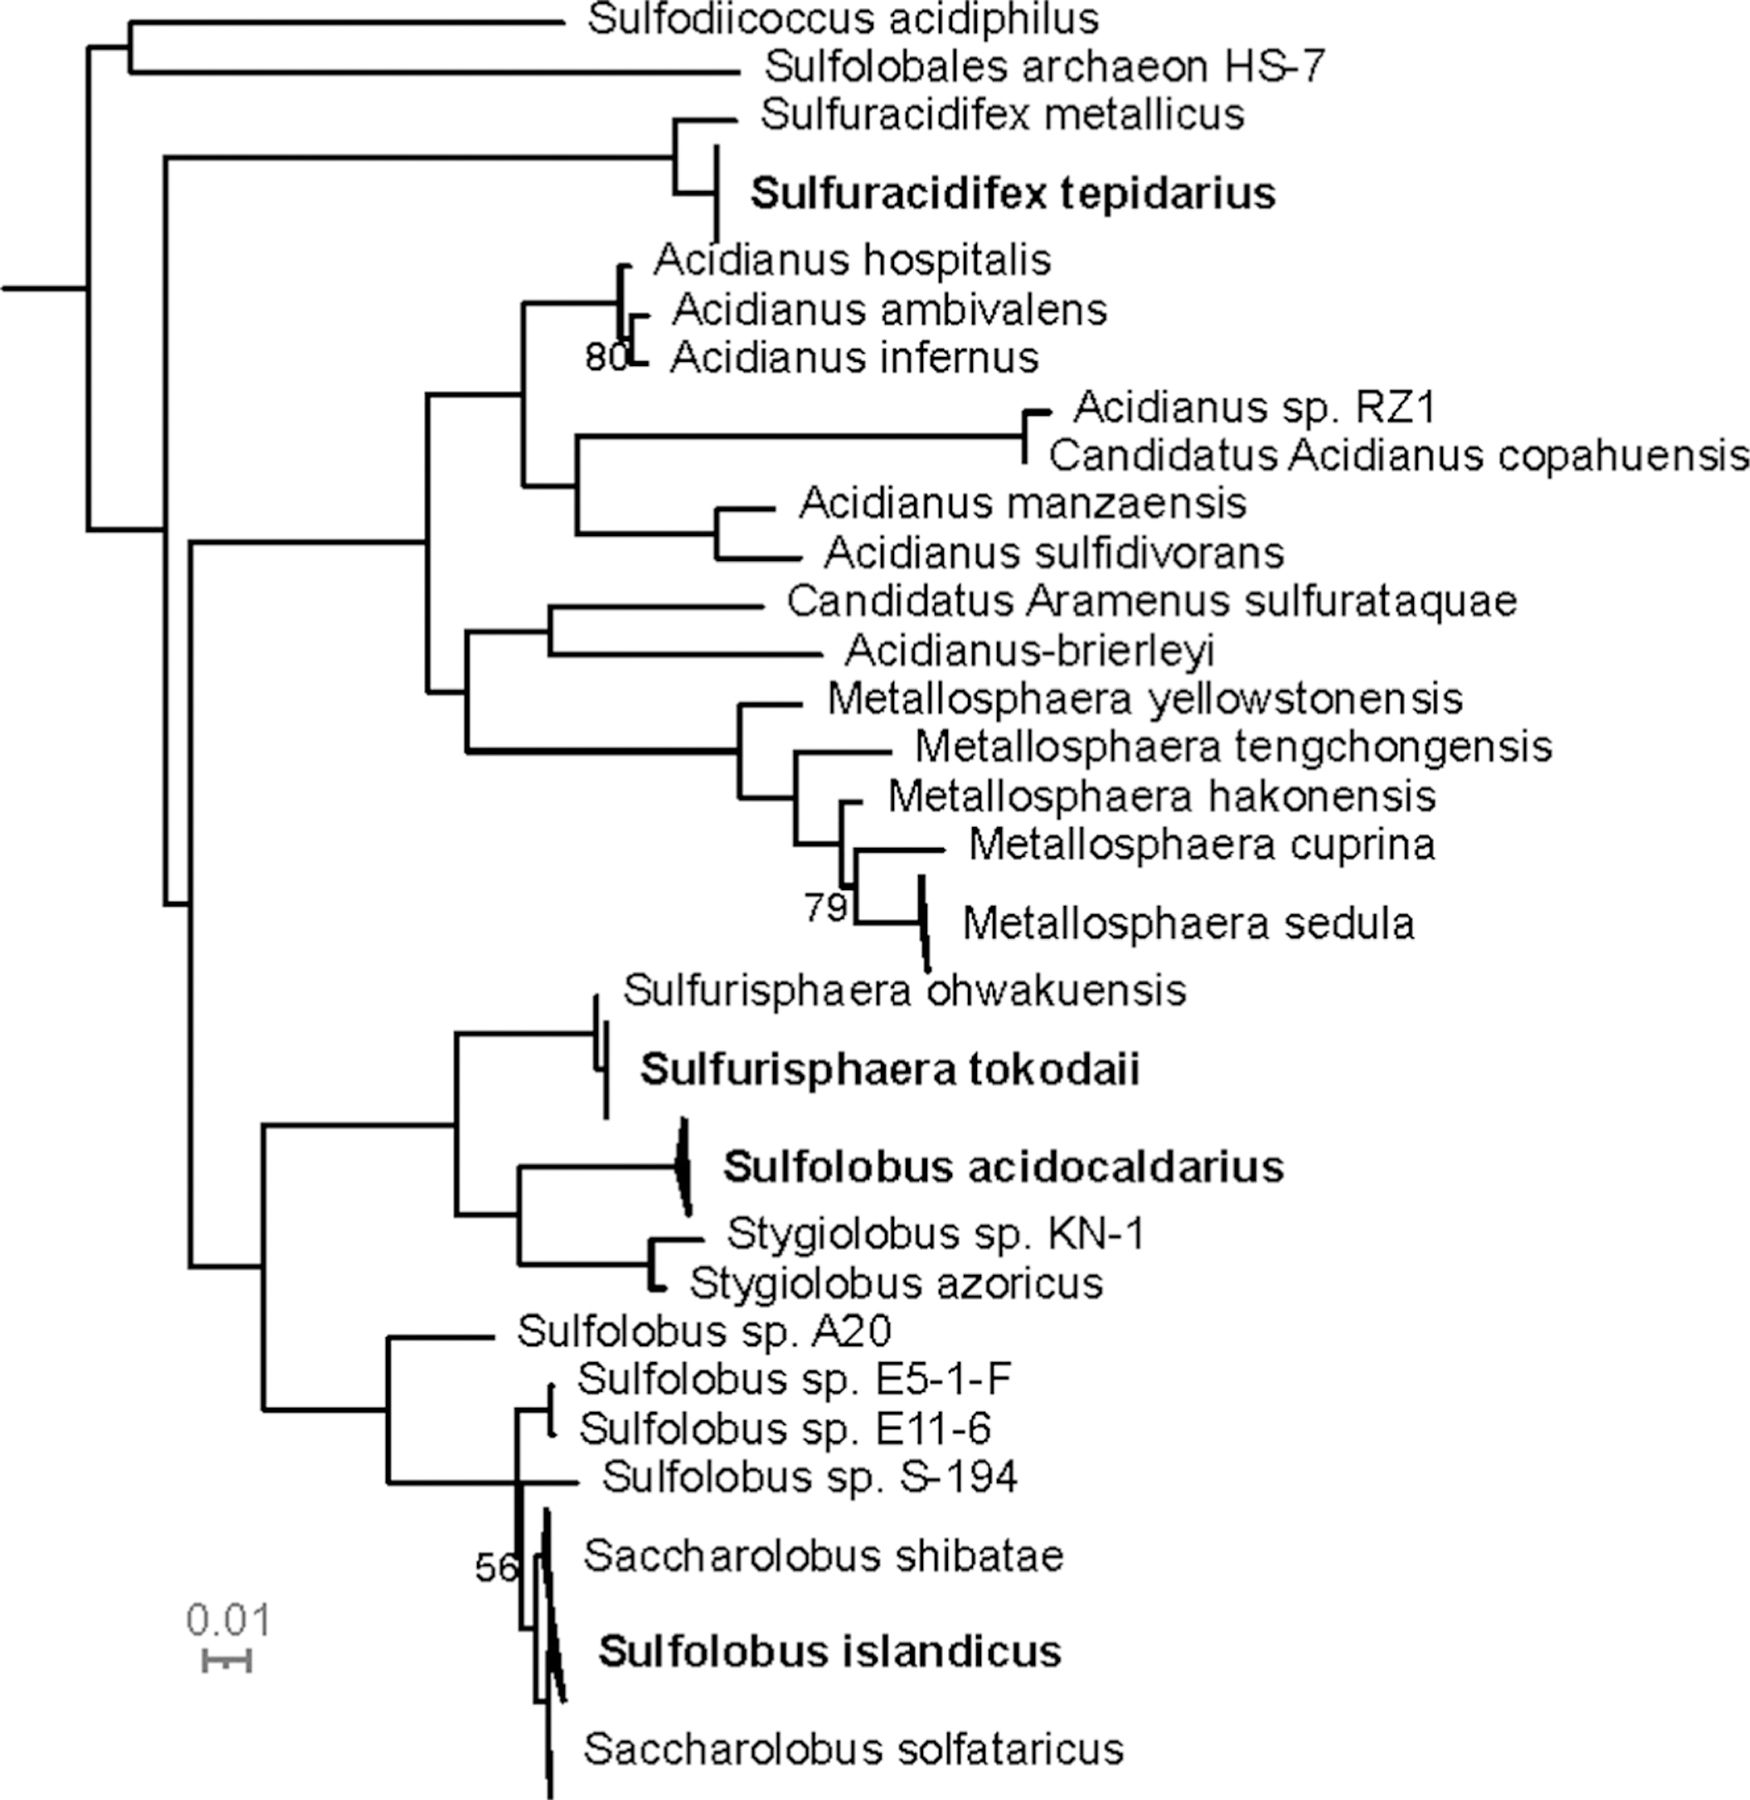
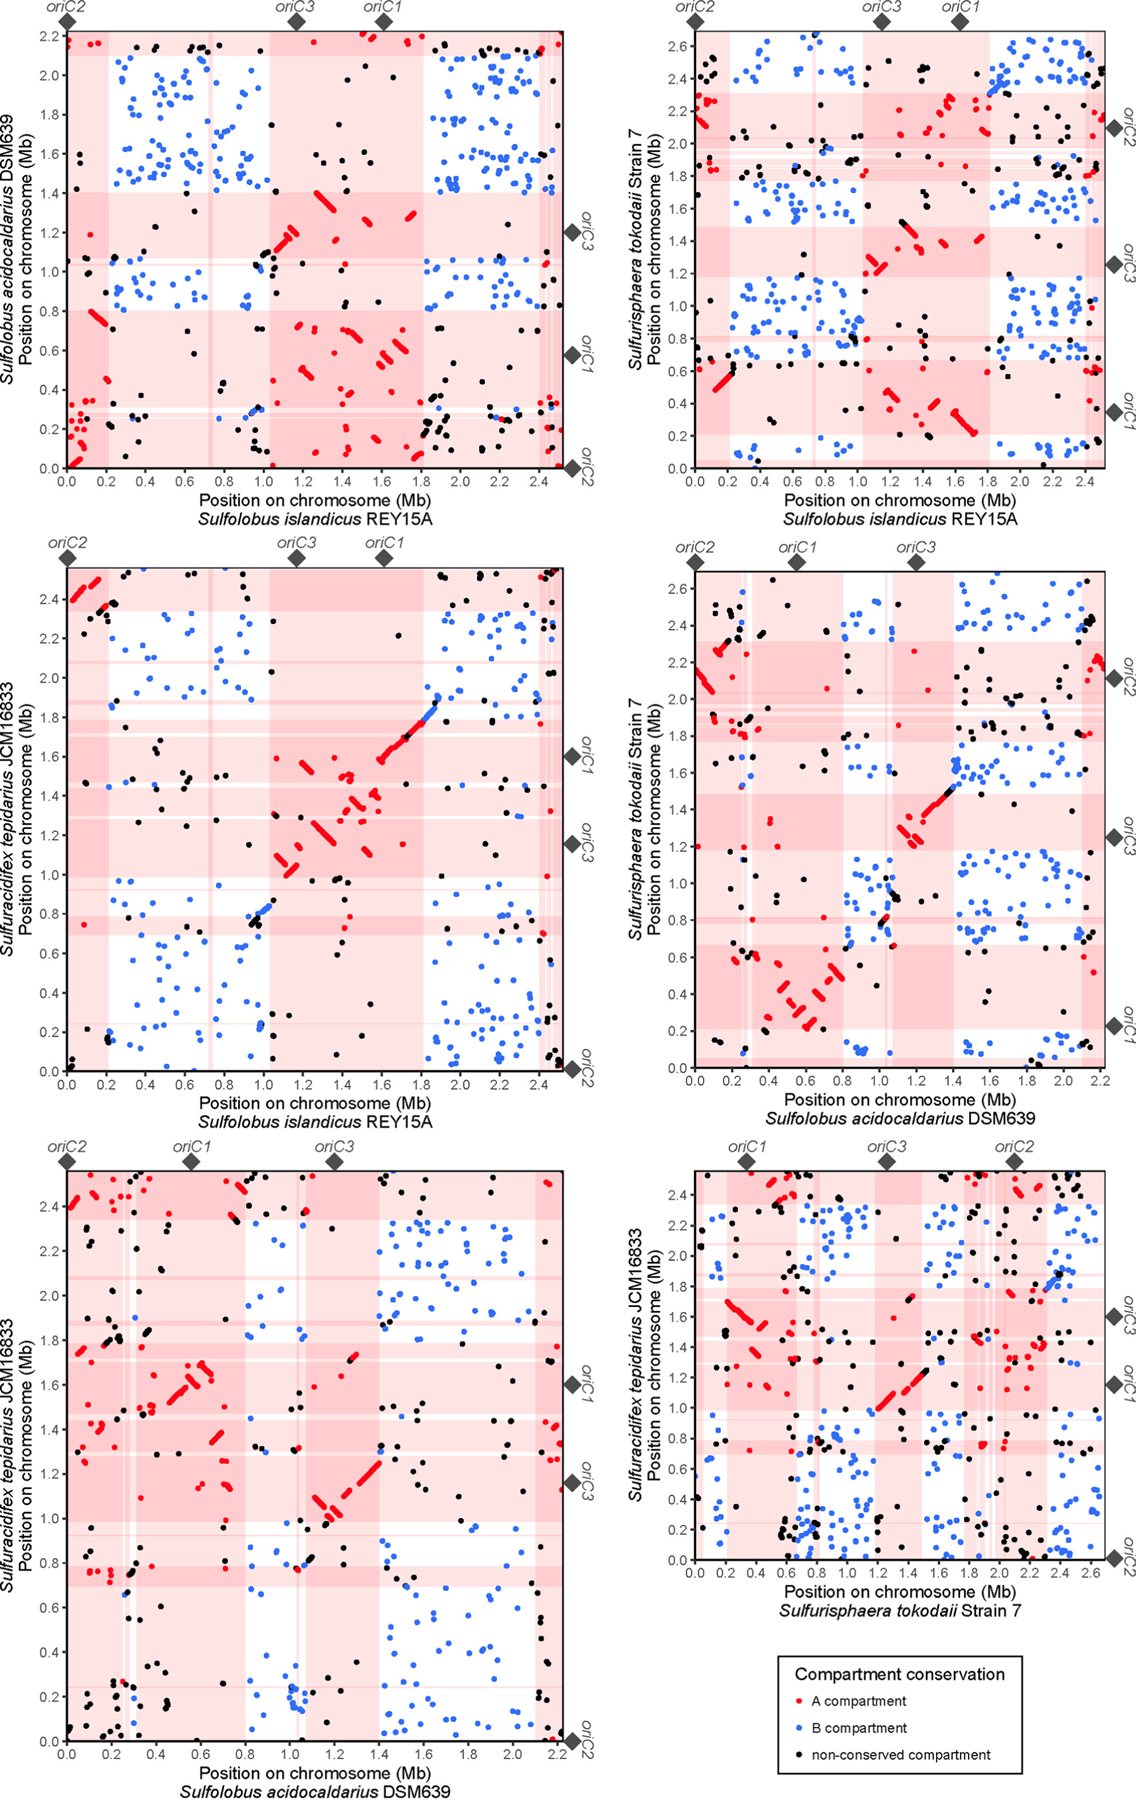
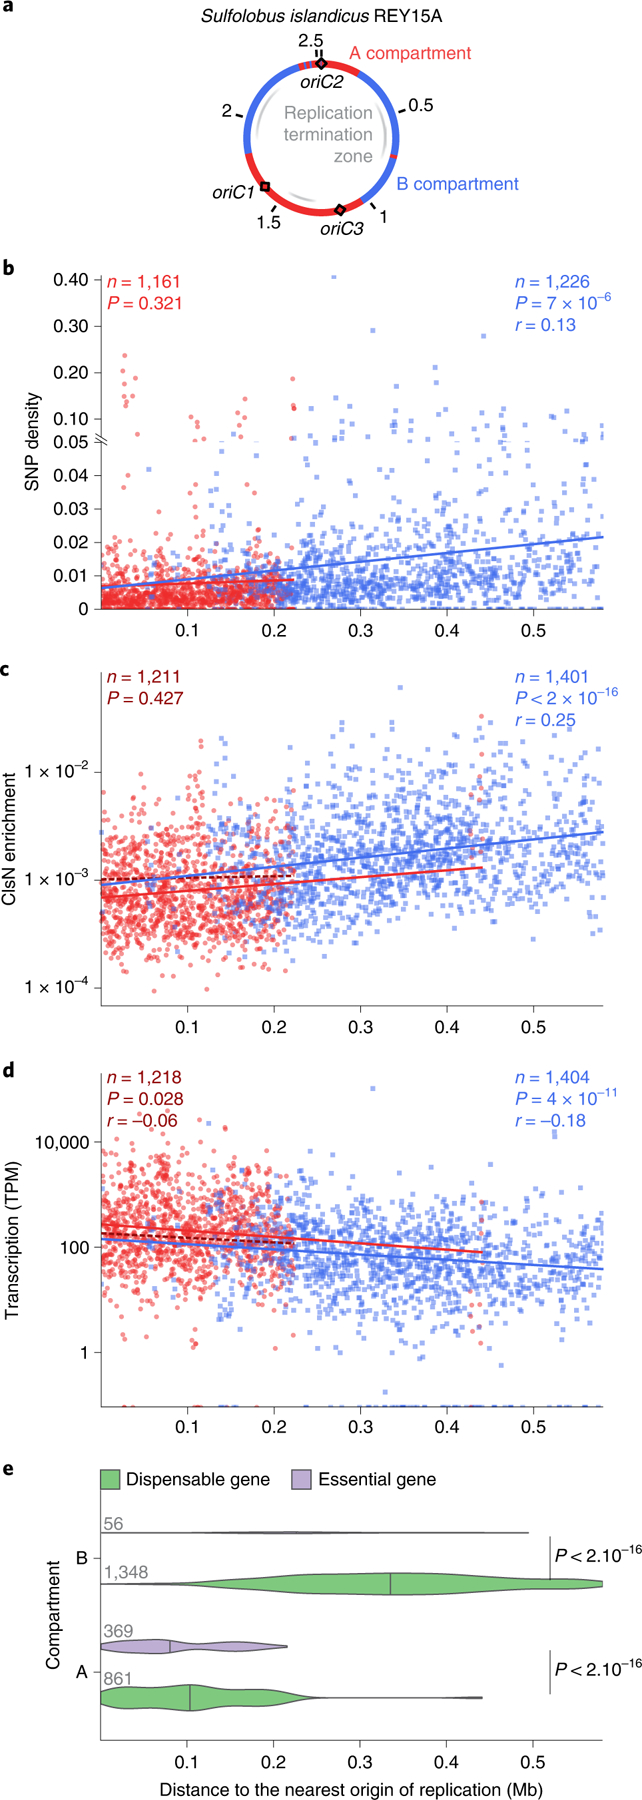
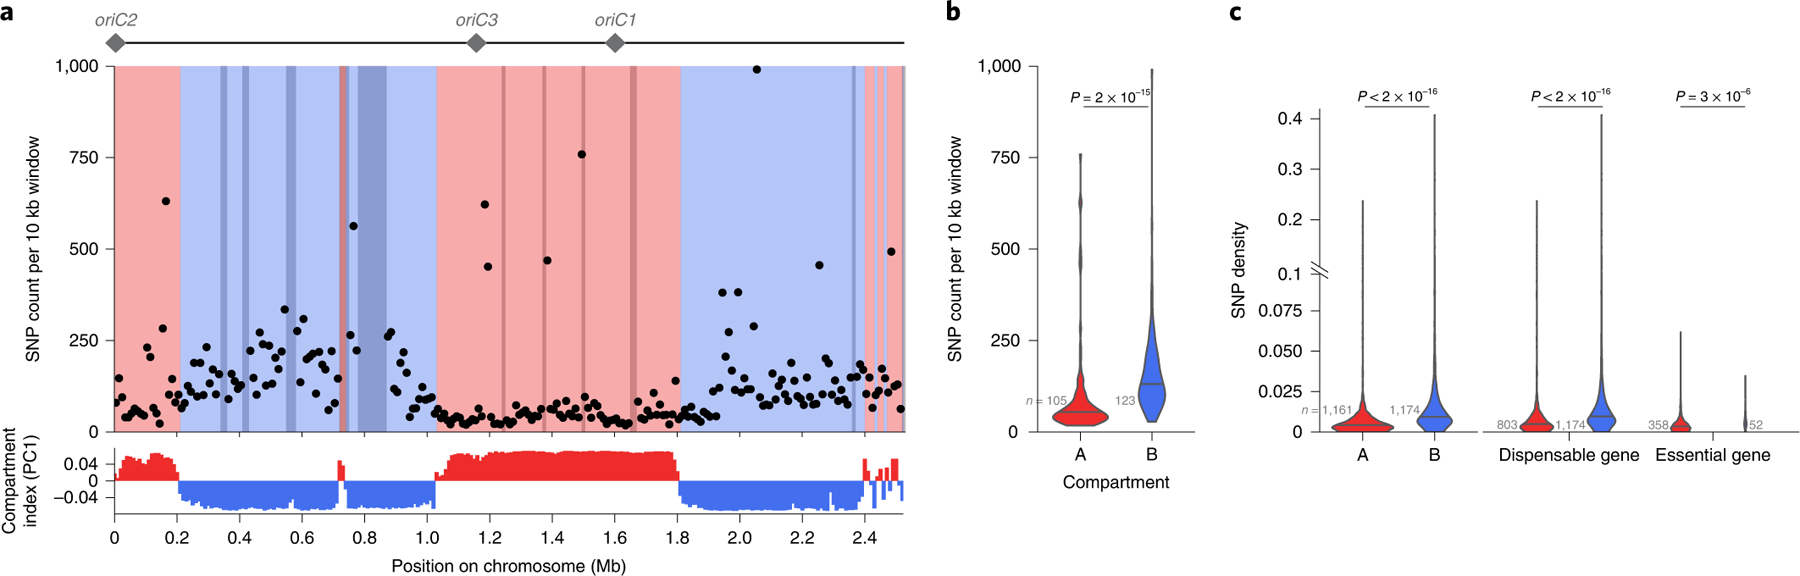
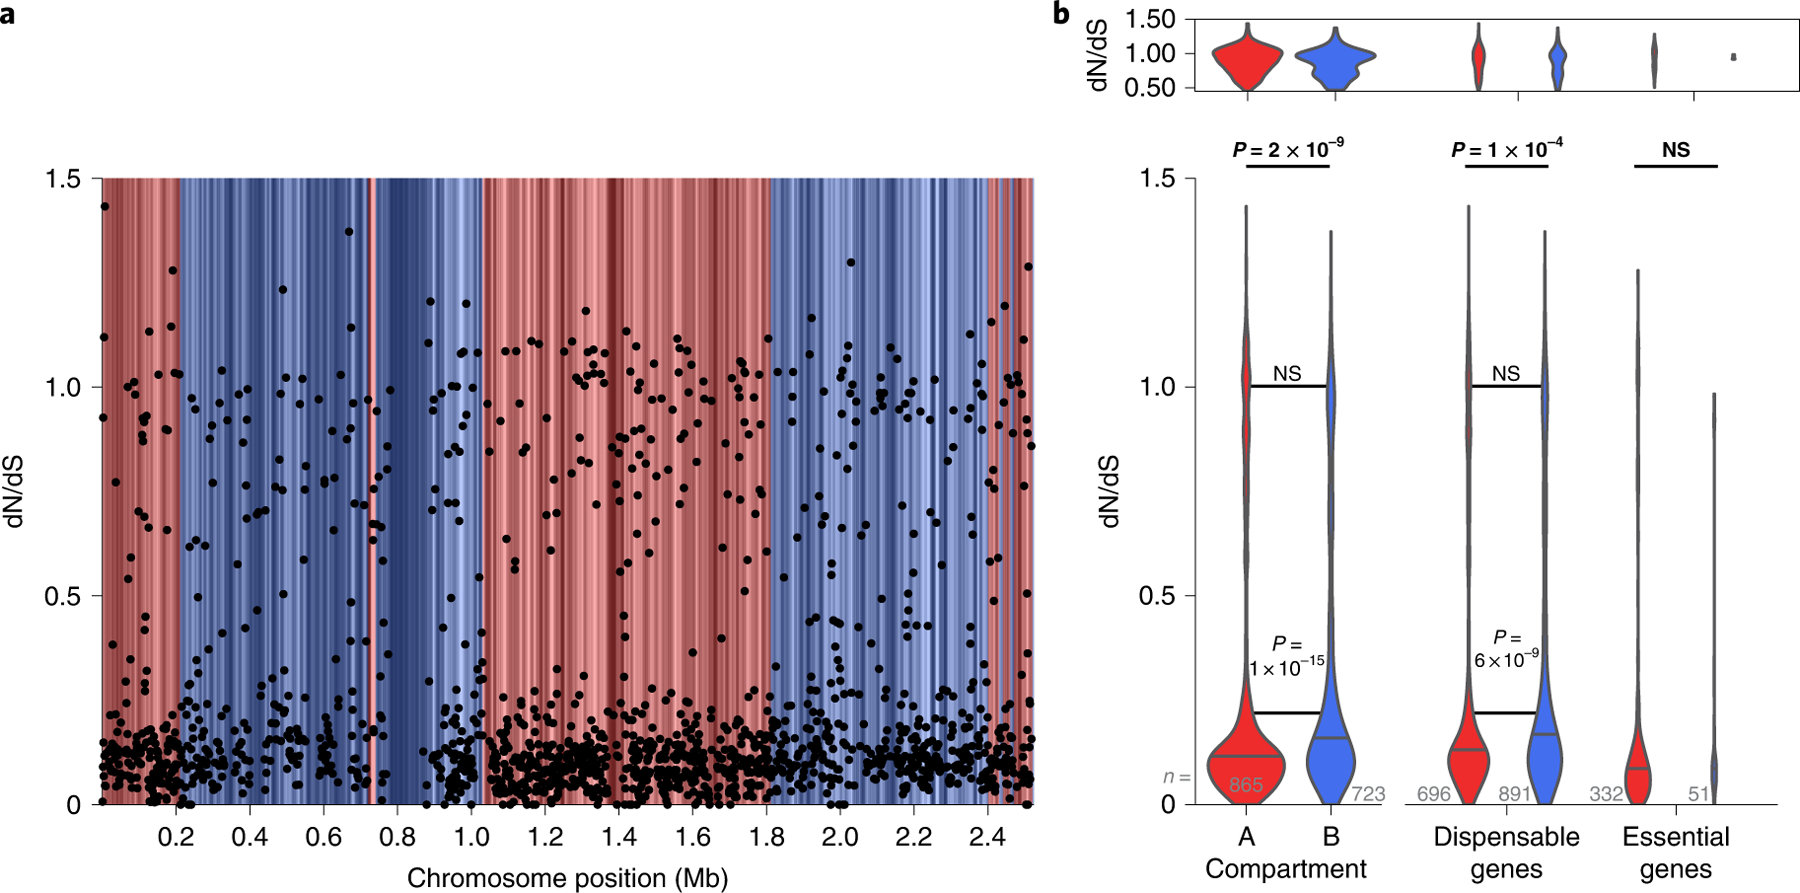
In all organisms, the DNA sequence and the structural organization of chromosomes affect gene expression. The extremely thermophilic crenarchaeon Sulfolobus has one circular chromosome with three origins of replication. We previously revealed that this chromosome has defined A and B compartments that have high and low gene expression, respectively. As well as higher levels of gene expression, the A compartment contains the origins of replication. To evaluate the impact of three-dimensional organization on genome evolution, we characterized the effect of replication origins and compartmentalization on primary sequence evolution in eleven Sulfolobus species. Using single-nucleotide polymorphism analyses, we found that distance from an origin of replication was associated with increased mutation rates in the B but not in the A compartment. The enhanced polymorphisms distal to replication origins suggest that replication termination may have a causal role in their generation. Further mutational analyses revealed that the sequences in the A compartment are less likely to be mutated, and that there is stronger purifying selection than in the B compartment. Finally, we applied the Assay for Transposase-Accessible Chromatin using sequencing (ATAC-seq) to show that the B compartment is less accessible than the A compartment. Taken together, our data suggest that compartmentalization of chromosomal DNA can influence chromosome evolution in Sulfolobus. We propose that the A compartment serves as a haven for stable maintenance of gene sequences, while sequences in the B compartment can be diversified.


Conflict of interest statement

Competing interests

The authors declare no competing interests.

Figures

Extended Data Fig. 1 |
Extended Data Fig. 1 |. The effects of inactivating origins of replication in Sulfolobus islandicus REY15A.
a. Diagram of the Sulfolobus islandicus REY15A chromosome. The three origins of replication are shown as open circles on the chromosome. b. Marker frequency analysis of wild-type cells (left) and cells lacking Orc1–1 and Orc1–3 (right). Marker ratios of sequence tag abundance across the chromosome of exponentially growing cells normalized to non-replicating stationary phase cells are plotted relative to genome position. Genome coordinates are shown on the x-axes. The locations of active origins of replication are indicated above the plots. c. ChIP-seq analysis of ClsN enrichment on wild-type (top) and Δorc1–1, orc1–3 (bottom) chromosomes. All ChIP data are normalized to input DNA. Genome coordinates are shown on the x-axis. d. Scatterplot showing ClsN enrichment in the Δorc1–1, orc1–3 strain versus the wild-type strain for each data bin plotted in panel C. e. Transcript abundance profiles of wild-type (top) and Δorc1–1, orc1–3 strains (bottom) calculated for each gene. Genome coordinates are shown on the x-axis. F. Scatterplot showing RNA abundance in the Δorc1–1, orc1–3 strain versus the wild-type strain for each protein-coding gene.
Extended Data Fig. 2 |
Extended Data Fig. 2 |. SNP density and gene orientation for Sulfolobus islandicus REY15A.
Violin plot of the SNP density in genes oriented head-on or codirectionally with respect to replication, for A and B compartments. The p-value of the Wilcoxon test (two-sided) is indicated and the horizontal line represents the median.
Extended Data Fig. 3 |
Extended Data Fig. 3 |. Raw results of ATACseq analysis in Sulfolobus islandicus E233S.
a. Raw accessibility score for fixed cells, non-fixed cells and purified genomic DNA, plotted along the chromosome. b. DNA abundance in the genomic DNA from replicate 3, used to determine the transposition bias. c. Distribution density of paired-end sequenced insert size, mapped to the A or B compartment. d. Correlation between the raw accessibility score of replicates.
Extended Data Fig. 4 |
Extended Data Fig. 4 |. Phylogeny of the Sulfolobales.
16S rRNA phylogeny of Sulfolobales species with at least one complete genome sequenced, computed by ML. Species analyzed in this article are indicated in bold. Chi2-based likelihood is indicated when lower than 90%.
Extended Data Fig. 5 |
Extended Data Fig. 5 |. 3C-seq contact heat-maps and marker frequency analysis (MFA) for Sulfurisphaera tokodaii strain 7.
a. Heat-map representing the contact score of pairs of 5-kb bins for iced-normalized 3C-seq data. b. Pearson-correlation analysis of the matrix presented in A. C. Marker Frequency Analysis. Read count ratios of exponentially growing cells normalized to non-replicating stationary phase cells are plotted relative to genome position.
Extended Data Fig. 6 |
Extended Data Fig. 6 |. 3C-seq contact heat-maps and marker frequency analysis (MFA) for Sulfuracidifex tepidarius JCM16833.
a. Heat-map representing the contact score of pairs of 5-kb bins for iced-normalized 3C-seq data. b. Pearson-correlation analysis of the matrix presented in A. c. Marker Frequency Analysis. Read count ratios of exponentially growing cells normalized to non-replicating stationary phase cells are plotted relative to genome position.
Extended Data Fig. 7 |
Extended Data Fig. 7 |. Comparison of normalization methods for the quantification of 3C contact scores for Sulfuracidifex tepidarius JCM16833.
The distribution of the enzyme AluI restriction sites, DNA abundance in the analyzed cell population and various contact scores are plotted along the chromosome. Dot color indicates the compartment.
Extended Data Fig. 8 |
Extended Data Fig. 8 |. Primary chromosome organization in Sulfolobus acidocaldarius DSM639.
a. Chromosome organization, including the localization of the compartments, the origins of replication and the putative zones where replication forks collapse b to d. SNP density, ClsN enrichment and transcription level of protein-coding genes plotted in function of their distance to the nearest origin of replication for the A (red circle) and B (blue square) compartments. Continuous lines represent linear regressions for the A compartment in red, and the B compartment in blue. Pearson correlation p-values and coefficients are indicated for the A and B compartments. e. Violin plot of the distance to the nearest origin of replication for the dispensable and essential protein-coding genes of the A and B compartments. f. Violin plot of the G4 count per 10 kb window for A and B compartments. g. Violin plot of the SNP density in essential or dispensable protein-coding genes for the A and B compartments. h. Violin plot of the SNP density in genes oriented head-on or codirectionally with respect to replication, for A and B compartments. i. dN/dS of protein-coding genes plotted along their position on the chromosome. The A and B compartment localizations are indicated in red and blue respectively. Black vertical lines represent protein-coding genes that do not have orthologues in all the strains of the Sulfolobus acidocaldarius dataset and for which no dN/dS value was calculated. j. Violin plots of dN/dS value of protein-coding genes and of essential or dispensable protein-coding genes in the A and B compartments. dN/dS presented a bimodal distribution. The p-value of the Kolmogorov-Smirnov test (two-sided) is indicated at the top in bold. Two-sided student tests were performed for values higher or lower than the anti-mode and their p-values are indicated in in italic. For violin plots, except in J, the p-value of the Wilcoxon test (two-sided) is indicated and the horizontal line represents the median.
Extended Data Fig. 9 |
Extended Data Fig. 9 |. Dotplot of orthologous genes between pairs of Sulfolobales strains.
Vertical and Horizontal red backgrounds indicate the A compartment in the corresponding strains. The dot color indicates the gene compartment conservation between the two strains.
Fig. 1 |
Fig. 1 |. Chromosome organization and proximity to origin of replication.
a, Chromosome organization, including the localization of the compartments, the origins of replication localization (bold black squares) and the putative zone where replication forks collapse. Coordinates are in megabasepairs. bd, density (b), ClsN enrichment (c) and transcription level (d) of protein-coding genes plotted as a function of their distance to the nearest origin of replication for the A (red circle) and B (blue square) compartments. TPM, transcripts per million reads. Continuous lines represent linear regressions for the A compartment in red, and the B compartment in blue. Dark red dotted lines represent linear regressions for the A compartment excluding the 15 genes located in the A domain at position 0.7 Mb. Pearson correlation P values and coefficients are indicated for the A compartment excluding the 15 points and for the B compartment. e, Violin plot of the distance to the nearest origin of replication for the dispensable and essential protein-coding genes of the A and B compartments. Numbers on the left of the figure represent “n”. The P value of the Wilcoxon test (two-sided) is indicated and the centre line represents the median.
Fig. 2 |
Fig. 2 |. Heterogeneous SNP distribution in the A and B compartments.
a, SNP count per 10 kb window (top) and compartment index (bottom) along the chromosome. The A and B compartment localizations are indicated in red and blue, respectively. Darker shade in the top panel indicates windows that were excluded from the analysis because of underestimated or outlying high SNP count (Materials and Methods). b, Violin plot of the SNP count per 10 kb window for the A and B compartments. c, Violin plot of the SNP density in essential or dispensable protein-coding genes for the A and B compartments. For violin plots, the P value of the Wilcoxon test (two-sided) is indicated and the centre line represents the median.
Fig. 3 |
Fig. 3 |. Distribution of G4 and IS in the A and B compartments.
a, Violin plot of the number of G4 per 10 kb window. The P value of the Wilcoxon test (two-sided) is indicated and the centre line represents the median. bd, Proportion of IS (b,c) or G4 (d) observed or expected from a random distribution of IS along the chromosome, with or without a constrained biased distribution between compartments. ***P = 0 (see Materials and Methods for the P value computation).
Fig. 4 |
Fig. 4 |. Variation of selection in the A and B compartments of Sulfolobus islandicus REY15A.
a, dN/dS of protein-coding genes (black dots) plotted along their position on the chromosome. The A and B compartment localizations are indicated in red and blue, respectively. Grey vertical lines represent protein-coding genes that do not have orthologues in all the strains of the Sulfolobus islandicus dataset and for which no dN/dS value was calculated. b, Bottom: violin plots of dN/dS values of protein-coding genes and of essential or dispensable protein-coding genes in the A and B compartments. dN/dS presented a bimodal distribution. The P values of the Kolmogorov-Smirnov test (two-sided) are indicated in bold font. Two-sided Students t-tests were performed for values higher or lower than the anti-mode and their P values are indicated in light font. NS, not significant. Top: genes under neutral or positive selection (dN/dS > 0.5).
Fig. 5 |
Fig. 5 |. ATAC-seq analysis in Sulfolobus islandicus E233S.
a, Schematic representation of the ATAC-seq analysis, adapted from Buenrostro et al.. Tn5 transposase (orange) binds DNA at accessible loci and simultaneously fragments and tags DNA with sequencing adapters (purple). Transposition events are determined from mapped sequencing reads. The accessibility score is the number of transposition events per 5 kb window across the chromosome, as shown in b and d. b,c, Tn5 transposition bias across the chromosome (b) and violin plot comparison in the A (red) and B (blue) compartments (c). d,e, Normalized accessibility scores for fixed cells or non-fixed cells along the chromosome (d), and violin plot comparison in the A and B compartments (e). f, Correlation between the normalized accessibility score for fixed cells and ClsN enrichment. For violin plots, the P values of the Wilcoxon test (two-sided) are indicated, and the centre line represents the median.
Fig. 6 |
Fig. 6 |. Conservation of compartmentalization and genome evolution in Sulfolobales.
ac, SNP count per 10 kb window along the chromosome (left) and violin plot of its distribution (right) in the A and B compartments for Sulfolobus acidocaldarius DSM639 (a), Sulfurisphaera tokodaii Strain 7 (b) and Sulfuracidifex tepidarius JCM16833 (c). The compartment index is indicated as published for Sulfolobus acidocaldarius and experimentally determined for Sulfurisphaera tokodaii (Extended Data Fig. 5) and Sulfuracidifex tepidarius (Extended Data Fig. 6). Positive values (red) correspond to the A compartment and negative values (blue) to the B compartment. Darker background shade of the SNP plot indicates windows that were excluded from the analysis because of underestimated or outlying high SNP count (Materials and Methods). For the violin plots, the P values of the Wilcoxon test (two-sided) are indicated and the centre line represents the median. d, Normalized contact score within or between compartments for Sulfuracidifex tepidarius JCM16833. The raw contact score was normalized by DNA abundance and AluI restriction site distribution (Extended Data Fig. 7). e, Dotplot of orthologous genes between Sulfolobus acidocaldarius DSM639 and Sulfolobus islandicus REY15A. Vertical and horizontal red backgrounds indicate the A compartment in the corresponding species. The dot colour indicates the gene compartment conservation between the two species.

Similar articles

Cited by

References

    1. Bryant JA, Sellars LE, Busby SJW & Lee DJ Chromosome position effects on gene expression in Escherichia coli K-12. Nucleic Acids Res 42, 11383–11392 (2014). - PMC - PubMed
    1. Mitelman F, Johansson B & Mertens F The impact of translocations and gene fusions on cancer causation. Nat. Rev. Cancer 7, 233–245 (2007). - PubMed
    1. Kempfer R & Pombo A Methods for mapping 3D chromosome architecture. Nat. Rev. Genet 10.1038/s41576-019-0195-2 (2019). - DOI - PubMed
    1. Wit Ede & Laat, Wde A decade of 3C technologies: insights into nuclear organization. Genes Dev 26, 11–24 (2012). - PMC - PubMed
    1. Crane E et al. Condensin-driven remodelling of X chromosome topology during dosage compensation. Nature 523, 240–244 (2015). - PMC - PubMed

Publication types