. 2022 Jun;23(6):868-877.
doi: 10.1038/s41590-022-01210-5. Epub 2022 May 26.

Autoreactive CD8+ T cells are restrained by an exhaustion-like program that is maintained by LAG3

Affiliations

Autoreactive CD8+ T cells are restrained by an exhaustion-like program that is maintained by LAG3

Stephanie Grebinoski et al. Nat Immunol. 2022 Jun.

Abstract

Impaired chronic viral and tumor clearance has been attributed to CD8+ T cell exhaustion, a differentiation state in which T cells have reduced and altered effector function that can be partially reversed upon blockade of inhibitory receptors. The role of the exhaustion program and transcriptional networks that control CD8+ T cell function and fate in autoimmunity is not clear. Here we show that intra-islet CD8+ T cells phenotypically, transcriptionally, epigenetically and metabolically possess features of canonically exhausted T cells, yet maintain important differences. This 'restrained' phenotype can be perturbed and disease accelerated by CD8+ T cell-restricted deletion of the inhibitory receptor lymphocyte activating gene 3 (LAG3). Mechanistically, LAG3-deficient CD8+ T cells have enhanced effector-like functions, trafficking to the islets, and have a diminished exhausted phenotype, highlighting a physiological role for an exhaustion program in limiting autoimmunity and implicating LAG3 as a target for autoimmune therapy.


Conflict of interest statement

Competing interests

D.A.A.V and C.J.W. declare competing financial interests and have submitted patents covering LAG3 that are licensed or pending and are entitled to a share in net income generated from licensing of these patent rights for commercial development. DAAV: cofounder and stock holder – Novasenta, Potenza, Tizona, Trishula; stock holder – Oncorus, Werewolf, Apeximmune; patents licensed and royalties – Astellas, BMS, Novasenta; scientific advisory board member – Tizona, Werewolf, F-Star, Bicara, Apeximmune, T7/Imreg Bio; consultant – Astellas, BMS, Almirall, Incyte, G1 Therapeutics, Inzen Therapeutics; research funding – BMS, Astellas and Novasenta. E.J.W. has consulting agreements with and/or is on the scientific advisory board for Merck, Roche, Pieris, Elstar, and Surface Oncology. E.J.W. has a patent licensing agreement on the PD-1 pathway with Roche/Genentech. E.J.W. is a founder of Arsenal Biosciences. The other authors declare no competing interests

Figures
Extended Data Fig. 1
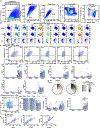
Extended Data Fig. 1. Intra-Islet CD8+ T cells upregulate markers of exhaustion but are a heterogeneous population.
Phenotypic quantification of exhaustion markers in the NOD model of diabetes. (a-f) Spectral flow cytometry for CD8+ T cell functional markers was completed over a time course of 6–14-week-old female WT NOD mice. Representative flow plots are derived from total intra-islet CD8+ T cells (gated on lymphocytes, single cells, Live, Thy1.2+, CD8b+) of 12-week-old female NOD. Data were accumulated from a total of 5 experiments, each experiment had mice of several ages, with n = 10 mice per timepoint, n = 50 total mice. Each point on the graph is representative of a single mouse. (a) Representative flow plotting demonstrating gating strategy to obtain CD8+ T cells. (b) High dimensional analysis at 12 weeks of age was preformed using Cytobank viSNE map analysis (Methods). viSNE maps are shown portraying the 11 markers are used to create FlowSOM clustering analysis. (c) Representative flow plots of intra-islet CD8+ T cell PD1 and LAG3 (6 vs 12 weeks p=.0355), TIGIT (6 vs 12, 14 weeks p=.0005, .0011), TIM3, CTLA4, and ICOS expression are shown islets and expression of IRs are quantified from the ndLN, pLN, and islets. (d) Co-expression of multiple IRs and the transcription factor TOX are represented in Simplified Presentation of Incredibly Complex Evaluations (SPICE) plots showing bulk CD8+ T cells from 6- and 12-week-old islet samples. (e) Representative flow plots and quantification of bulk intra-islet CD8+ T cell expression of TCF1 and TOX populations. (TCF1–TOX+ 6 vs 12, 14 weeks, p=0.0029, 0.0021) (f) % TOX+ correlation to PD1 (p<.0001), TIGIT (p<.0001), and LAG3 (p<.0001). Pearson’s correlation coefficients and r2 values were calculated. (c and e) A two-sided nonparametric Mann-Whitney was preformed. Graphs portray the median. P = * <0.05, ** < 0.01, *** < 0.001, **** < 0.0001. Unlabeled indicates not statistically significant.
Extended Data Fig. 2
Extended Data Fig. 2. Intra-islet CD8+ T cells express LAG3, which marks exhausted CD8+ T cells, though total intra-islet CD8+ T cells also share features of effector T cells.
Transcriptional and epigenetic analysis was performed on intra-islet CD8+ T cells (a) WT Lag3 locus is shown in the top panel. The Lag3L/L-YFP construct is generated by inserting LoxP sites flanking the transmembrane region, exon 7, of the Lag3 gene (middle panel). (b) YFP expression is demonstrated in the Lag3L/L-YFP.NOD, marking those CD8+ T cells which have transcribed Lag3. (c-d) Bulk population RNAseq was preformed comparing intra-islet YFP+ and YFP CD8+ T cells, along with YFP ndLN and pLN controls. Cells are pooled from 3 Lag3L/L-YFP.NOD 8 week old females in 2 independent experiments. (c) Relative expression of selected co-stimulatory or co-inhibitory receptors in the YFP+ vs YFP intra-islet CD8+ T cells. (d) Leading-edge gene set enrichment analysis was preformed comparing YFP+ and YFP intra-islet CD8+ T cells to published exhaustion and activation datasets. NES = Normalized Enrichment score, fdr = false discovery rate. (Methods) (e) scATACseq was preformed comparing E8iCRE/CRE-GFP.NOD CD8+ T cells derived from islets and ndLN (n = 4, 8 week Females). Enrichment for effector signature peaks is shown.
Extended Data Fig. 3
Extended Data Fig. 3. ~50% of intra-islet CD8+ T cells express markers of memory, while only a small fraction express marker of naivety or effector function, while Tetramer+ cells have minimal changes in phenotype with disease progression.
Flow cytometric quantification of markers associated with naïve, effector, and memory CD8+ T cell subsets. (a-g) Spectral flow cytometry for CD8+ T cell functional markers was completed over a timecourse of 6–14-week-old female WT NOD mice. Representative flow plots are derived from total intra-islet CD8+ T cells (gated on lymphocytes, single cells, Live, Thy1.2+, CD8b+) of 12-week-old female NOD. Data were accumulated from a total of 5 experiments, each experiment had mice of several ages with n = 10 mice per timepoint, n = 50 total mice. Each point on the graph is representative of a single mouse. Data shown is analyzing total intra-islet CD8+ T cells, gated on Live, Thy1.2+, CD8b+ or PD1+ vs PD1 intra-islet CD8+ T cells. (a) Representative flow plot and quantification of CD127 expression on total ndLN, pLN and intra-islet CD8+ T cells (6 vs. 8, 12, 14 weeks, p=.0288, .0089, .063) (b) Representative flow plot and quantification of CD127 expression on or PD1+ vs PD1 intra-islet CD8+ T cells (PD1+ vs PD1 p<.000001 at all time points, 6 vs 12, 14 weeks PD1+ p=.05, .05). (c) Quantification of CD62L in islets compared to ndLN and pLN, as well as on intra-islet PD1+ vs PD1 populations. (d) Representative flow plot and MFI of CD44 expression on ndLN, pLN, islet, and islet PD1 subsets. (e) Representative flow plot of KLRG1 expression and quantification of KLRG1 on ndLN, pLN, islet, and islet PD1 subsets (PD1+ vs PD1 6, 8, 10, 12, 14 weeks p = .0288, .0011, .0003, .000076, .000011, 6 vs 14 weeks PD1+ p=.055). (f) Quantification of tetramer+ CD8+ T cells in the islet’s over time. (g) Expression of CD8+ T cell functional markers on tetramer+ populations in the islets. Only samples consisting of >40 Tetramer+ CD8+ T cells are shown. Tetramer staining in lymph nodes was negligible and never exceeded 40 tetramer+ cells. (a-g) Each data point corresponds to a single mouse. A two-sided nonparametric Mann-Whitney was preformed, where P = * <0.05, ** < 0.01, *** < 0.001, **** < 0.0001. Unlabeled indicates not statistically significant. Graphs portray the median.
Extended Data Fig. 4
Extended Data Fig. 4. A subset of intra islet CD8+ T cells upregulate markers of exhaustion, as well as effector cell markers.
(a-d) Spectral flow cytometry for CD8+ T cell functional markers was completed and representative flow plots and graphs appear as described in Extended Data Figure 1, with the added sub gate of PD1+ and PD1. (a) representative flow plot of intra-islet CD8+ T cells PD1 expression. (b) Representative flow plots and quantification of LAG3 and TIGIT expression on PD1+ and PD1 intra-islet CD8+ T cells. (LAG3+TIGIT+: PD1+ vs PD1 6, 8, 10–14 weeks p=.0005, .000002, <.000001, 6 vs 12, 14 weeks PD1+ p=.0039, .0065. LAG3TIGIT: PD1+ vs PD1 6, 8–14 weeks p=.000174, <.000001, 6 vs 10, 12, 14 weeks PD1+ p=.028, .006, .005). (c) Representative flow plots of TCF1 and TOX staining on PD1+ and PD1 intra-islet CD8+ T cells. (d) quantification of (c) (TCF1+TOX: PD1+ vs PD1 p=.000011 at all time points, 6 vs 10, 12, 14 weeks PD1+ p=.0027, .0019, .0064. TCF1+TOX+: PD1+ vs PD1 p=<.000001 at all timepoints. TCF1TOX+: PD1+ vs PD1 6, 8–14 weeks p=.000262, <.000001, 6 vs 8, 10, 12, 14 weeks p=.0355, .0355, .0147, .0014). (e-f) Total intra-islet CD8+ T cells from 12-week-old female WT NOD mice were analyzed by spectral flow cytometry including ndLN and pLN controls (n=10, 2 independent experiments). (e) Representative flow plots (islets) and quantification of CD73 and CD39 expression (CD73+: islets vs ndLN, pLN p=<.0001, .06. CD39+CD73+: islets vs ndLN, pLN, p=<.0001, .0142. CD39+: islets vs ndLN, pLN, p=<.0001, .0315). (f) Representative flow plots (islets) and quantification of Tbet and Eomes expression (Tbet+: islets vs ndLN, pLN, p=.0056, .0003. Eomes+: islets vs ndLN, pLN, p=.0005, <.0001). (g-i) intra-islet CD8+ T cells were isolated and from 12-week-old female WT NODs and analyzed by flow cytometry for metabolic markers or cytokines (n = 10, 2 independent experiments, techniques described in methods) (g) intra-islet CD8+ T cells are stained for TMRM (islets vs ndLN, pLN p=<.0001, .0106), (h) MitoSOX (islets vs. ndLN and pLN, p<.0001) and CellROX (islets vs ndLN p=.0019), and for (i) cytokine production. (a-i) Each data point corresponds to a single mouse. A two-sided nonparametric Mann-Whitney was preformed, where P = * <0.05, ** < 0.01, *** < 0.001, **** < 0.0001. Unlabeled indicates not statistically significant. Graphs portray the median.
Extended Data Fig. 5
Extended Data Fig. 5. scRNAseq reveals transcriptionally unique clusters and functions of Cre Control versus Lag3∆TM CD8+ T cells.
scRNAseq assessment of intra-islet CD8+ T cells. (a) The Lag3L/L-YFP (Extended Data Fig. 2a) construct crossed to a Cre recombinase is shown. Upon crossing Lag3L/L-YFP to a Cre recombinase, exon 7 (the transmembrane domain) is deleted (Lag3∆TM). The result is the generation of only the soluble form of LAG3 protein. (b) qPCR determining deletion efficiency of the CD8 specific LAG3ΔTM mouse. Ratio of Exon 7 to Exon 3 was quantified in Cre Control (E8ICRE/CRE-GFP.NOD), vs Lag3∆TM (Lag3L/L-YFPE8ICRE/CRE-GFP.NOD) experimental mice. Cells derived from spleens of five 8-week-old females for 1 experiment (n = 5). (c-g) CD8+ T cells from the islets and ndLN were isolated from 4 Cre Control and 4 Lag3∆TM 8-week-old NOD female mice and were subjected to 5’ paired single cell RNAseq (scRNAseq) and single cell T cell receptor sequencing (scTCRseq). (c) Cells were visualized by UMAP and colored by tissue, genotype, or individual sample. (d) Quantification of specific cell types in each DRAGON cluster (Fig. 3b). (e) Overrepresentation analyses on gene signatures characterizing the Cre Control (6) and Lag3∆TM dominated clusters (3+4) was performed using KEGG pathways and the top 10 overrepresented in each genotype are shown. Enrichment ratio and –log10FDR (false discovery rate) are portrayed. (f) Heatmap of gene expression levels in the over-represented KEGG pathways.
Extended Data Fig. 6
Extended Data Fig. 6. Pseudotemporal analysis recapitulates the development of exhaustion in intra-islet CD8+ T cells and reveals key differences between Lag3ΔTM and Cre Controls.
Diffusion maps were constructed and pseudotemporal ordering was inferred (Methods) using single-cell RNAseq data described in Ext. Data Fig. 5. (a-d) CD8+ T cells from the islets and ndLN were isolated from 4 Cre Control and 4 Lag3∆TM 8-week NOD female mice and were subjected to 5’ paired single cell RNAseq (scRNAseq) and single cell T cell receptor sequencing (scTCRseq). Unless otherwise noted, red is representative of Lag3∆TM dominated clusters (3+4) and blue is representative of Cre Control dominated clusters (6). Diffusion component 1 and 2 portray the trajectory of CD8+ T cell differentiation. (a) Diffusion pseudotime colored by DRAGON cluster (Fig. 3b). (b-d) Differential gene expression as a function of diffusion pseudotime. Genes associated with early pseudotime (b), mid-pseudotime (c), and late pseudotime (d). Red corresponds to ORA markers of Lag3∆TM dominated clusters and blue is representative of Cre Control dominated cluster markers derived from ORA analysis. Two sided Pearson’s correlation was used to calculated the Pearson’s correlation coefficient where P <2.2x10⁻¹⁶ (indicated as ****) in all cases.
Extended Data Fig. 7
Extended Data Fig. 7. TCR clonality in conjunction with diffusion pseudotime distinguish Lag3ΔTM and Cre Control samples.
(a-d) CD8+ T cells from the islets and ndLN were isolated from 4 Cre Control and 4 Lag3∆TM 8-week NOD female mice and were subjected to 5’ paired single cell RNAseq (scRNAseq) and single cell T cell receptor sequencing (scTCRseq). Red is representative of Lag3∆TM dominated clusters (3+4) and blue is representative of Cre Control dominated clusters (6). (a-b) 5’ scTCRseq was analyzed for frequency of expanded clones (a) and number of unique clones (b). Here, the line is the median, box is lower and upper quantiles (lower 25% and upper 25%), the upper whisker is the minimum of either the maximum value or the upper quartile plus 1.5 times the interquartile ranger. Bottom whisker is the maximum of the minimum or the first quartile minus 1.5 times in interquartile ranger. (c-d) Diffusion component 1 and 2 portray the trajectory of cellular development. (c) Diffusion pseudotime trajectory was divided into 5 clusters based on DC1 and DC2. Enrichment for islets begins in cluster 3, and clusters 4 and 5 constitute ~90% of cells derived from islets. (d) Expression of genes differentially regulated over time between Cre Control and Lag3∆TM in clusters enriched for cells derived from islet (i.e. clusters 3, 4 and 5).
Extended Data Fig. 8
Extended Data Fig. 8. Network analysis reveals differences in possible interactions between Lag3ΔTM and Cre Control
(a-c) CD8+ T cells from the islets and ndLN were isolated from 4 Cre Control and 4 Lag3∆TM 8-week NOD female mice and were subjected to 5’ paired single cell RNAseq (scRNAseq) and single cell T cell receptor sequencing (scTCRseq). Unless otherwise noted, red is representative of Lag3∆TM seed genes (Clusters 3+4) and blue is representative of Cre Control seed genes (Cluster 6) (Supplementary Table 4). For subnetworks, all gene names are shown. (a) Protein subnetworks characterizing Cre Control (b) Protein subnetworks characterizing Lag3∆TM cells (c) Degree distribution for the different subnetworks showing that Cre Control have a higher frequency of networks with fewer connections
Extended Data Fig. 9
Extended Data Fig. 9. LAG3 deletion has moderate impacts on proliferation, but phenotypically skews cells to an effector, rather than restrained phenotype.
The consequences of LAG3 deletion were evaluated by flow cytometry to phenotype intra-islet CD8+ T cells for survival, proliferation, and IR/exhaustion related marker expression. (a-e) Flow cytometry was performed on 8-week-old female Lag3∆TM and Cre Controls taking cells from ndLN, pLN and islets. Data points derived from islets having <40 tetramer+ cells were excluded. Tetramer staining in lymph nodes was negligible and never exceeded 40 Tetramer+ cells. (a) BrdU was injected intraperitoneally 12 hours prior to harvest, and percent BrdU, Ki67, cleaved Caspase 3 (p=.0496), and BCL2 were assessed by flow cytometry (2 independent experiments, n = 6–8 per genotype). (b) CD8+ T cells were labeled with cell trace violet, sorted into 96 well round bottom plate containing 0.05 ug/mL αCD3/CD28, and 200U/mL IL-2 in cRPMI, and cultured for 60 hours and analyzed by flow cytometry (2 independent experiments, n = 6 per genotype). (c) IRs/markers of restraint (TIGIT, TCF1, PD1, and TOX) expression were quantified on total and tetramer positive CD8+ T cells (3 independent experiments, n =13–15 per genotype Tetramer: TIGIT, PD1, TOX, p=.0473, .0473, .0096). (d) Percent expression of effector molecules CD44 (3 independent experiments, n = 13–15 per genotype ndLN, pLN, Islets p=.0016, .0007 .0037) and KLRG1 (1 independent experiment, n = 4–5 per genotype p=.036). (e) Percent expression of PD1 and TOX (Nrpv7+ p=.0259, InsB+ p=.0204), CD39 and Eomes (p=.03), double positive populations, markers of exhaustion, were monitored on bulk and tetramer positive ndLN, pLN, and intra-islet CD8+ T cells (3 independent experiments, n = 13–15 per genotype and 2 independent experiments, n = 5–6 per genotype, respectively). (a-e) Each data point corresponds to a single mouse. A two-sided nonparametric Mann-Whitney statistical test was preformed where P = * <0.05, ** < 0.01, *** < 0.001, **** < 0.0001. Unlabeled indicates not statistically significant. Graphs portray the median.
Extended Data Fig. 10
Extended Data Fig. 10. LAG3 deletion doesn’t affect single cytokine production or metabolic capacity
The consequences of LAG3 deletion were evaluated by flow cytometry to phenotype intra-islet CD8+ T cells for cytokine production, metabolic capacity, and antigen specificity. (a-d) Flow cytometry was performed on 8-week-old female Lag3∆TM and Cre Controls taking cells from ndLN, pLN and islets. (a-b) lymphocytes were stimulated ex vivo for 5 hours with PMA, ionomycin, and brefeldin A and then assessed for cytokine production and degranulation. CD107a, GzmB, Tnfα and IFNγ were quantified (2 independent experiments n = 6–7 per genotype). Cytokine production is unchanged between genotypes, though dual cytokine production, an indicator of polyfunctionality, IFNγ+Gzmb+, is increased in Lag3∆TM (ndLN, pLN, Islet p=.0083, .035, .44) (b). (c) Lymphocytes were isolated from islets, ndLN, and pLN, cultured in serum free media for 37 degrees C in the presence of GlucoseCy5, CellROX, or MitoSOX, for 30 mins, surface stained including TMRE and MitoTracker, and analyzed by flow cytometry (2 independent experiments, n=2–6 per genotype). Lag3L/L-YFP.NOD controls were included in this experiment to control for fluorescent protein expression that may overlap with metabolic markers. (a-c) Each data point corresponds to a single mouse. A two-sided nonparametric Mann-Whitney statistical test was preformed where P = * <0.05, ** < 0.01, *** < 0.001, **** < 0.0001. Unlabeled indicates not statistically significant. Graphs portray the median. (d) representative flow plots of tetramer staining in 8-week-old female Lag3∆TM and Cre Controls intra-islet CD8+ T cells.
Figure 1:
Figure 1:. Intra-Islet CD8+ T cells feature hallmarks of exhaustion.
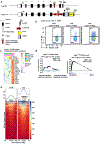
The phenotype of intra-islet CD8+ T cells was assessed by high-dimensional spectral flow cytometry, bulk RNAseq and scATACseq. (a) High dimensional analysis of spectral flow cytometry data of 11 markers on CD8+ T cells from the islets of 12-week-old female NOD using Cytobank (Methods). ViSNE maps were fed into FlowSOM clustering algorithm. (b) Bulk population RNAseq comparing intra-islet YFP+ and YFP CD8+ T cells, along with ndLN and pLN as controls. Cells were pooled from 3 Lag3L/L-YFP.NOD 8-week-old females in 2 independent experiments. Volcano plot illustrating top 4 differentially expressed genes (up and down) in non-bold, as well as markers of exhaustion in bold. (c) scATACseq comparing CD8+ T cells from the islets or ndLN of 8-week-old E8iCRE/CRE-GFP.NOD female mice (n = 4). Enrichment for exhaustion signature peaks is shown. (d) Representative flow cytometry plot of PD1 expression on intra-islet CD8+ T cells gated on Live, Thy1.2+, CD8b+, PD1+. (e) Quantification of LAG3 and TIGIT expression on PD1+ cells over time (6 vs 12, 14 p=.0065, .0039). (f) Representative flow plot and quantification of TCF1 and TOX staining on Live, Thy1.2+, CD8b+, PD1+. Gating based on total or PD1 CD8+ T cells (Extended Data Fig. 1e, 4c–d). (6 vs 10, 12, 14 p=.0027, .0019, .0064). (a, d-f) Spectral flow cytometry for CD8+ T cell functional markers was completed over a time course of 6–14 week old female WT NOD mice. Representative flow plots are derived from intra-islet CD8+ T cells (gated on lymphocytes, single cells, Live, Thy1.2+, CD8b+) of 12-week-old female NOD. Data were accumulated from a total of 5 experiments, each experiment had mice of several ages with n = 10 mice per timepoint, n = 50 total mice. Each point on the graph is representative of a single mouse. A two-sided nonparametric Mann-Whitney was preformed, where P = * <0.05, ** < 0.01, *** < 0.001, **** < 0.0001. Graphs portray the median. Unlabeled indicates not statistically significant.
Figure 2:
Figure 2:. Intra-islet CD8+ T cells are different from canonically exhausted CD8+ cells
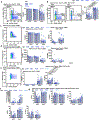
(a-e) Flow cytometric analysis of intra-islet CD8+ T cells from 12-week-old female WT NODs. (a) Representative flow gating and quantification of Eomes and CD39 expression (Islets vs ndLN, pLN p= <.0001, .0005), (b) GlucoseCy5 (Islets vs ndLN, pLN p= .0027, .0012) and MitoTracker (Islets vs ndLN and pLN p= <.0001), (c) Hypoxyprobe (Islets vs. ndLN, pLN, p=.0079, .00709), (d) Hif1α (Islets vs. ndLN, p=.0159) and (e) correlation between correlation of Hypoxyprobe to MFI to HIF1α (p=.0459). (f) Diagram comparing canonical exhaustion to what we observe in the islets. (a-b) Data is representative of 2 experiments, with n = 10. (c-d) Data is representative of 1 experiment with n=5 WT NODs. (a-e) Each point on the graph represents 1 mouse. A two-sided nonparametric Mann-Whitney test was performed. Graphs portray the median. (d) Pearson’s correlation coefficients and r2 values were calculated. (a-e) P = * <0.05, ** < 0.01, *** < 0.001, **** < 0.0001. Unlabeled indicates not statistically significant.
Figure 3:
Figure 3:. LAG3 deletion accelerates disease and halts development in a progenitor stage.
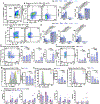
(a) Diabetes incidence in female and male Cre Control (n=28 females, 27 males), Lag3L/L-YFP.NOD (n=14 females, 8 males) and Lag3∆TM.NOD (n=14 females, 19 males). A log-rank (Mantel-Cox) test was used to compare survival curves. (Females: Lag3∆TM vs. Lag3L/L-YFP.NOD, Cre Control, p<.0001 for both comparisons. Males: Lag3∆TM vs. Lag3L/L-YFP.NOD, Cre Control, p=.0042, <.0001) (b-g) CD8+ T cells from the islets and ndLN were isolated from 4 Cre Control and 4 Lag3∆TM 8-week-old female NOD mice and were subjected to paired 5’ scRNAseq and scTCRseq. (b) Cells were visualized by UMAP, and clustering was performed using DRAGON (Methods). Red is representative of Lag3∆TM dominated islet clusters, 3 and 4. Blue is representative of Cre Control dominated islet cluster, 6. Selected functional genes from the top 50 DEGs in each cluster are annotated (Supplementary Table 2). (c) Gene set enrichment analysis using progenitor and terminal exhausted gene sets (Methods). A two-sided T test was used to compare Lag3ΔTM versus Cre Control, the median point is shown on the graph. (d) Diffusion pseudotime analysis was preformed using Destiny (Methods), where cells are embedded in diffusion space using the first two diffusion components DC1 and DC2. (e) Scaled gene expression of selected genes as a function of increasing pseudotime along DC1. Red lettering corresponds to markers of Lag3∆TM dominated clusters and blue lettering is representative of Cre Control dominated cluster markers by ORA. (f) Cell density along DC1. A two-sided Kolmogorov-Smirnov test assess distributions along DC1 (Islet Lag3∆TM vs Islet Cre Control, ndLN Lag3∆TM, ndLN Cre Control, p=1.522x10⁻⁹, <2.22x10⁻¹⁶, <2.22x10⁻¹⁶). (g) Comparison of clonally expanded TCRs (greater than 4 copies) across DC1 comparing Cre Control versus Lag3∆TM within the islets. A box and whisker plot shows frequency of TCRs in greater than median DC1 in each genotype. Here, the line is the median, box is lower and upper quantiles (lower 25% and upper 25%), the upper whisker is the minimum of either the maximum value or the upper quartile plus 1.5 times the interquartile ranger. Bottom whisker is the maximum of the minimum or the first quartile minus 1.5 times in interquartile ranger. A two-sided Wilcoxon rank sum test was used (p=0.024). (a-g) P = * <0.05, ** < 0.01, *** < 0.001, **** < 0.0001.
Figure 4:
Figure 4:. LAG3 deletion accelerates disease by perturbing the ‘restrained’ phenotype.
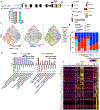
(a) Insulitis and scoring of 8-week-old female and male Cre Controls (10 females, 13 males) and Lag3∆TM NOD mice (11 females, 11 males) (insulitis: Female Cre Control vs Lag3∆TM no insulitis, peri insulitis, insulitis, p = .0006, .05, <.0001, Male Cre Control vs Lag3∆TM no insulitis, peri insulitis, insulitis, p=.0257, .1139, .00218, Scoring: females p=.0001, males p=.0265). (b-f) Flow cytometry was performed on 8-week-old female Lag3∆TM and Cre Controls taking cells from ndLN, pLN and islets. (b) Quantification of T cell percentages and numbers (Percent CD8’s comparing Cre Control vs Lag3∆TM islets p=.0058, Cell numbers CD4+Foxp3, CD8+ p=.028, .0009). Data is representative of 3 independent experiments with n=8–10 per genotype. (c) Chemokine receptor expression with data representative of 2 independent experiment with n=5–6 per genotype (CXCR3 ndLN, pLN, Islet p=.08, .0065, .9, CXCR6 Islet p=.0043). (d) Partial least squares-discriminant analysis (PLS-DA) of exhaustion/activation markers assessed by flow cytometry with data representative of 3 independent experiments n=13–15 per genotype. For the binary classification by genotype AUC = 0.94 in a k-fold cross-validation framework, P < 0.01 compared to a negative control model built using permuted label. (e) Quantification of percent tetramer+ CD8+ T cells found in the islets with data representative of 3 independent experiments with n = 9 per genotype (%InsB+, Nrpv7+ p=.8, .01, #Nrpv7+ p=.0061). (f) Quantification of tetramer+ SLECs (p=.003) and correlation of percent tetramer+ to percent SLECS with data representative of 3 independent experiments with n = 8–10 per genotype (%InsB correlation to SLECs Cre Control, Lag3∆TM p=.08, .9, %Nrpv7 correlation to SLECs Cre Control, Lag3∆TM p=.22, .0027). Graphs show only samples having >100 Tetramer+ cells. Correlation calculation was preformed using Pearson’s correlation coefficients and r2 values were calculated. (g) Model depicting the consequences of LAG3 deletion on CD8+ T cells in islets. Created with BioRender.com. (a-f) A two-sided nonparametric Mann-Whitney test for significance was preformed (unless otherwise noted). Each data point corresponds to a single mouse. Graphs portray the median and error bars are the SEM. P = * <0.05, ** < 0.01, *** < 0.001, **** < 0.0001. Unlabeled indicates not statistically significant.

References

    1. Blank CU et al. Defining ‘T cell exhaustion’. Nat Rev Immunol 19, 665–674, doi:10.1038/s41577-019-0221-9 (2019). - DOI - PMC - PubMed
    1. Beltra JC et al. Developmental Relationships of Four Exhausted CD8(+) T Cell Subsets Reveals Underlying Transcriptional and Epigenetic Landscape Control Mechanisms. Immunity 52, 825–841.e828, doi:10.1016/j.immuni.2020.04.014 (2020). - DOI - PMC - PubMed
    1. Khan O et al. TOX transcriptionally and epigenetically programs CD8(+) T cell exhaustion. Nature 571, 211–218, doi:10.1038/s41586-019-1325-x (2019). - DOI - PMC - PubMed
    1. Scott AC et al. TOX is a critical regulator of tumour-specific T cell differentiation. Nature 571, 270–274, doi:10.1038/s41586-019-1324-y (2019). - DOI - PMC - PubMed
    1. Seo H et al. TOX and TOX2 transcription factors cooperate with NR4A transcription factors to impose CD8(+) T cell exhaustion. Proc Natl Acad Sci U S A 116, 12410–12415, doi:10.1073/pnas.1905675116 (2019). - DOI - PMC - PubMed

Methods References

    1. Godec J et al. Compendium of Immune Signatures Identifies Conserved and Species-Specific Biology in Response to Inflammation. Immunity 44, 194–206, doi:10.1016/j.immuni.2015.12.006 (2016). - DOI - PMC - PubMed
    1. Pauken KE et al. Epigenetic stability of exhausted T cells limits durability of reinvigoration by PD-1 blockade. Science 354, 1160–1165, doi:10.1126/science.aaf2807 (2016). - DOI - PMC - PubMed
    1. Doering TA et al. Network analysis reveals centrally connected genes and pathways involved in CD8+ T cell exhaustion versus memory. Immunity 37, 1130–1144, doi:10.1016/j.immuni.2012.08.021 (2012). - DOI - PMC - PubMed
    1. Leiter EH The NOD mouse: a model for insulin-dependent diabetes mellitus. Curr Protoc Immunol Chapter 15, Unit 15.19, doi:10.1002/0471142735.im1509s24 (2001). - DOI - PubMed
    1. Rodriguez-Calvo T, Ekwall O, Amirian N, Zapardiel-Gonzalo J & von Herrath MG Increased immune cell infiltration of the exocrine pancreas: a possible contribution to the pathogenesis of type 1 diabetes. Diabetes 63, 3880–3890, doi:10.2337/db14-0549 (2014). - DOI - PMC - PubMed

Publication types